
Efficient Marble Slab Classification using Simple Features
Mert Kilickaya
1
, Umut Cinar
2
and Sinan Ugurluoglu
3
1
Department of Computer Engineering, Hacettepe University, Beytepe, Ankara, Turkey
2
3Y Technology, Ankara, Turkey
3
Bilge Technology, Afyon, Turkey
Keywords:
Marble Classification, Color and Texture Recognition.
Abstract:
The marbles consist a large part of the buildings and widely used. Though, the manufacturing process for
marbles are time consuming and inefficient: Human experts assign inconsistent labels to different marble
classes causing a big loss of time and money. It arises the need for an automatic method of classifying marbles.
In this paper we present a novel method which utilizes color, structural and textural representations of a marble.
Once the representation is combined with an accurate segmentation step, it achieves an accuracy of 94% on
a newly collected dataset of 1000 images. We suggest the best settings for an automatic marble classification
system which is simple and fast enough to be used in a real-life environment like marble factories.
1 INTRODUCTION
Marbles consist a large part of constructions, from
houses to hospitals, schools and many more. Al-
though there are a lot of them, marble manufactur-
ing process is time and effort consuming. Marbles
extracted from marble quarries are preprocessed (i.e:,
washing) and divided into different sizes of interest.
After, the experts assign class names to marbles, as
this determines the next step: polishing method dif-
fers among classes. After polishing, another manual
classification is conducted and marbles go for the final
production.
Human experts conduct manual classification two
times for each marble, making it the most critical part
of the manufacturing. Although critical and widely
used, human classification has several limitations.
First, human classification is subjective. Experts
are humans and therefore generally there is no a writ-
ten rule for assigning a marble to a certain class. Ex-
perts generally work long times in marble factory as
their expertise is necessary for each single goes for
the production. Therefore, they begin to assign in-
consistent labels to marbles as their biological vision
system gets tired. We have also seen that experts tend
to assign inconsistent labels under slightly different
lighting conditions.
Second limitation is time. Experts get slower by
the time on marble classification, which causes a big
bottleneck for manufacturing process. The produc-
tion gets more and more dependent on subjective and
time-consuming expert classification by time. These
two limitations arise the need for an automatic way
of classifying marbles: Can we use computer vision
techniques to classify marbles to their corresponding
classes?
Being aware of these criterion, we study marble
classification in an industrial setting, in real life con-
ditions. Previous studies also proposed methods for
classifying marble tiles (Bianconi et al., 2012), mar-
ble slabs (Ar and Akgul, 2008), or colors and textures
(Arivazhagan et al., 2005), however they are applied
on a limited set of marble images making them in-
feasible to apply in real life. Moreover, the feature
sets used by the authors are computationally expen-
sive and hard to adapt to an industrial scenario where
real time performances are necessary. In our work, we
first set up a robotic system which picks and places
marbles on the production line. Then, we capture
marble images using our closed light room with the
same camera settings, under controlled lighting. Four
experts annotated the marbles and we make use of
the ones with the high inter-annotator agreement. We
then study the marble classification by novel methods
we develop and make use of.
To sum up, our contributions are as follows:
• We collect a real-life marble dataset of nearly
1000 images with annotations. We will make the
dataset public upon publication.
192
Kilickaya, M., Cinar, U. and Ugurluoglu, S.
Efficient Marble Slab Classification using Simple Features.
DOI: 10.5220/0005723201920199
In Proceedings of the 11th Joint Conference on Computer Vision, Imaging and Computer Graphics Theory and Applications (VISIGRAPP 2016) - Volume 4: VISAPP, pages 192-199
ISBN: 978-989-758-175-5
Copyright
c
2016 by SCITEPRESS – Science and Technology Publications, Lda. All rights reserved

• We develop and make use of several models to
segment marble images into foreground and back-
ground regions, allowing us to extract appropriate
features from each area.
• Study the performance of different foreground es-
timation methods along with color, texture and
structural features and suggest the best method to
use in a real-life, marble classification setting.
2 RELATED WORK
Our work has strong connections with automatic mar-
ble and granite tiles classification (Bianconi et al.,
2012) (Arivazhagan et al., 2005) (Mart
´
ınez-Alajar
´
ın
et al., 2005) (Ar and Akgul, 2008), material recogni-
tion (Leung and Malik, 2001) (Bell et al., 2014) and
visual saliency estimation (Cheng et al., 2015) (Per-
azzi et al., 2012) (Achanta et al., 2009).
Marble and Granite Classification: Marble and
granite tile classification, yet important, is a less stud-
ied topic in the computer vision community. Here,
the aim is to classify tiles on a marble or a granite
stone according to it’s textural and colour appearance.
In (Bianconi et al., 2012), the authors aim at clas-
sifying 12 commercial classes of granite tiles, each
having 4 different tiles, consisting of 48 pieces in to-
tal. They experiment with several different colour and
texture features, coupled with a bunch of classifiers.
Our work is parallel to theirs as we also aim at find-
ing the best setting for classification. However, our
tests are on a larger scale as we use nearly 1000 mar-
ble images from 10 different categories which shows
significant in-class variations. We experiment with
marbles instead of granite tiles. Also, the feature
set they consider has high computational complex-
ity (i.e:, (Lam, 1996)) which can not be utilized by
a real-life system that requires real-time performance
like ours. Another work deals with marble tiles (Ar
and Akgul, 2008), but experiments using only Ga-
bor filters to locate regions of structure information
like veins, spots and swirls. Our work also makes
use of structural features, but we show that structure
alone is not enough for accurate marble classification.
Probably, the most similar work to ours is (Mart
´
ınez-
Alajar
´
ın et al., 2005) which studies marble slab clas-
sification in an industrial setting. They emphasize the
importance of high-quality image acquisition which
also inspired us while collecting the marble classifi-
cation dataset. Their work states that a marble slab
can be classified into 3 distinct categories according
to the quality features designated in the paper. How-
ever, the scale of their experiments is not large (only
3 classes) and works slow for an industrial setting: it
makes extensive use of Principal Component Analy-
sis (Jolliffe, 2002).
Visual Saliency Estimation: Another line of
work we deal with to build our method is visual
saliency estimation (Cheng et al., 2015) (Perazzi
et al., 2012) (Achanta et al., 2009). Visual saliency
estimation aims at locating image regions with a high
probability of human fixations. Throughout our anal-
ysis, we observe that human experts first locate highly
informative image regions that are captured by their
visual attention system (any region that differs from
it’s surround like regions with high textures or struc-
tures like veins, spots, etc.) and use that informa-
tion extensively to classify marbles. Previous stud-
ies on marble tile and slab classification also aimed
at segmenting a marble into texture/non-texture re-
gions, however, in our experiments we have seen that
they are not fast and accurate enough to be used in
an industrial setting. In our work, we make use of
(Achanta et al., 2009), which is a simple yet effective
method to locate salient image regions in real-time.
We define as foreground any region that differs sig-
nificantly from it’s surround, and the overall appear-
ance of the marble image, and the rest as the back-
ground. This enabled us to accurately study different
features that represent foreground (color, texture and
structure) and background (color) separately.
Material Recognition: The last line of work we
consider here is material recognition (Leung and Ma-
lik, 2001) (Bell et al., 2014). Material recognition
is the study of classifying different types of materi-
als to their corresponding categories. The materials
can be concrete, rug, marble, or leather according to
the texture properties of the surfaces. In our work,
the material is marble, and we work on classifying
the type of marble utilizing not only textural proper-
ties, but also color and structure. We believe that our
findings (i.e:, separating foreground and background
regions for classifying marbles) can also be employed
for recognizing different types of materials.
3 DATASET COLLECTION
One of the major contributions of our paper is a
dataset of nearly 1000 images from 10 marble classes.
A pick and place robot is set up, which can load hun-
dreds of marbles on the production line in a limited
time. In the middle of the line, we set up a closed
room with appropriate lighting conditions, where the
light sources and the camera is set up.
Initially, we collected 6000 marble images where
we had 4 experts to annotate each image. We don’t
make each expert study longer than 1 hour, and keep
Efficient Marble Slab Classification using Simple Features
193
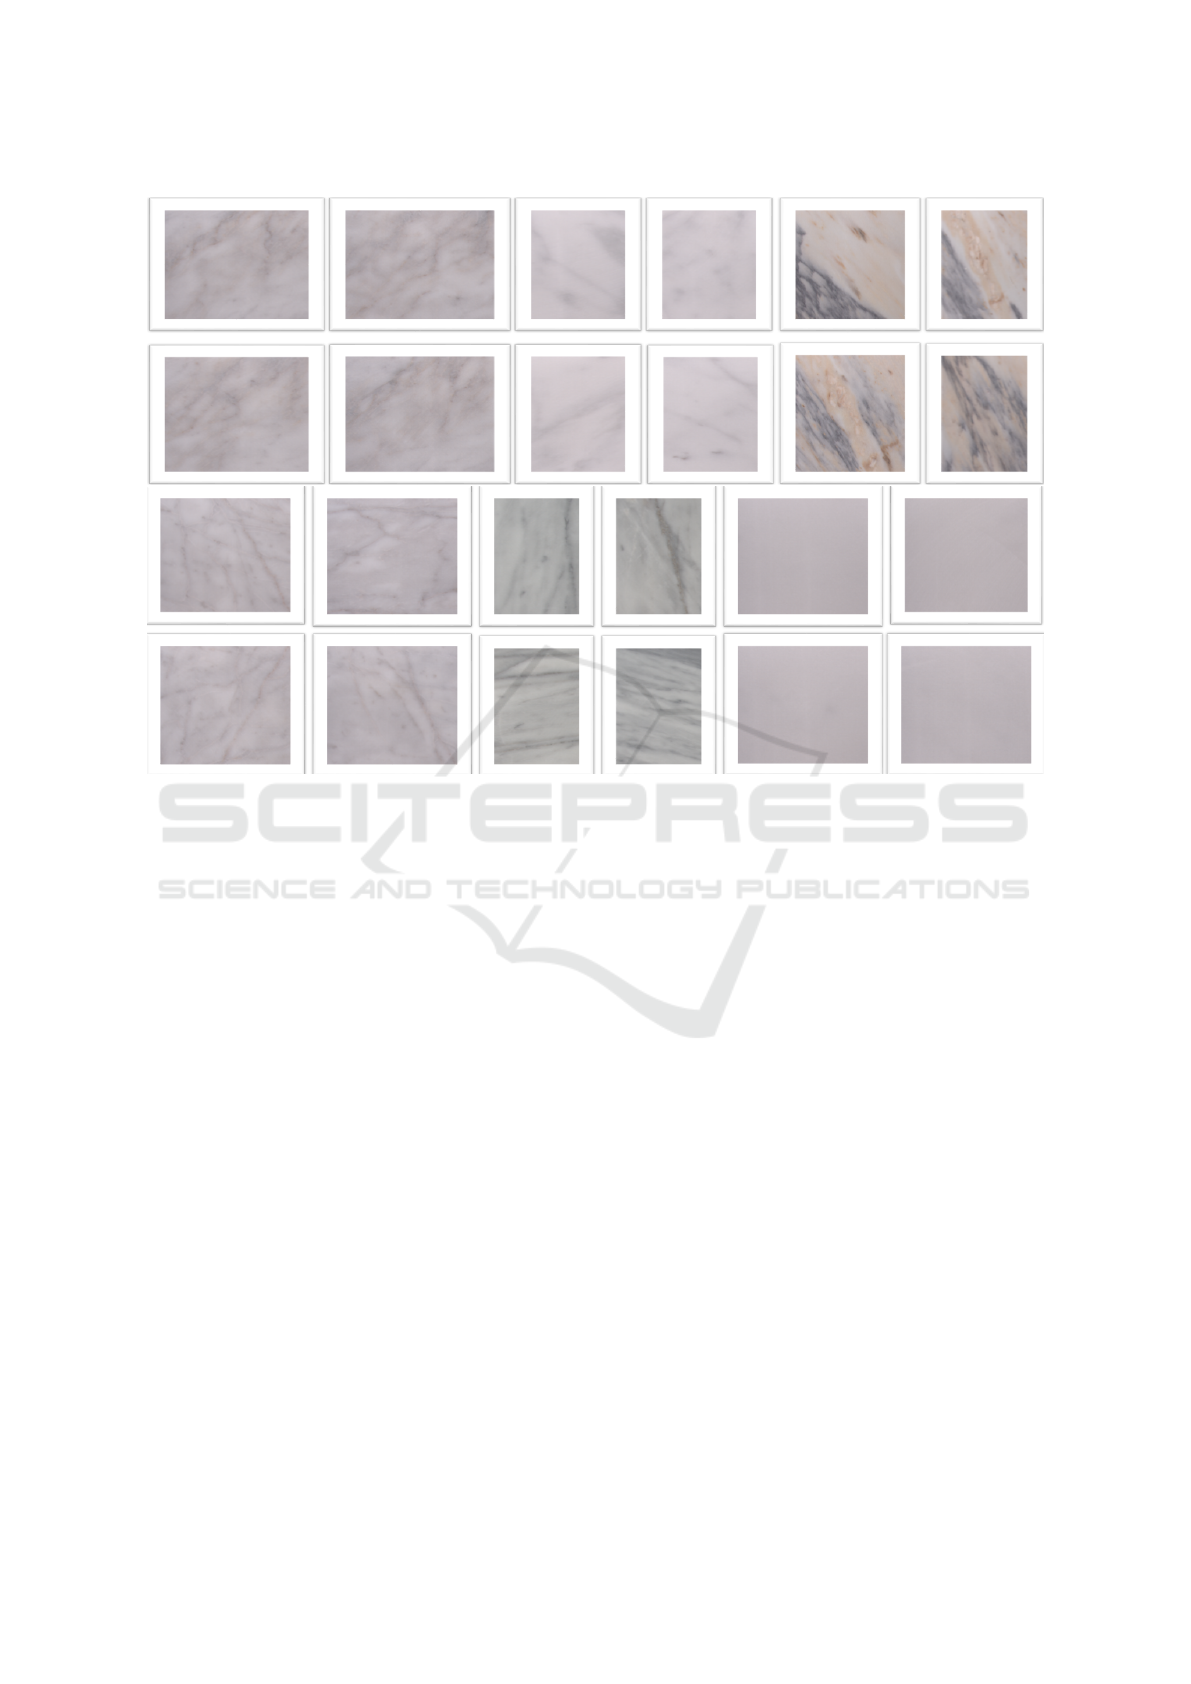
Figure 1: 6 classes of marbles where we show 4 examples from each class (from left to right). Marbles can differ in size and
aspect ratio(best viewed in color).
lighting conditions constant throughout annotations.
This way, we avoid inconsistent annotations as much
as possible. We then kept nearly top 1000 mar-
bles from 10 marble classes with high inter-annotator
agreement. Examples images from the dataset can be
found from Figure 1.
Marbles can pose in-class variations, in terms of
color and texture distributions. Inter-class variability
is low for some of the marble classes making them
hard to distinguish from each other. Some marble
classes are determined according to their background
color distribution, foreground texture and shape dis-
tribution, or a combination of them. This implies that
an accurate estimation of foreground and appropri-
ate color and texture features are necessary to classify
marbles. In the next section, we describe our methods
to conduct foreground estimation, feature extraction
and learning/prediction process.
4 PROPOSED METHOD
Through our discussions with the experts team, we
have noted two main factors that makes a marble
class:
• Colour of the background region
• Texture, color and shape of the foreground ele-
ments of a marble.
Here,the experts imply any high contrast region
that captures their attention at fist sight as foreground,
and the rest as background. A foreground region can
be texture, veins, spots, swirls appear on the mar-
ble. Background is generally smooth, embodies low
variations in color distributions, and without textures.
Foreground and background elements alone are not
sufficient to determine the class of the marble, a com-
bination of them is necessary.
Inspired by humans, we need to develop automatic
methods to segment a marble image as foreground
and background and conduct feature extraction oper-
ations on them separately. The segmentation should
imitate human visual system, and work in real time.
Therefore, we make use of a simple salient region es-
timation method (Achanta et al., 2009). Saliency es-
timation, at its lowest level, aims at capturing high
contrast image regions. It produces a saliency map
where higher values indicate high probability of be-
ing fixated by human eyes. We also make use of
simple OTSU thresholding (Otsu, 1975), in a global
(whole image) and local (thresholding applied dis-
tinctively to image patches of the same sizes) setting.
After, we convert the resulting saliency map to bi-
VISAPP 2016 - International Conference on Computer Vision Theory and Applications
194

Figure 2: Flowchart of our proposed method (best viewed in color).
nary map by thresholding, and apply resulting map to
segment each image. It allows us to represent textu-
ral and structural descriptions of foreground elements
only (instead of the whole image), saving the time and
the memory. Foreground is represented by textural,
color and structural features. When combined with
the background color, it achieves very high accuracies
for marble classification. A flowchart of our method
can be found from Figure 2
In the next section, we first state our foreground
estimation methods, after we continue to discuss fea-
ture extraction and learning stage follows.
4.1 Foreground Estimation
We aim to segment any foreground region accurately
and in real time. As humans tend to detect regions
with high contrast, we implement a similar mecha-
nism here. For a marble, any vein, texture, or anything
that differs from the smooth distribution of back-
ground can be seen as a foreground element.
We first explain the method we use, and then pro-
pose two alternatives using global and local OTSU
thresholding (Otsu, 1975).
4.1.1 Frequency-tuned Saliency Estimation
The method of (Achanta et al., 2009) finds a saliency
map S from an image I:
S
c
(x,y) = |I
µ
− I
c
(x,y)| (1)
where I
µ
is the mean of the channel c, and (x,y)
is the index of the pixels respectively. In our exper-
iments, we first convert a marble image to Lab color
space as it better replicates human visual system. We
computed S
c
for each color channel (S
l
, S
a
and S
b
)
separately, and then obtained the final saliency map
as:
S = S
l
+ S
b
+ S
c
(2)
where higher values indicate higher probabilities
of being a foreground pixel in the saliency map S. Our
final operation is to convert the saliency map S to a
binary map B, where 1’s indicate a foreground pixel
(x,y). To do so, we convert the saliency map as:
B(x,y) = |S(x, y) > c ∗ S
µ
| (3)
where S
µ
is the mean of the saliency map S . We
choose c as 2. This way, we segment any pixel that
differs significantly (2 times from the mean saliency
value of a marble image) from the overall image and
the background. Example results from the foreground
estimation can be found from Figure 3.
4.1.2 Global OTSU
We also employ the simple gray-level thresholding
method of OTSU (Otsu, 1975). OTSU assumes, given
a gray-scale image I
x,y
, and it’s histogram H, there
are two different classes (foreground and background)
exist in the histogram. It finds the optimal value for
the histogram threshold. It iteratively partitions the
histogram to two different classes and measures the
Efficient Marble Slab Classification using Simple Features
195

intra-class variation, stops when the lowest possible
intra-class variation among two classes are achieved.
The optimal threshold idea is suitable to what we aim
to achieve as we also assume that a marble image con-
sists of two different types of regions (foreground and
background). We applied OTSU thresholding to the
images, and obtained the binary image B
globalotsu
for
each image in our dataset.
4.1.3 Local OTSU
OTSU method assumes a global distribution among
different types of image regions, which sometimes is
not true for marbles. A marble image can include a
small detail (a local texture region, a vein or spot)
which, when a globally-optimized threshold is used,
is neglected due to the small area it has. To that end,
we first converted an image I
x,y
to NxN patches where
we apply OTSU thresholding to each local region sep-
arately. This way, we emphasize the effect of small lo-
cal regions that are salient and yet informative about
the class of the marble. We choose N as 25 pixels and
obtain B
localotsu
binary map for each image.
We applied erosion and dilation to the obtained
binary maps B
meansal
, B
globalotsu
and B
localotsu
to ac-
count for residual errors that arise due to noisy pix-
els in the image. In the next sections, we use ob-
tained maps to separate foreground from the back-
ground pixels, either individually or in combination.
4.2 Feature Extraction
After we segment the image, we can extract the color,
texture and structural features from the regions of in-
terest. As we compute pixel-wise features, segment-
ing the marble image allows us to:
Our textural, color and structural features are sim-
ple, yet effective and fast to compute. Below, we de-
scribe our feature set.
4.2.1 Colour Features
Each image is an uncompressed, 16-bit TIFF image.
Since there are little chromatic differences between
some of the marble classes, it is necessary to ob-
tain color information in a greater detail, which exists
in 16-bit information. We compute color histograms
from the image using RGB color space. We find the
bin size of 64 appropriate for our purpose. It results
in a 192d feature vector.
4.2.2 Texture Features
Texture representations has been widely as an impor-
tant differentiator between different marble tiles and
slabs. A texture region can appear in any scale and
orientation in a marble image. An ideal texture rep-
resentation should consider representing similar types
of textures invariant of their scales and orientation. In
other words, we need to make use of a texture descrip-
tor which is rotation-invariant, and captures textures
from different scales.
Filter banks are an efficient way of describing tex-
tures of different types. In this paper, we use Schmid
Filter Banks (Schmid, 2001) which consists of 13 dif-
ferent kernels for describing the texture region. As the
kernels differ in size, they capture the textures with
different scales and do not store orientation informa-
tion.
We first convert each marble image from RGB to a
gray-scale image I(x,y)
gray
. Each gray-scale image is
convolved with 13 different kernels K
i
from the filter
bank as:
C(x, y)
i
= I(x, y)
gray
∗ K
i
(4)
where i ∈ 1,2, ...,13 and C
i
is the convolved ver-
sion of the gray-scale image with the corresponding
filter i for each pixel (x,y).
After, we need to convert the pixel-wise convolu-
tions of each kernel to a 13d feature vector. To do
so, we first computed the absolute sum of each con-
volution result, and normalize the responses with the
number of pixels in the image. Finally, we get the
texture responses for each image in our datasets.
4.2.3 Structural Features
Our final set of features are structural. As stated ear-
lier, efficiently segmenting an image into foreground
and background regions allow to compute structural
statistics of foreground elements. Structural prop-
erties are necessary since some marble classes have
unique structures like vein, spots, swirls or a combi-
nation of them.
We choose to experiment with three measures
of structure, namely area, eccentricity, elongatedness
(C¸ inar et al., 2012). We first obtain the binary map B
using 3 methods detailed in 4.1. Then, for each fore-
ground element , we fit an ellipse around e
i
(where
i ∈ 1,2, ...,N ). We measure the statistics of the el-
lipse to represent the shape of the foreground element
from the binary image. We compute eccentricity as
the ratio of the distance between foci of the ellipse
and its major axis length.
Then, we compute elongatedness Elong
i
(C¸ inar
et al., 2012) of e
i
as:
Elong
i
= (MLength
i
∗ (2 − Extend
i
))
2
/Area
i
(5)
where MLength is the major axis length.
VISAPP 2016 - International Conference on Computer Vision Theory and Applications
196
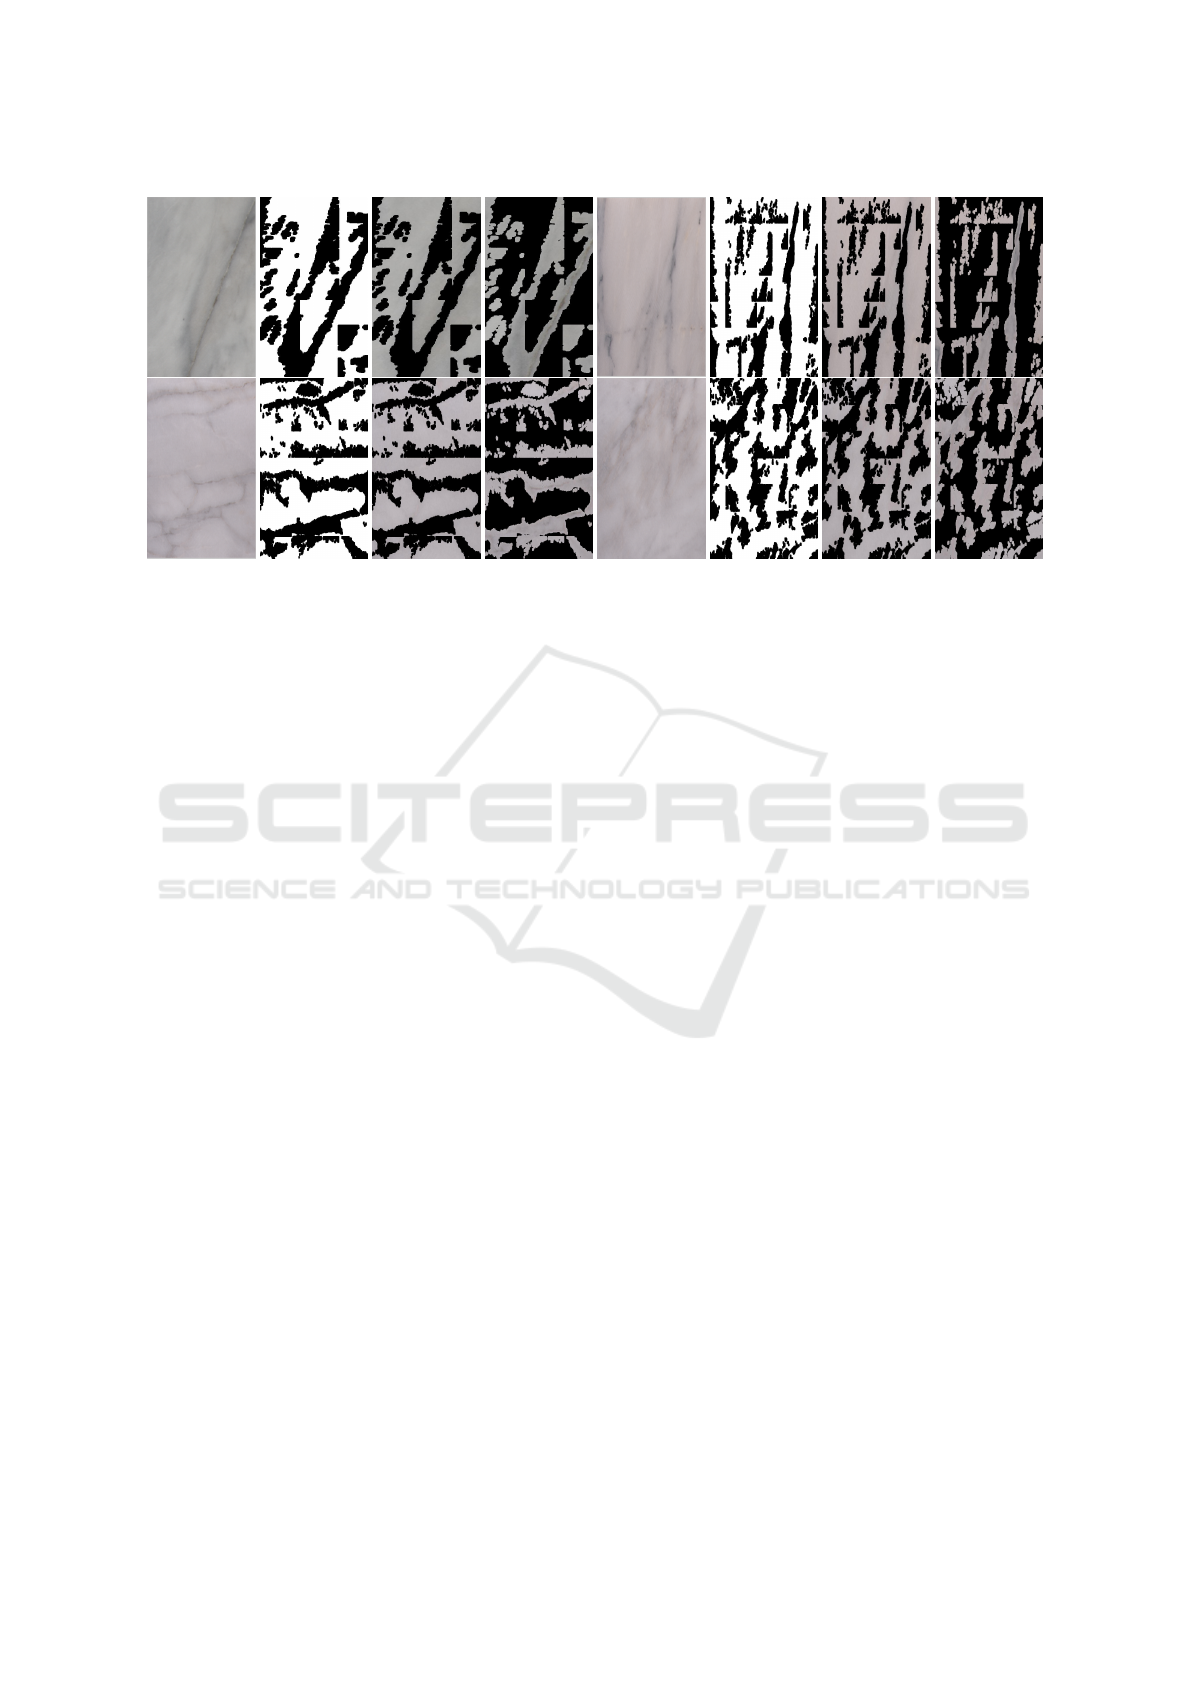
Figure 3: Estimated foreground maps from 4 different images. In sorted order from left to right: Image, Estimated Mask,
Background Segments and Foreground Segments (best viewed in color).
Number of foreground elements can differ be-
tween different marble images, and we only compute
structures for top-10 foreground regions, according to
the area of the ellipse encapsulating this region. We
also use the areas as features.
For each image, we convert eccentricity, elongat-
edness and area measures to a feature vector by mea-
suring their mean and variance in an image. Finally,
we obtain a 6d feature vector which consists of mean
and variance for each of the 3 different cues we ex-
plained above.
As we calculate the features, our next aim is to ef-
ficiently learn a classifier to distinguish between dif-
ferent types of 10 marble classes. In the next section,
we detail our learning and prediction approaches.
4.3 Learning
After we obtain the features for each image of 10
classes, we need a model to distinguish between them.
Among many classifiers, we choose Support Vector
Machines (SVM) because of its efficiency. SVM can
work fast especially on test stage and can generalize
from few examples, making it an appropriate choice
for us.
We split the dataset as 0.60 percent train and
0.40 percent test and represent them with features de-
scribed in Section 4.2. We then choose gaussian ker-
nel (Radial Basis Function or RBF) and cross validate
its parameters (γ and C) using 10-fold cross valida-
tion. We apply the models to each test image and get
predictions.
We described our system to segment foreground
regions of marbles, extract appropriate set of color,
texture and structural features and learn to distinguish
between 10 marble classes. In this paper, our aim is to
suggest the best configuration when building a marble
classification system for real-life conditions. In the
next section, we aim to evaluate different foreground
estimation methods, keeping the feature set constant.
After, by using the best performing foreground esti-
mator, we evaluate the performance of individual fea-
tures (color, texture and structural) and their combina-
tions, for different segments of images (whole image,
foreground elements only, background elements only,
or foreground and background elements in combina-
tion).
5 EXPERIMENTS
In this section, we first evaluate different formulations
for our different foreground estimations. We evaluate
3 settings for foreground estimation. Then, using the
findings from foreground estimation, we evaluate the
performance of each feature alone and in combina-
tion, to suggest the best performing foreground esti-
mation model coupled with the best feature sets. We
use accuracy (mean of the diagonal of the confusion
matrix) to perform each evaluation in the paper.
5.1 Foreground Estimation Accuracy
We need to find the best method (in terms of accu-
racy) that distinguishes between marble classes. To
that aim, we determine a feature set and keep it con-
stant throughout evaluations. We use 3 variants of
foreground estimation methods described in section
4.1
Our configurations are as follows:
Efficient Marble Slab Classification using Simple Features
197

Table 1: Foreground Estimation Performance.
Method Accuracy
Global OTSU 93.1646
Mean Saliency 93.1646
Combination 94.1772
1. Global OTSU: We use the output of Global
OTSU thresholding B
globalotsu
as the foreground
map.
2. Mean Saliency: We use the output of mean
saliency estimation B
meansal
.
3. Combination: We combine the local OTSU
map B
localotsu
and mean saliency map B
meansal
.
Formally, we apply OR operation on two dif-
ferent masks and obtain the combination map
B
combination
as:
B
combination
= B
meansal
+ B
localotsu
(6)
As can be seen from the Table 1, a combination
of B
meansal
with B
localotsu
obtains the highest perfor-
mance. As B
localotsu
receives similar performances,
we extracted it from the result Table.
5.2 Feature Sets and Image Segment
Types
After we determine the best performing foreground
estimation method, we proceed to evaluate different
feature configurations. In this section, we first eval-
uate color histograms (color), filter bank responses
(texture) and morphological features (structure) using
different segment types: whole image (whole), fore-
ground image only (foreground), background image
only (background). Results can be seen from the Ta-
ble 2. Then, we make use of the best combinations to
classify marble images according to:
1. Configuration 1: Colour of the background with
foreground texture features.
2. Configuration 2: Colour of the foreground and
background, texture of the foreground and the
structure from the whole image.
These results can be found from the Table 3.
6 CONCLUSION
In this paper we consider marble classification in an
industrial setting. We begin by collecting and an-
notating a 1000 marble images dataset of 10 marble
classes. Then we develop novel methods to segment
a marble to its foreground and background regions.
Table 2: Individual Feature Accuracies. We report feature
performances for only valid (measurable) settings as we do
not calculate texture features from the background image.
Segment Color Texture Structure
Whole 91.89 64.55 -
Foreground 92 50.12 31.89
Background 91.64 - -
Table 3: Feature Combination Performance.
Configurations Accuracy
Configuration 1 90.6329
Configuration 2 94.1777
We make use of 3 complimentary features that suc-
cessfully represents the type of the marble classes.
Through our analysis, we have found that it is best
to segment a marble image, using a combination of
local OTSU and mean saliency binary maps. We have
also seen that color and texture are powerful features
even when used alone, and the best performance ob-
tained when combining background and foreground
color with foreground textures and the structural fea-
tures.
Although we obtain accurate results using our
foreground estimation method, it is far from being
ideal. We observe that for some images, it throws
away useful parts of an image (i.e:, some of the fore-
ground elements). This can be a possible reason why
structural features alone receives a low performance
compared to the other set of features.
In the future, we will consider using different tex-
tural descriptors like (Cimpoi et al., 2014) , and de-
velop better models to segment marble images, to bet-
ter make use of structural and textural features. We
also plan to extend the dataset to larger set of images
with more classes.
ACKNOWLEDGEMENTS
We would like to thank ENTAS MERMER SAN. ve
TIC. A.S. and Bilge Technology for funding this re-
search.
REFERENCES
Achanta, R., Hemami, S., Estrada, F., and Susstrunk, S.
(2009). Frequency-tuned salient region detection. In
Computer vision and pattern recognition, 2009. cvpr
2009. ieee conference on, pages 1597–1604. IEEE.
Ar, I. and Akgul, Y. S. (2008). A generic system for the
classification of marble tiles using gabor filters. In
Computer and Information Sciences, 2008. ISCIS’08.
23rd International Symposium on, pages 1–6. IEEE.
VISAPP 2016 - International Conference on Computer Vision Theory and Applications
198

Arivazhagan, S., Ganesan, L., and Angayarkanni, V. (2005).
Color texture classification using wavelet transform.
In Computational Intelligence and Multimedia Ap-
plications, 2005. Sixth International Conference on,
pages 315–320. IEEE.
Bell, S., Upchurch, P., Snavely, N., and Bala, K. (2014).
Material recognition in the wild with the materials in
context database. arXiv preprint arXiv:1412.0623.
Bianconi, F., Gonz
´
alez, E., Fern
´
andez, A., and Saetta,
S. A. (2012). Automatic classification of granite tiles
through colour and texture features. Expert Systems
with Applications, 39(12):11212–11218.
Cheng, M., Mitra, N. J., Huang, X., Torr, P. H., and Hu,
S. (2015). Global contrast based salient region detec-
tion. Pattern Analysis and Machine Intelligence, IEEE
Transactions on, 37(3):569–582.
Cimpoi, M., Maji, S., and Vedaldi, A. (2014). Deep con-
volutional filter banks for texture recognition and seg-
mentation. arXiv preprint arXiv:1411.6836.
C¸ inar, U., Karaman, E., Gedik, E., Yardımcı, Y., and Halıcı,
U. (2012). A new approach to automatic road extrac-
tion from satellite images using boosted classifiers. In
SPIE Remote Sensing, pages 85370O–85370O. Inter-
national Society for Optics and Photonics.
Jolliffe, I. (2002). Principal component analysis. Wiley
Online Library.
Lam, S. W.-C. (1996). Texture feature extraction using
gray level gradient based co-occurence matrices. In
Systems, Man, and Cybernetics, 1996., IEEE Inter-
national Conference on, volume 1, pages 267–271.
IEEE.
Leung, T. and Malik, J. (2001). Representing and recog-
nizing the visual appearance of materials using three-
dimensional textons. International journal of com-
puter vision, 43(1):29–44.
Mart
´
ınez-Alajar
´
ın, J., Luis-Delgado, J. D., and Tom
´
as-
Balibrea, L. M. (2005). Automatic system for quality-
based classification of marble textures. Systems, Man,
and Cybernetics, Part C: Applications and Reviews,
IEEE Transactions on, 35(4):488–497.
Otsu, N. (1975). A threshold selection method from gray-
level histograms. Automatica, 11(285-296):23–27.
Perazzi, F., Kr
¨
ahenb
¨
uhl, P., Pritch, Y., and Hornung, A.
(2012). Saliency filters: Contrast based filtering for
salient region detection. In Computer Vision and Pat-
tern Recognition (CVPR), 2012 IEEE Conference on,
pages 733–740. IEEE.
Schmid, C. (2001). Constructing models for content-based
image retrieval. In Computer Vision and Pattern
Recognition, 2001. CVPR 2001. Proceedings of the
2001 IEEE Computer Society Conference on, vol-
ume 2, pages II–39. IEEE.
Efficient Marble Slab Classification using Simple Features
199
