
Copula Eigenfaces
Semiparametric Principal Component Analysis for Facial Appearance Modeling
Bernhard Egger
∗
, Dinu Kaufmann
∗
, Sandro Sch
¨
onborn, Volker Roth and Thomas Vetter
Department of Mathematics and Computer Science, University of Basel, Basel, Switzerland
Keywords:
Copula Component Analysis, Gaussian copula, Principal Component Analysis, Parametric Appearance
Models, 3D Morphable Model, Face Modeling, Face Synthesis.
Abstract:
Principal component analysis is a ubiquitous method in parametric appearance modeling for describing depen-
dency and variance in a data set. The method requires that the observed data be Gaussian-distributed. We show
that this requirement is not fulfilled in the context of analysis and synthesis of facial appearance. The model
mismatch leads to unnatural artifacts which are severe to human perception. In order to prevent these artifacts,
we propose to use a semiparametric Gaussian copula model, where dependency and variance are modeled sep-
arately. The Gaussian copula enables us to use arbitrary Gaussian and non-Gaussian marginal distributions.
The new flexibility provides scale invariance and robustness to outliers as well as a higher specificity in gen-
erated images. Moreover, the new model makes possible a combined analysis of facial appearance and shape
data. In practice, the proposed model can easily enhance the performance obtained by principal component
analysis in existing pipelines: The steps for analysis and synthesis can be implemented as convenient pre- and
post-processing steps.
1 INTRODUCTION
Parametric Appearance Models (PAM) describe ob-
jects in an image in terms of pixel intensities. In the
context of faces, Active Appearance Models (Cootes
et al., 1998) and 3D Morphable Models (Blanz and
Vetter, 1999) are established PAMs to model appear-
ance and shape. The dominant method for learning
the parameters of a PAM is principal component anal-
ysis (PCA) (Jolliffe, 2002). PCA is used to describe
the variance and dependency in the data. Usually,
PAMs are generative models that can synthesize new
random instances.
Using PCA to model facial appearance leads to
models which are able to synthesize instances which
appear unnaturally. This is due to the assumption that
the color intensities or, in other words, the marginals
at a pixel are Gaussian-distributed. We show that
this is a severe simplification: The pixel intensities
of new samples will follow a joint Gaussian distribu-
tion. This approximation is far from the actual ob-
served distribution of the training data and leads to
unnatural artifacts in appearance.
*These authors contributed equally to this work.
The ability to synthesize random and natural in-
stances is important when generating new face in-
stances (Mohammed et al., 2009) and in face ma-
nipulation (Walker and Vetter, 2009). This is be-
cause human perception is very sensitive to unnatu-
ral variability in a face. On the other hand, PCA face
models are used as a strong prior in probabilistic fa-
cial image interpretation algorithms (Sch
¨
onborn et al.,
2013). Hence, such applications require a prior which
follows the underlying distribution as closely as pos-
sible and, which is therefore, highly specific to faces.
In order to enhance the specificity of a PCA-based
model, an obvious improvement would be the exten-
sion to a Gaussian mixture model (Rasmussen, 1999).
Here, each color channel at a pixel is modeled with
an (infinite) mixture of Gaussians. However, we skip
this step and propose to use a semiparametric copula
model directly.
A copula model provides the decomposition of the
dependency and the marginal distributions such that
the copula contains the dependency structure only.
This separate modeling allows us to drop the paramet-
ric Gaussian assumption on the color channels and to
replace them with nonparametric empirical distribu-
tions. We keep the parametric dependency structure;
in particular, we use a Gaussian copula because of its
50
Egger, B., Kaufmann, D., Schönborn, S., Roth, V. and Vetter, T.
Copula Eigenfaces - Semiparametric Principal Component Analysis for Facial Appearance Modeling.
DOI: 10.5220/0005718800480056
In Proceedings of the 11th Joint Conference on Computer Vision, Imaging and Computer Graphics Theory and Applications (VISIGRAPP 2016) - Volume 1: GRAPP, pages 50-58
ISBN: 978-989-758-175-5
Copyright
c
2016 by SCITEPRESS – Science and Technology Publications, Lda. All rights reserved

Figure 1: This figure shows the pre- and post-processing steps necessary to use a Gaussian copula before calculating PCA.
inherent Gaussian latent space. PCA can then be ap-
plied in the latent Gaussian space and is used to learn
the dependencies of the data independently from the
marginal distribution. The method is analytically an-
alyzed in (Han and Liu, 2012) and is called Copula
Component Analysis (COCA). Samples drawn from
a COCA model follow the empirical marginal distri-
bution of the training data and are, therefore, more
specific to the modeled object.
The additional steps for using COCA can be im-
plemented as simple pre- and post-processing before
applying PCA. The data is mapped into a space where
it is Gaussian-distributed. This mapping is obtained
by first ranking the data and then transforming it by
the standard normal distribution. We perform PCA
on the transformed data to learn its underlying depen-
dency structure. All necessary steps are visualized in
Figure 1.
A semiparametric Gaussian copula model also
provides additional benefits: First, learning is invari-
ant to monotonic transformations of all marginals, in-
cluding invariance to scaling. Second, the implemen-
tation can be done as simple pre- and post-processing
steps. Third, the model also allows changing the color
space. For facial-appearance modeling, the HSV
color space is more appropriate than RGB. The HSV
color space is motivated by the separation of the hue
and saturation components and brightness value. On
the other hand, without adaptions, PCA is not appli-
cable to facial appearance in the HSV color space
because of its sensitivity to differently-scaled color
channels.
In summary, methods building on PCA can easily
benefit from these advantages to improve their learned
model.
1.1 Related Work
The Eigenfaces approach (Sirovich and Kirby, 1987;
Turk et al., 1991) uses PCA on aligned facial images
to analyze and synthesize faces. Active Appearance
Models (Cootes et al., 1998) add a shape component
which allows to model the shape independently from
the appearance. The 3D Morphable Model (Blanz and
Vetter, 1999) uses a dense registration, extends the
shape model to 3D and adds camera and illumination
parameters. The 3D Morphable Model allows han-
dling appearance independently from pose, illumina-
tion and shape. These methods have a common core:
They focus on analysis and synthesis of faces and all
of them use a PCA model for color representation and
can, therefore, benefit from COCA.
Photo-realistic face synthesis methods like Visio-
lization (Mohammed et al., 2009) use PCA as a basis
for example-based photo-realistic appearance model-
ing.
1.2 Organization of the Paper
The remainder of the paper is organized as follows:
The methods section explains the copula extension
for PCA and presents the theoretical background for
learning and inference. Additionally, practical infor-
mation for an implementation is provided. In the ex-
periments and results we demonstrate that facial ap-
pearance should be modeled using the copula exten-
sion. We qualitatively and quantitatively show that the
proposed model leads to a facial appearance model
which is more specific to faces.
2 METHODS
2.1 PCA for Facial Appearance
Modeling
Let x ∈ R
3n
describe a zero-mean vector representing
3 color channels of an image with n pixels. In an RGB
image, the color channels and the pixels are stacked
such that x = (r
1
, g
1
, b
1
, r
2
, b
2
, b
3
, .. . , r
n
, g
n
, b
n
)
T
. We
assume that the mean of every dimension is already
subtracted. The training set of m images is arranged
as the data matrix X ∈ R
3n×m
.
PCA (Jolliffe, 2002) aims at diagonalizing the
sample covariance Σ =
1
m
XX
T
, such that
Σ =
1
m
US
2
U
T
(1)
where S is a diagonal matrix and U contains the trans-
formation to the new basis. The columns of matrix U
are the eigenvectors of Σ and the corresponding eigen-
values are on the diagonal of S.
PCA is usually computed by a singular value de-
composition (SVD). In case of a rank-deficient sam-
ple covariance with rank m < n we cannot calculate
Copula Eigenfaces - Semiparametric Principal Component Analysis for Facial Appearance Modeling
51

U
−1
. Therefore, SVD leads to a compressed rep-
resentation with a maximum of m dimensions. The
eigenvectors in the transformation matrix U are or-
dered by the magnitude of the corresponding eigen-
values.
When computing PCA, the principal components
are guided by the variance as well as the covariance in
the data. While the variance captures the scattering of
the intensity value of a pixel, the covariance describes
which regions contain similar color. This mingling of
factors leads to results which are sensitive to differ-
ent scales and to outliers in the training set. Regions
with large variance and outliers could influence the
direction of the resulting principal components in an
undesired manner.
We uncouple variance and dependency structure
such that PCA is only influenced by the dependency
in the data. Our approach for uncoupling is a copula
model which provides an analytical decomposition of
the aforementioned factors.
2.2 Copula Extension
Copulas (Nelsen, 2013; Joe, 1997) allow a detached
analysis of the marginals and the dependency pat-
tern for facial appearance models. We consider a re-
laxation to a semiparametric Gaussian copula model
(Genest et al., 1995; Tsukahara, 2005). We keep the
Gaussian copula for describing the dependency pat-
tern, but we allow nonparametric marginals.
Let x ∈R
3n
describe the same zero-mean vector as
used for PCA, representing 3 color channels of an im-
age with n pixels. Sklar’s theorem allows the decom-
position of every continuous and multivariate cumu-
lative probability distribution (cdf) into its marginals
F
i
(X
i
), i = 1, . . . , 3n and a copula C. The copula com-
prises the dependency structure, such that
F(X
1
, ··· , X
3n
) = C (W
1
, . . . ,W
3n
) (2)
where W
i
= F
i
(X
i
). W
i
are uniformly distributed and
generated by the probability integral transformation
1
.
For our application, we consider the Gaussian
copula because of its inherently implied latent space
˜
X
i
= Φ
−1
(W
i
), i = 1, . . . , 3n (3)
where Φ is the standard normal cdf. The multivari-
ate latent space is standard normal-distributed and
fully parametrized by the sample correlation matrix
˜
Σ =
1
m
˜
X
˜
X
T
only. PCA is then applied on the sample
correlation in the latent space
˜
X.
1
The copula literature uses U instead of W . We changed
this convention due to the singular value decomposition
which uses X = USV
T
.
Algorithm 1: Learning.
Input: Training set {X}
Output: Projection matrices U, S
for all dimensions do
for all samples do
˜x
i j
= Φ
−1
r
i j
(x
i j
)
m+1
find
˜
U,
˜
S such that
˜
Σ =
1
m
˜
U
˜
S
2
˜
U
T
(via SVD)
The separation of dependency pattern and
marginals provides multiple benefits: First, the Gaus-
sian copula captures the dependency pattern invariant
to the variance of the color space
2
. Second, whilst
PCA is distorted by outliers and is generally incon-
sistent in high dimensions, the semiparametric copula
extension solves this problem (Han and Liu, 2012).
Third, the nonparametric marginals maintain the non-
Gaussian nature of the color distribution. Especially
when generating new samples from the trained distri-
bution, the samples do not exceed the color space of
the training set.
2.3 Inference
We learn the latent sample correlation matrix
˜
Σ =
1
m
˜
X
˜
X
T
in a semiparametric fashion using nonpara-
metric marginals and a parametric Gaussian copula.
We compute ˆw
i j
=
ˆ
F
emp,i
(x
i j
) =
r
i j
(x
i j
)
m+1
using empiri-
cal marginals
ˆ
F
emp,i
, where r
i j
(x
i j
) is the rank of the
data x
i j
within the set {x
i•
}. Then,
˜
Σ is simply the
sample covariance of the normal scores
˜x
i j
= Φ
−1
r
i j
(x
i j
)
m + 1
, i = 1, . . . , 3n, j = 1, . . . , m.
(4)
Equation (4) contains the nonparametric part, since
˜
Σ
is computed from the ranks r
i j
(x
i j
) solely and con-
tains no information about the marginal distribution
of the x’s. Note, ˜x ∼ N (0,
˜
Σ) is standard normal dis-
tributed with correlation matrix
˜
Σ. Subsequently, an
eigendecomposition is applied on the latent correla-
tion matrix
˜
Σ.
Generating a sample using PCA then simply re-
quires a sample from the model parameters
h ∼ N (0, I) (5)
which is projected to the latent space
˜x =
˜
U
˜
S
√
m
h (6)
2
More general, a copula model is invariant against all
monotonic transformations of the marginals.
GRAPP 2016 - International Conference on Computer Graphics Theory and Applications
52

Algorithm 2: Sampling.
Output: Random sample x
h ∼ N (0, I)
˜x =
˜
U
˜
S
√
m
h
for all dimensions i do
w
i
= Φ ( ˜x
i
)
x
i
=
ˆ
F
emp,i
(w
i
)
and further projected component-wise to
w
i
= Φ ( ˜x
i
), i = 1, . . . , 3n. (7)
Finally, the projection to the color space requires the
empirical marginals
x
i
=
ˆ
F
emp,i
(w
i
), i = 1, . . . , 3n. (8)
All necessary steps are summarized in Algorithms 1
and 2 and visualized in Figure 1.
It is possible to smoothen the empirical marginals
with a kernel k and replace Equation (8) by x
i
=
k(w
i
, X
i•
), i = 1, . . . , 3n.
2.4 Implementation
The additional steps for using COCA can be imple-
mented as simple pre- and post-processing before ap-
plying PCA. Basically the data is mapped into a latent
space where it is Gaussian-distributed. The mapping
is performed in two steps. First, the data is trans-
formed to an uniform distribution by ranking the in-
tensity values. Then it is transformed to a standard
normal distribution. On the transformed data, we per-
form PCA to learn the dependency structure in the
data.
To generate new instances from the model, all
steps have to be reversed. Figure 1 gives an overview
of all necessary transformations. The following steps
have to be performed, e.g. in MATLAB, to calculate
COCA:
% ca lc ul at e em pi ri ca l cdf
[ emp C DFs , in dex X ] = so r t ( X , 2) ;
% tr an sf or m emp. cdf to un ifo rm
[~, rank ] = sor t ( indexX , 2) ;
un if or mC DF s = rank / ( size (rank , 2) +1) ;
% tr an sf or m uni. cdf to std. n orm al cdf
no r mC DF s = no rmi nv ( un ifo rmC D Fs ' ,0 ,1) ';
% ca lc ul at e PC A
[U ,S ,V ] = svd ( normCD Fs , ' econ ' ) ;
Listing 1: Learning.
To generate an image from model parameters, the fol-
lowing steps are necessary:
% r an d om s amp le
m = si z e ( no rmCDF s , 2) ;
h = r and om (' norm' ,0 ,1 ,m ,1) ;
sam ple = U * S / sq r t ( m ) * h;
% s t d. no rma l to un i fo rm
un if or mS a m p l e = n or m cd f ( sampl e , 0 , ...
1) * ( m - 1) + 1;
% un ifo rm to em p . cdf
em pS a mp le = ...
em p CD Fs ( su b2 ind ( si ze ( emp CD F s ), ...
1: siz e ( data , 1) , ...
rou n d ( uni fo r mS amp le ' )) ) ';
Listing 2: Sampling.
These are the additional steps which have to be
performed as pre- and post-processing for the analysis
of the data and the synthesis of new random samples.
In terms of computing resources we have to consider
the following: The empirical marginal distributions
F
emp
are now part of the model and have to be kept
in memory. In the learning part, the complexity of
sorting the input data is added. In the sampling part,
we have to transform the data back by looking up their
values in the empirical distribution.
The copula extension comes with low additional
effort: it is easy to implement and has only slightly
higher computing costs. We encourage the reader to
implement these few steps since the increased flexi-
bility in the modeling provides a valuable extension.
3 EXPERIMENTS AND RESULTS
For all our experiments, we used the texture of 200
face scans used for building the Basel Face Model
(BFM) (Paysan et al., 2009). The scans are in dense
correspondence and were captured under an identical
illumination setting. We work on texture images and
use a resolution of 1024x512 pixels. Our experiments
are based on the appearance information only, the last
experiment merging the appearance and shape to a
combined model. We used the empirical data directly
as marginal distribution. The results are rendered with
an ambient illumination on the mean face shape of the
BFM.
3.1 Facial Appearance Distribution
In a first experiment we investigate if the color inten-
sities in our face data set are Gaussian-distributed. We
followed the protocol of the Kolmogorov-Smirnov
Test (Massey Jr, 1951). We estimate a Gaussian dis-
tribution for every color channel per pixel and com-
pare it to the observed data. The null hypothesis of
Copula Eigenfaces - Semiparametric Principal Component Analysis for Facial Appearance Modeling
53
the test is that the observed data is drawn by the esti-
mated Gaussian distribution. The test measures the
maximum distance of the cumulative density func-
tion of the estimated Gaussian Φ
ˆµ,
ˆ
σ
2
and the empirical
marginal distribution F
emp
of the observed data:
d = sup
x
F
emp
(x) −Φ
ˆµ,
ˆ
σ
2
(x)
(9)
Here, ˆµ and
ˆ
σ
2
are maximum-likelihood estimates for
the mean and variance of a Gaussian distribution re-
spectively. In Figure 2 we visualize the maximal dis-
tance value over all color channels per point on the
surface.
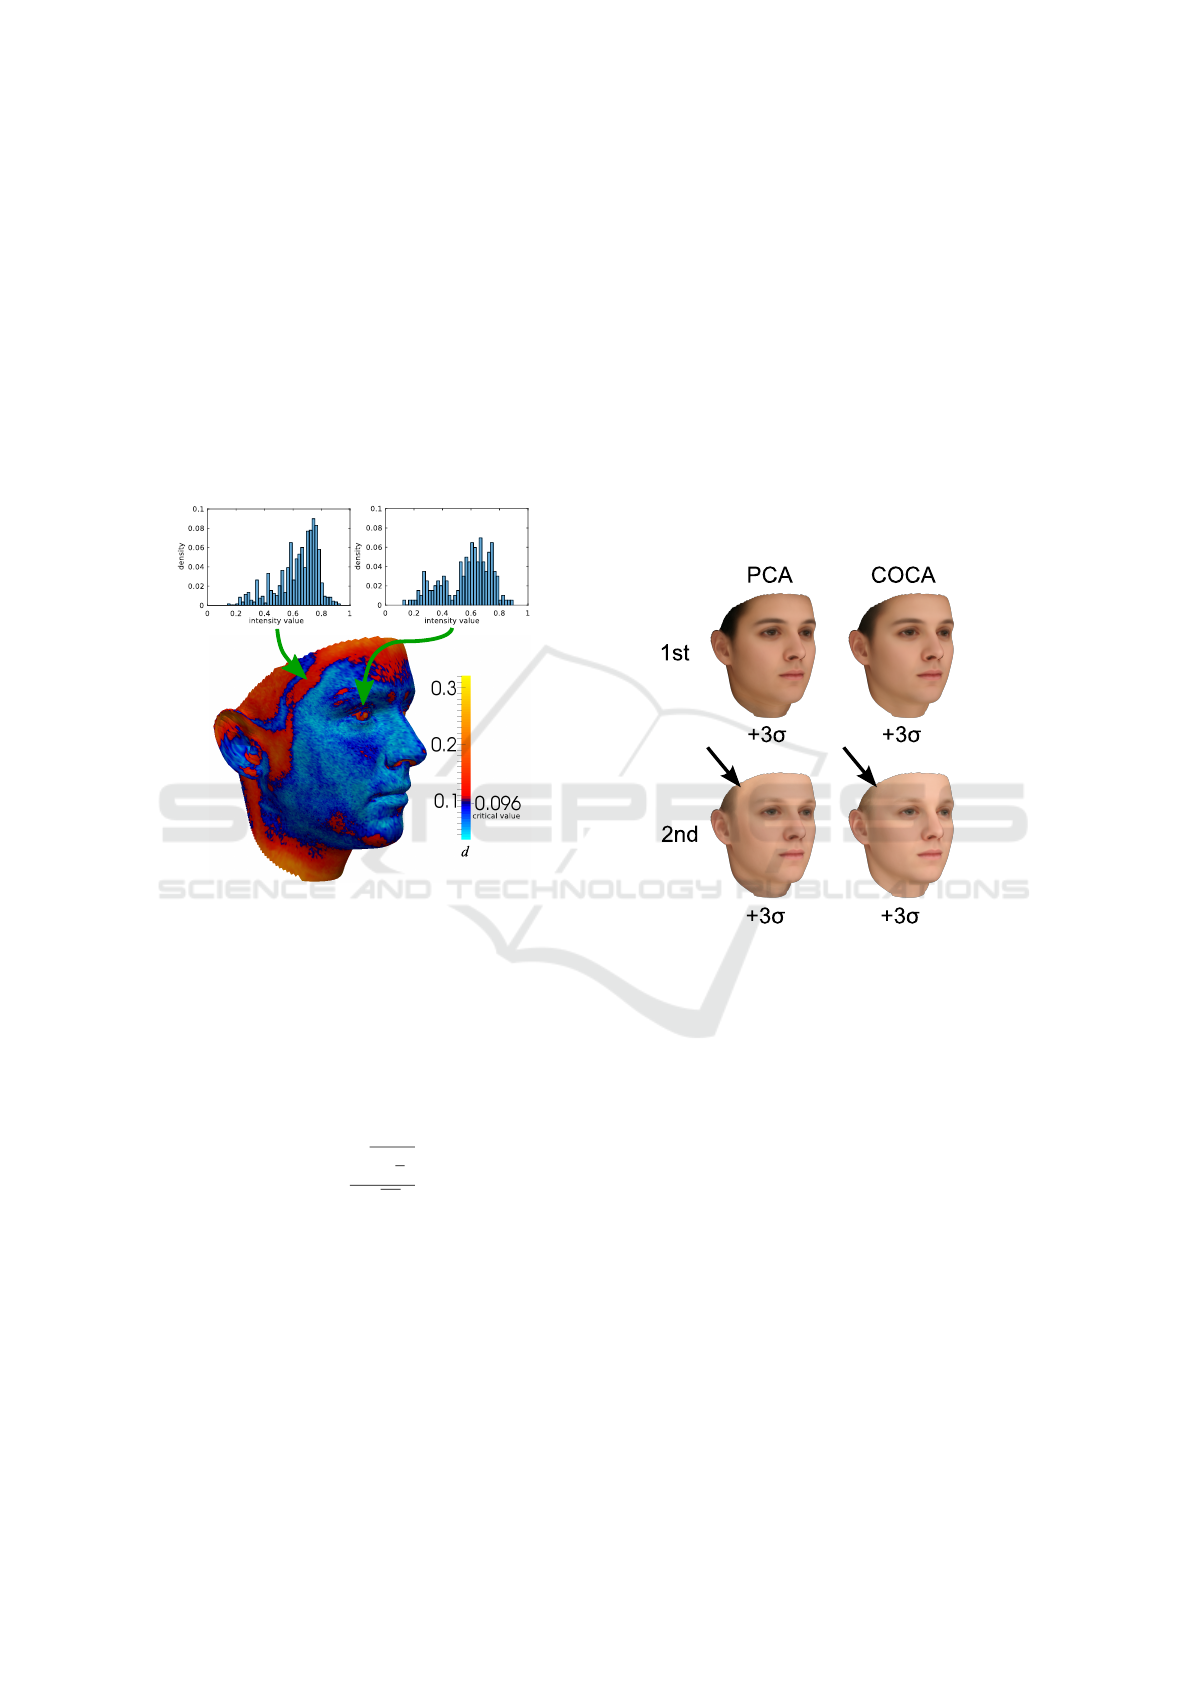
Figure 2: The result of the Kolmogorov-Smirnov Test to
compare the empirical marginal distribution of color values
from our 200 face scans with a Gaussian-reference proba-
bility distribution. We plot the highest value of the three
color channels per pixel, because the values for the individ-
ual color channels are very similar. We show two exemplary
marginal distributions in the eye and temple region. They
are not only non-Gaussian but also not similar.
We assume a significance level of 1 −α = 0.05.
The critical value d
α
is approximated using the fol-
lowing formula (Lothar Sachs, 2006):
d
α
=
q
ln(
2
α
)
√
2n
(10)
With n = 200 training samples we get a critical
value of 0.096. Non-Gaussian marginal distributions
of color intensities are present in the region of the
eyebrows, eyes, chin and hair, where multi-modal ap-
pearance is present. In total for 49% of the pixels
over all color channels, the null hypothesis has to be
rejected. In simple monotonic regions, like the cheek,
the marginal distributions are close to a Gaussian dis-
tribution. In more structured regions like the eye, eye-
brow or the temple region, the appearance is highly
non-Gaussian. This leads to strong artifacts when
modeling facial color appearance using PCA (see Fig-
ure 3 and Figure 4). Since those more structured re-
gions are fundamental components of a face, it is im-
portant to model them properly.
3.2 Appearance Modeling
We evaluate our facial appearance model by its capa-
bility to synthesize new instances. We measured this
capability by comparing the major eigenmodes, ran-
dom model instances, the sample marginal distribu-
tions and the specificity of both models. The speci-
ficity is measured qualitatively by visual examples
and quantitatively by a model metric.
Figure 3: PCA and COCA are compared by visualizing
the first two eigenvectors with 3 standard deviations on the
mean. The components look very similar, except that the
PCA artifacts on the temple (arrows) in the second eigen-
vector do not appear using COCA.
3.2.1 Model Parameters
The first few principal components store the strongest
dependencies. We visualize the first two components
by setting their value h
i
to σ = 3 standard deviations
and show the result in Figure 3. The first parameters
of PCA and COCA appear very similar in the vari-
ation of the data they model. The second principal
component of PCA causes artifacts in the temple re-
gion. These artifacts are caused by the linearity of
PCA. COCA is a nonlinear method and therefore, the
artifacts are not present.
GRAPP 2016 - International Conference on Computer Graphics Theory and Applications
54
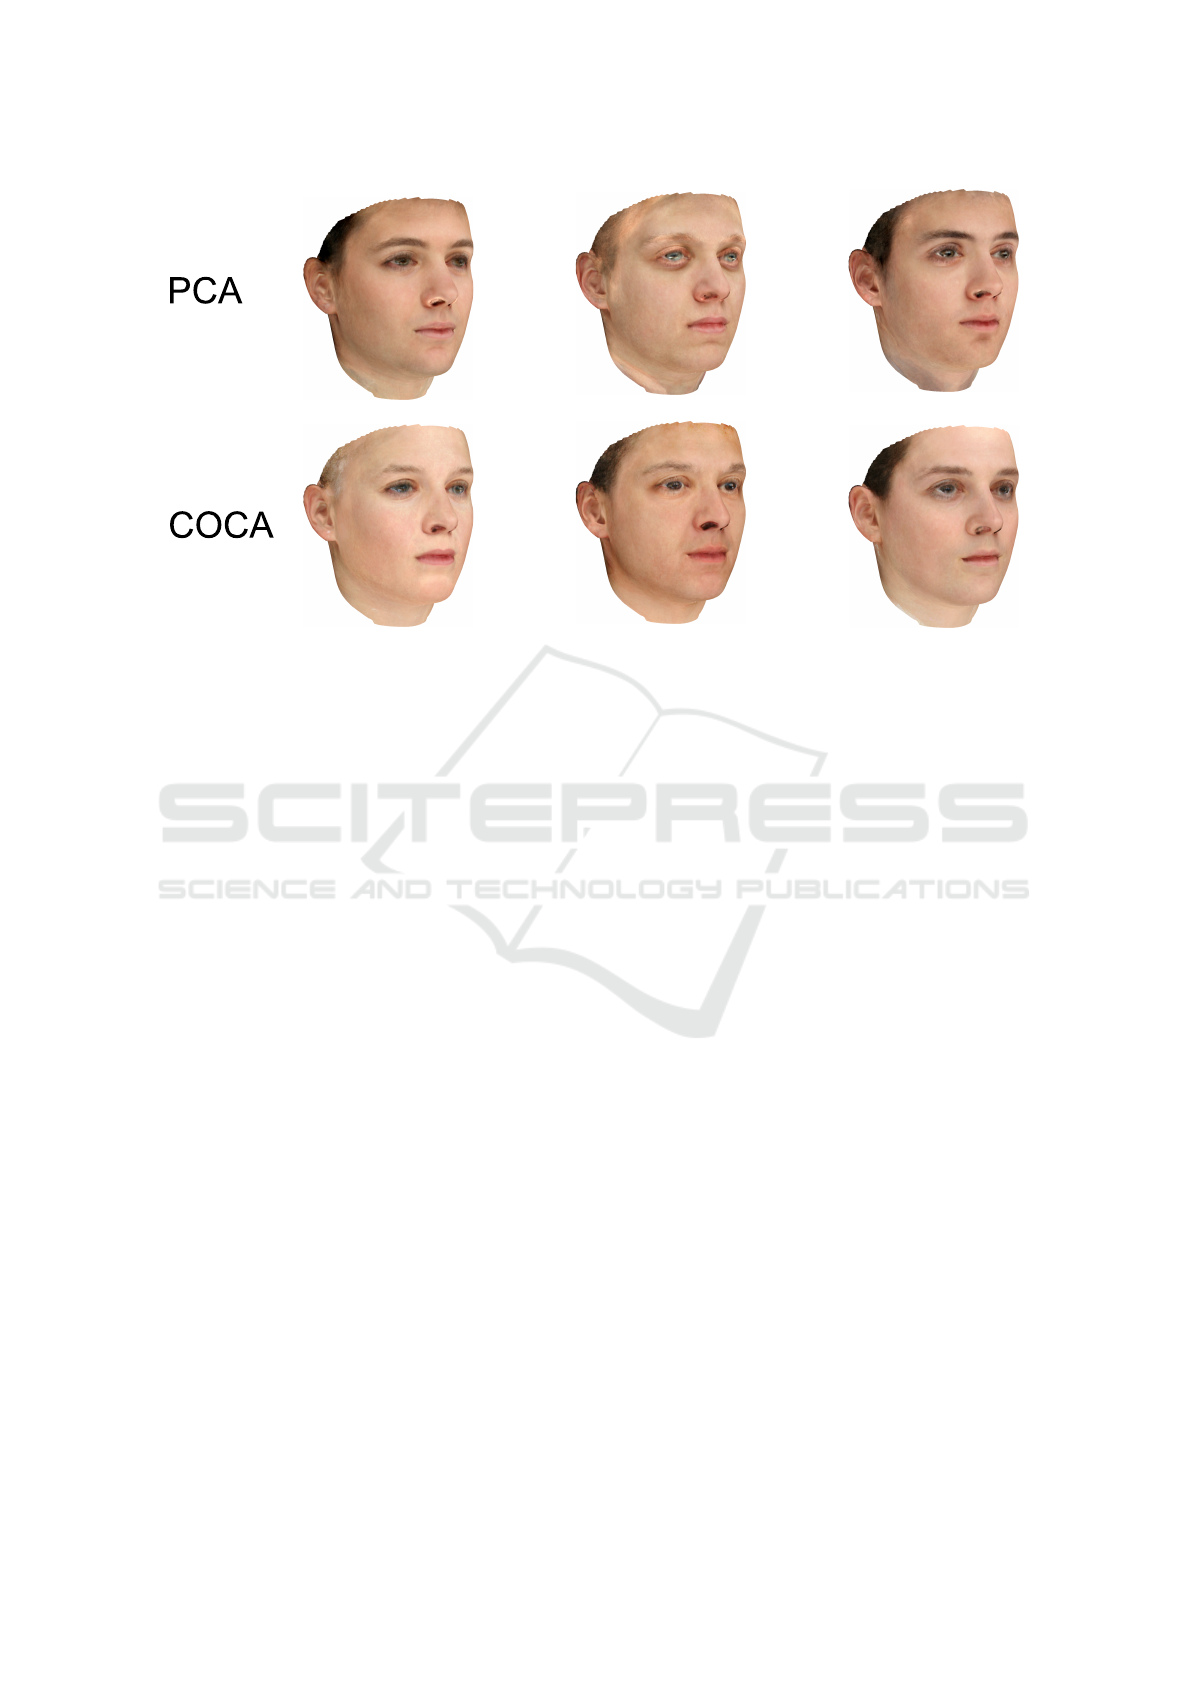
Figure 4: The first and second row show random samples projected by PCA and COCA respectively. Using PCA, we can
observe strong artifacts in the regions where the marginal distribution is not Gaussian (see Figure 2). The improvement of
COCA can be observed in the temple region, on the eyebrows, around the nostrils, the eyelids and at the border of the pupil.
We chose representative samples for both methods.
3.2.2 Random Samples
The ability to generate new instances is a key fea-
ture for generative models. A model which can pro-
duce more realistic samples is desirable for various
applications. For example, the Visio-lization method
to generate high resolution appearances is based on
a prototype generated with PCA (Mohammed et al.,
2009).
Another field of application for the generative
part of models are Analysis-by-Synthesis methods
based on Active Appearance Models (AAM) or 3D
Morphable Models (3DMM). They can profit from a
stronger prior which is more specific to faces and re-
duces the search space (Sch
¨
onborn et al., 2013).
Generating a random parameter vector leads to a
random face from our PCA or COCA model. We
sample h according to Equation (5) independently
for all 199 parameters and project them via PCA
or COCA on the color space following Equation 6.
Random samples using COCA contain fewer artifacts
and, therefore, appear much more natural (see Fig-
ure 4). These artifacts are caused by the linearity of
PCA. For non-Gaussian-distributed marginals, PCA
does not only interpolate within the trained color dis-
tribution but also extrapolates to color intensities not
supported by the training data.
The most obvious problem is the limited domain
of the color channels: using PCA, color channels have
to be clamped. The linearity constraint of PCA leads
to much brighter or darker color appearance than
those present in the training data in regions which are
not Gaussian-distributed. In the next experiment, we
show that the higher specificity is not only a qualita-
tive result but can also be measured by a model met-
ric.
Few samples od COCA contain artifacts arising
from outliers in the training data which appear at the
borders of the empirical cdfs. Those artifacts can be
removed by slightly cropping the marginal distribu-
tions (removing the outliers) or by applying COCA in
the HSV color space.
3.3 Appearance Marginal Distribution
We analyze the marginal distributions of our ran-
dom faces at a single point at the border between the
pupil and the sclera of the eye. In this region the
Kolmogorov-Smirnov Test rejected the null hypoth-
esis. We analyze the empirical intensity distribution
of a single color channel at this point (Figure 5a).
The sample marginal distributions drawn from 1000
random instances generated by PCA and COCA are
shown in Figure 5b and Figure 5c respectively. Whilst
COCA is able to generate samples distributed similar
to our input data, PCA is approximating a Gaussian
distribution, which is inaccurate in a lot of facial re-
gions.
Copula Eigenfaces - Semiparametric Principal Component Analysis for Facial Appearance Modeling
55
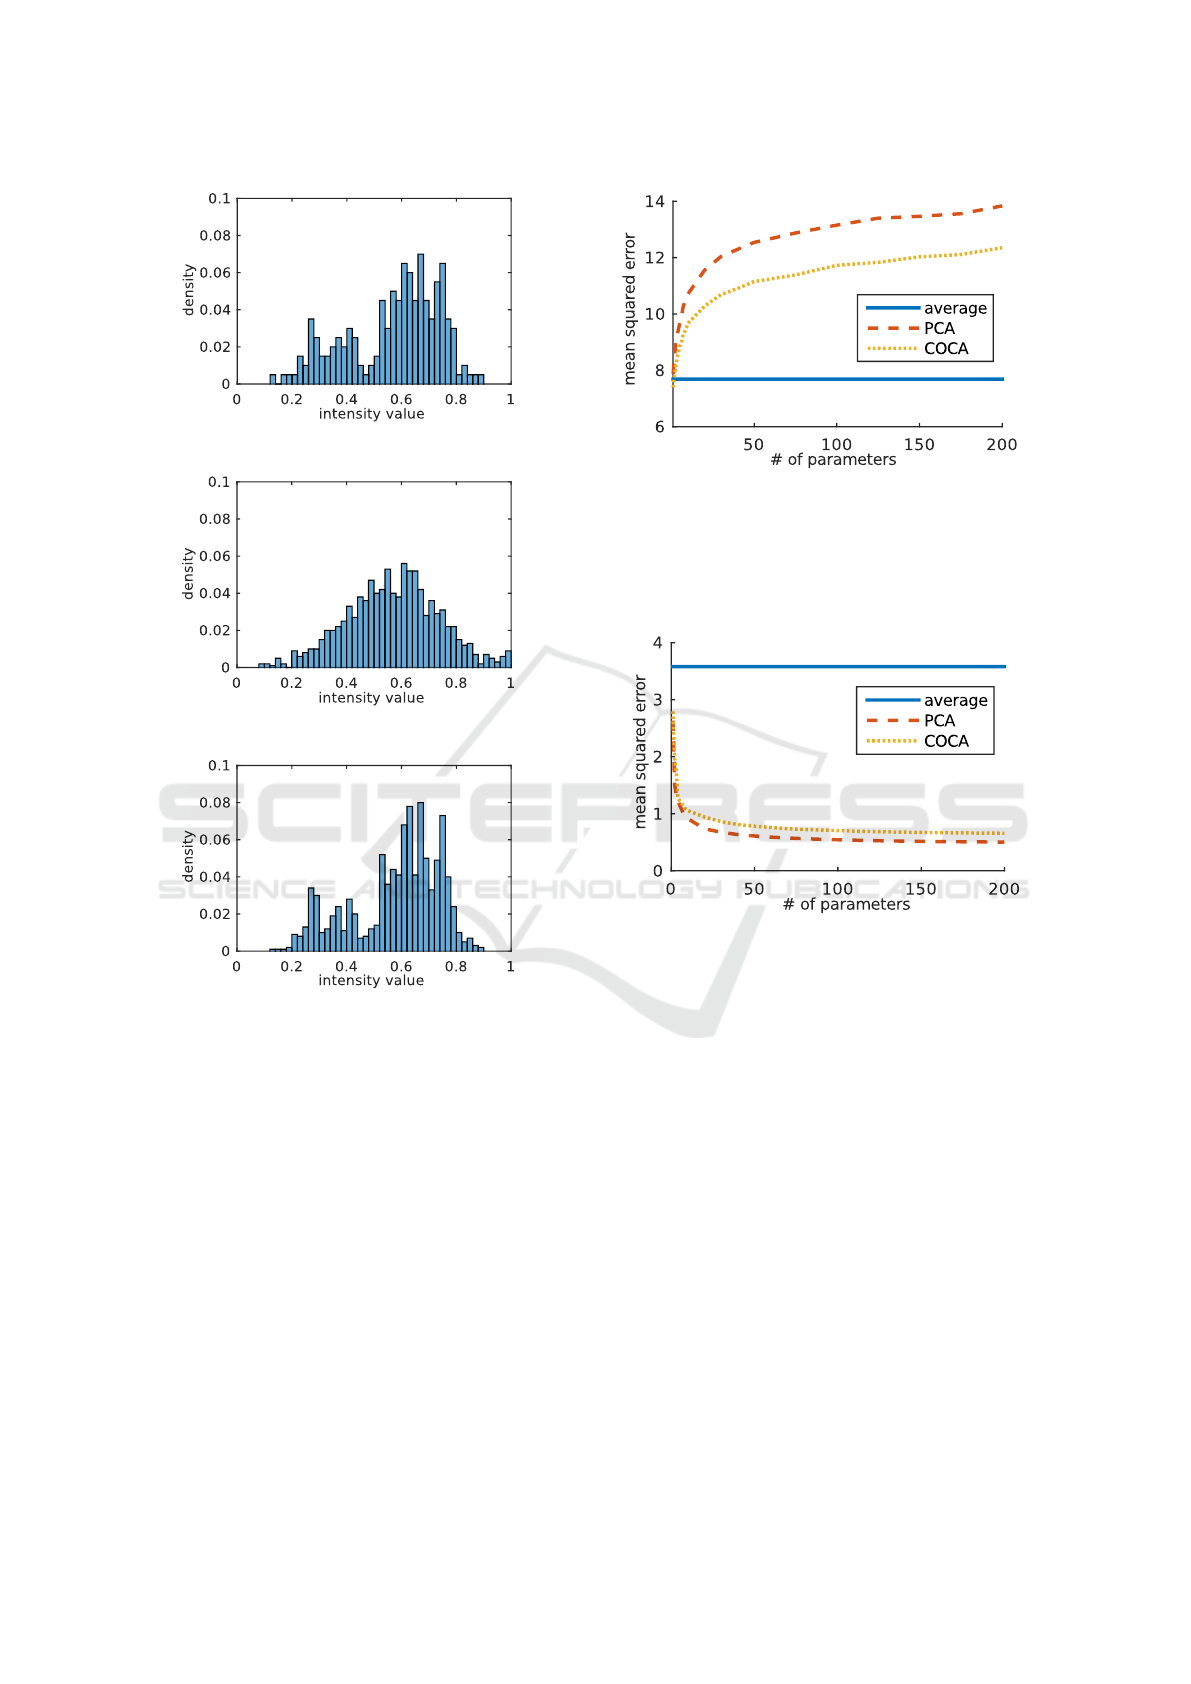
(a) Empirical marginal distribution
(b) PCA sample marginal distribution
(c) COCA sample marginal distribution
Figure 5: The marginal distribution of the red color intensity
of a single point in the eye region. (a) shows the distribution
observed in the training data, (b) shows the distribution of
samples drawn from a PCA model and (c) from a COCA
model.
3.3.1 Specificity and Generalization
To measure the quality of the PCA and COCA mod-
els, we use model metrics motivated by the shape
modeling community (Styner et al., 2003). The
first metric is specificity: Instances generated by the
model should be similar to instances in the training
set. Therefore, we draw 1000 random samples from
our model and compare each one to its nearest neigh-
bor in the training data. We measure the distance us-
ing the mean absolute error over all pixels and color
channels in the RGB-color space. The COCA model
Figure 6: The specificity shows how close generated in-
stances are to instances in the training data. The average
distance of 1000 random samples to the training set (mean
squared error per pixel and color channel) is shown. A
model is more specific if the distance of the generated sam-
ples to the training set is smaller. We observe that COCA is
more specific to faces (lower is better).
Figure 7: The generalization ability shows how exactly un-
seen instances can be represented by a model. The lower
the error, the better a model generalizes. As a baseline, we
present the generalization ability of the average face. We
observe that PCA generalizes slightly better (lower is bet-
ter).
is more specific to facial appearance (see Figure 6).
This corresponds to our observation of a more realis-
tic facial appearance (Figure 4).
Specificity should always be used in combination
with the generalization model metric (Styner et al.,
2003). The generalization measures how exactly the
model can represent unseen instances. We measure
the generalization ability of both models using a test
set and use the same distance measure as for speci-
ficity. The test data consists of 25 additional face
scans not contained in the training data. We observe
that both models generalize well to unseen data. PCA
generalizes slightly better, see Figure 7.
The third model metric is compactness - the abil-
ity to use a minimal set of parameters (Styner et al.,
2003). The compactness can be measured directly by
GRAPP 2016 - International Conference on Computer Graphics Theory and Applications
56
+2σ-2σ
1st
2nd
3rd
Figure 8: We learned a common shape and appearance
model using COCA. We visualize the first eigenvectors
with 2 standard deviations, which show the strongest de-
pendencies in our training data. Whilst the first parameter
is strongly dominated by appearance the later parameters
are targeting shape and appearance. Since the model is built
from 100 females and 100 males, the first components are
strongly connected to sex.
the number of used parameters. In our experiments,
the number of parameters is always the same for both
models.
There is always a tradeoff between specificity and
generalization. Whilst PCA performs slightly better
in generalization, COCA performs better in terms of
specificity. The better generalization ability of PCA
comes at the price of a lower specificity and clearly
visible artifacts.
3.3.2 Combined Shape and Color Model
Color appearance and shape are modeled indepen-
dently in AAMs and 3DMMs. Recently, it was
demonstrated that facial shape and appearance are
correlated (Schumacher and Blanz, 2015) and those
correlations were investigated using Canonical Cor-
relation Analysis on separate shape and appearance
PCA models.
The main reason to build separate models is a
practical one - shape and color values are not in the
same range. Some approaches accommodate this is-
sue by normalization (Edwards et al., 1998). How-
ever, this approach is highly sensitive to outliers.
Since Copula Component Analysis is scale invariant,
we can directly apply it to the unscaled data.
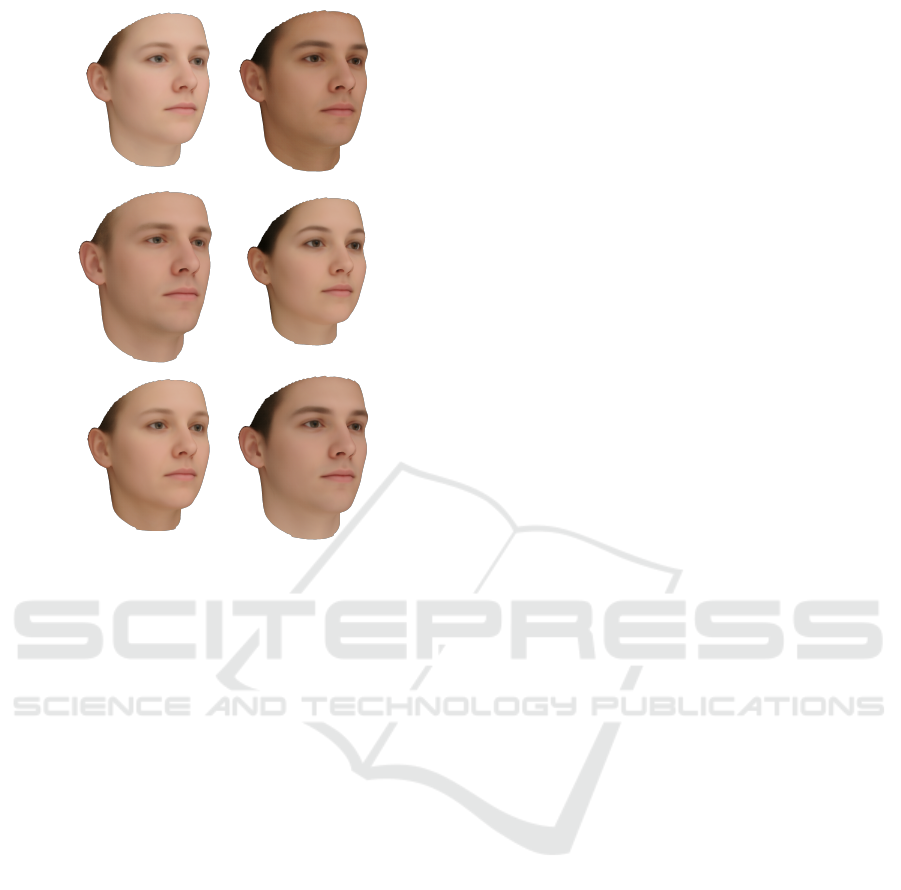
We learned a COCA model combining the color
and shape information (see Figure 8 and Figure 9).
Shape and texture vectors are combined by simply
concatenating them. By integrating this additional de-
pendency information, the model becomes more spe-
cific (Edwards et al., 1998).
As a future extension, COCA allows us to also
integrate attributes like age, weight and size or even
social attributes like thrustworthiness or social com-
petence directly into the model.
4 CONCLUSIONS
We showed that the marginal distribution of facial
color is not Gaussian-distributed for large parts of
the face and that PCA is not able to model facial ap-
pearance properly. In a statistical appearance model,
this leads to unnatural artifacts which are easily de-
tected by human perception. To avoid such artifacts,
we propose to use PCA in a semiparametric Gaus-
sian copula model (COCA) which allows to model
the marginal color distribution separately from the
dependency structure. In this model, the parametric
Gaussian copula describes the dependency pattern in
the data and the nonparametric marginals relax the
restrictive Gaussian requirement of the data distribu-
tion.
The separation of marginals and dependency pat-
tern enhances the model flexibility. We showed qual-
itatively that COCA models facial appearance better
than PCA. This finding is also supported by a quanti-
tative evaluation using specificity as a model metric.
Moreover, the COCA model enables to add fur-
ther data to the model: Age, weight, size, and other
data like social attributes living on different scales can
be incorporated in the model in an unified way. To
demonstrate this feature, we showed that the inclusion
of shape also increased the specificity of the model.
The computer graphics and vision community is
heavily modeling and working with color intensities.
We believe that these intensities are most often not
Gaussian-distributed and, therefore, our findings can
be transferred to a lot of applications.
Finally, we again want to encourage the reader to
replace PCA with a COCA model, since the addi-
tional model flexibility comes with almost no imple-
mentation effort.
Copula Eigenfaces - Semiparametric Principal Component Analysis for Facial Appearance Modeling
57
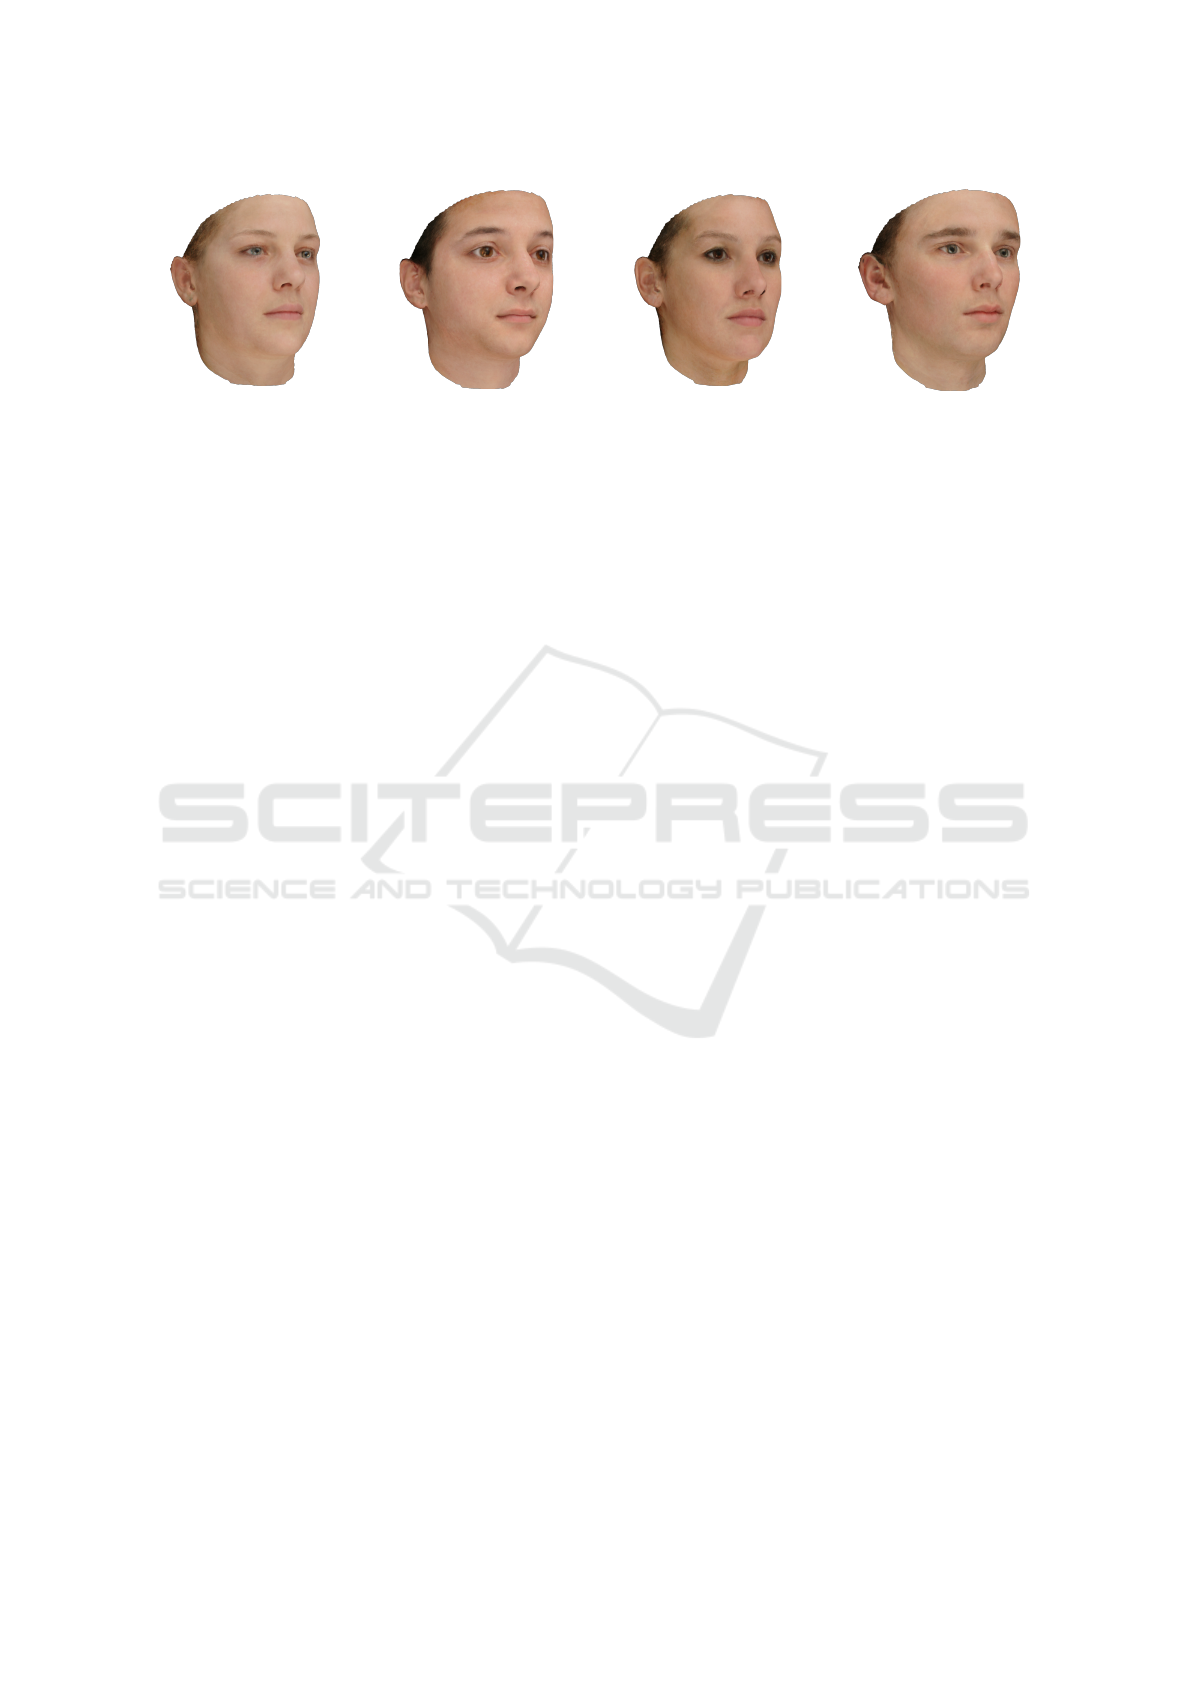
Figure 9: Random samples projected by a common shape and appearance model using COCA.
ACKNOWLEDGEMENTS
We would like to thank Clemens Blumer, Antonia
Bertschinger and Anna Engler for their valuable in-
puts and proofreading.
REFERENCES
Blanz, V. and Vetter, T. (1999). A morphable model for
the synthesis of 3d faces. In Proceedings of the 26th
annual conference on Computer graphics and interac-
tive techniques, pages 187–194. ACM Press/Addison-
Wesley Publishing Co.
Cootes, T. F., Edwards, G. J., and Taylor, C. J. (1998). Ac-
tive appearance models. In Computer VisionECCV98,
pages 484–498. Springer.
Edwards, G. J., Lanitis, A., Taylor, C. J., and Cootes, T. F.
(1998). Statistical models of face imagesimproving
specificity. Image and Vision Computing, 16(3):203–
211.
Genest, C., Ghoudi, K., and Rivest, L.-P. (1995). A
semiparametric estimation procedure of dependence
parameters in multivariate families of distributions.
Biometrika, 82(3):543–552.
Han, F. and Liu, H. (2012). Semiparametric principal com-
ponent analysis. In Advances in Neural Information
Processing Systems, pages 171–179.
Joe, H. (1997). Multivariate models and multivariate de-
pendence concepts. CRC Press.
Jolliffe, I. (2002). Principal component analysis. Wiley
Online Library.
Lothar Sachs, J. H. (2006). Angewandte Statistik. Springer
Berlin Heidelberg, 7 edition.
Massey Jr, F. J. (1951). The kolmogorov-smirnov test for
goodness of fit. Journal of the American statistical
Association, 46(253):68–78.
Mohammed, U., Prince, S. J., and Kautz, J. (2009). Visio-
lization: generating novel facial images. ACM Trans-
actions on Graphics (TOG), 28(3):57.
Nelsen, R. B. (2013). An introduction to copulas, volume
139. Springer Science & Business Media.
Paysan, P., Knothe, R., Amberg, B., Romdhani, S., and Vet-
ter, T. (2009). A 3d face model for pose and illumi-
nation invariant face recognition. In Advanced Video
and Signal Based Surveillance, 2009. AVSS’09. Sixth
IEEE International Conference On, pages 296–301.
IEEE.
Rasmussen, C. E. (1999). The infinite gaussian mixture
model. In NIPS, volume 12, pages 554–560.
Sch
¨
onborn, S., Forster, A., Egger, B., and Vetter, T. (2013).
A monte carlo strategy to integrate detection and
model-based face analysis. In Pattern Recognition,
pages 101–110. Springer.
Schumacher, M. and Blanz, V. (2015). Exploration of the
correlations of attributes and features in faces. In
Automatic Face and Gesture Recognition (FG), 2015
11th IEEE International Conference and Workshops
on, pages 1–8. IEEE.
Sirovich, L. and Kirby, M. (1987). Low-dimensional pro-
cedure for the characterization of human faces. JOSA
A, 4(3):519–524.
Styner, M. A., Rajamani, K. T., Nolte, L.-P., Zsemlye, G.,
Sz
´
ekely, G., Taylor, C. J., and Davies, R. H. (2003).
Evaluation of 3d correspondence methods for model
building. In Information processing in medical imag-
ing, pages 63–75. Springer.
Tsukahara, H. (2005). Semiparametric estimation in copula
models. Canadian Journal of Statistics, 33(3):357–
375.
Turk, M., Pentland, A. P., et al. (1991). Face recogni-
tion using eigenfaces. In Computer Vision and Pat-
tern Recognition, 1991. Proceedings CVPR’91., IEEE
Computer Society Conference on, pages 586–591.
IEEE.
Walker, M. and Vetter, T. (2009). Portraits made to measure:
Manipulating social judgments about individuals with
a statistical face model. Journal of Vision, 9(11):12.
GRAPP 2016 - International Conference on Computer Graphics Theory and Applications
58
