
Search-based Decision Ordering to Facilitate Product Line
Engineering of Cyber-Physical System
Tao Yue
1,2
, Shaukat Ali
1
, Hong Lu
1
and Kunming Nie
3
1
Simula Research Laboratory, Oslo, Norway
2
Department of Informatics, University of Oslo, Oslo, Norway
3
Launch Technology Research Academy of China Aerospace Science and Industry Corporation, Beijing, China
Keywords: Product Line Engineering, Cyber Physical System, Decision Ordering, Search Algorithms.
Abstract: Industrial Cyber Physical Systems (CPSs) are naturally complex. Manual configuration of CPS product
lines is error-prone and inefficient, which warrants the need for automated support of product configuration
activities such as decision inference and decision ordering. A fully automated solution is often impossible
for CPSs since some decisions must be made manually by configuration engineers and thus requiring an
interactive and step-by-step configuration solution. Having an interactive solution with tool support in mind,
we propose a search-based solution (named as Zen-DO) to support optimal ordering of configuration steps.
The optimization objective has three parts: 1) minimizing overall manual configuration steps, 2) configuring
most constraining decisions first, and 3) satisfying ordering dependencies among variabilities. We
formulated our optimization objective as a fitness function and investigated it along with four search
algorithms: Alternating Variable Method (AVM), (1+1) Evolutionary Algorithm (EA), Genetic Algorithm,
and Random Search (a comparison baseline). Their performance is evaluated in terms of finding an optimal
solution for two real-world case studies of varying complexity and results show that AVM and (1+1) EA
significantly outperformed the others.
1 INTRODUCTION
Cyber-Physical Systems (CPSs) are large-scale
systems of systems communicating with each other
based on digital cyber technologies, integrating
software and physical components, and interacting
with environment and human actors. CPSs are often
seen in various domains including aerospace, energy
and maritime, and healthcare. Product Line
Engineering (PLE) is gaining increasing attention of
researchers and practitioners because of its
capability to deal with the increasing complexity and
variation in software/system product lines (Frakes
and Kang, 2005). Adopting PLE has shown to be
effective for improving the quality of products and
the productivity of developing the products. It has
been reported in (Ali et al., 2012) that PLE can
effectively speed up time-to-market in many
organizations such as Boeing, Lucent, and Nokia.
Due to the inherent complexity of CPSs,
hundreds and thousands of reusable components
(e.g., electronic components, software components
or network component) are typically and integrated
and configured. Therefore automated support based
on concise abstractions of reusable artifacts becomes
crucial to the configuration process, where
abstraction plays a central role for software reuse
while automation can facilitate effective selection
and customization of reusable components. Such an
automated configuration solution heavily relies on a
large number of constraints, which can be formally
specified using e.g., the Object Constraint Language
(OCL) (OMG) to facilitate, for instance, automated
decision inference based on dependencies of
Variation Points (VPs) (i.e., configurable
parameters) and the optimization of configuration
steps. Our previous work (Nie et al., 2013b)
classifies different types of constraints that should be
explicitly captured and specified on product line or
product models to enable automation in the context
of CPS PLE.
We have proposed an interactive configuration
framework, named as Zen-Configurator (Kunming
Nie, 2013, Hong et al., 2014, Hong et al., 2015, Nie
et al., 2013), with the aim to implement at least three
functionalities: Decision Inference, Decision
Yue, T., Ali, S., Lu, H. and Nie, K.
Search-based Decision Ordering to Facilitate Product Line Engineering of Cyber-Physical System.
DOI: 10.5220/0005717006910703
In Proceedings of the 4th International Conference on Model-Driven Engineering and Software Development (MODELSWARD 2016), pages 691-703
ISBN: 978-989-758-168-7
Copyright
c
2016 by SCITEPRESS – Science and Technology Publications, Lda. All rights reserved
691

Ordering and Conformance Checking. A user
interface has been developed; the decision inference
and conformance checking functionalities have been
implemented (Hong et al., 2014). The decision
ordering functionality of Zen-Configurator should
take the product line architecture model (including
constraints) as input, order configuration decisions
(VPs) in an optimized way such that overall manual
configuration steps are minimized, which is the
focus of this paper.
In the literature, different methods have been
proposed to address this problem such as applying
SAT Solvers for ordering decisions (Nohrer and
Egyed, 2011), relying on Constraint Satisfactory
Problems (CPS) solvers to derive valid feature
selection sequences (White et al., 2009), and
prioritizing features based on their selectivity (Chen
and Erwig, 2011). All these works handle relatively
simple dependencies among variabilities, i.e.,
decision or feature selection. However, based on our
previous experience of stusdying three industrial
CPS product line families (Nie et al., 2013b),
configuring CPSs require handling complex
constraints, thus indicating the insufficiency of these
work. Some configuration tools (e.g., Pure::Variants
(Beuche, 2008), Dopler (Dhungana et al., 2011),
Covamof (Sinnema et al., 2004), SPLOT (Mendonca
et al., 2009), FMP (Czarnecki et al., 2005), and
Questionnaire (La Rosa et al., 2009)) implemented
the decision ordering functionality in various ways:
based on user predefined configuration sequences,
deriving configuration sequences from dependencies
of variabilities, and simply applying depth first
strategy to traverse feature models. None of these
tools implemented the objective of minimizing
manual configuration steps—the main objective of
this work. As reported in (El-Sharkawy and Schmid,
2012), the Dopler tool suite (Dhungana et al., 2011)
is the only tool that implements the heuristic of
configuring most constraining decisions first to
reduce overall configuration effort, which aligns
with part of our objective.
In this paper, we propose a search-based solution
(named as Zen-DO) to support optimal ordering of
configuration decisions of CPS product lines. We
propose and assess a fitness function for minimizing
manual steps required to configure a product, while
fulfilling configuration ordering dependencies of
VPs to the maximum extent and starting from most
constraining configuration decisions first. We
evaluate the fitness function together with four
search algorithms: Alternating Variable Method
(AVM), Genetic Algorithms (GA), (1+1)
Evolutionary Algorithm (EA) and Random Search
(RS). RS was used as the baseline to evaluate the
performance of the other three algorithms. Two real-
world case studies and 130 artificial problems have
been used to evaluate the selected search algorithms
and the fitness function. Results show that AVM and
(1+1) EA significantly outperformed the other two
algorithms for both of the real-world case studies
and most of the artificial problems.
The rest of the paper is organized as follows. In
Section 2, we provide an overview of Zen-
Configurator and Zen-DO, and relevant background
information. Section 3 presents the formalization of
the optimization problem and the fitness function.
The empirical study and the controlled experiment
are discussed in detail in Section 5 and Section 6,
respectively. We present the overall discussion in
Section 6. We addresses the threats to validity of the
empirical study in Section 7. Section 8 discusses the
related work. We conclude the paper in Section 9.
2 OVERVIEW
In this section, we first introduce Zen-Configurator
and then the overview of Zen-DO.
2.1 Zen-Configurator
As previously discussed, in the context of CPS PLE,
there are a large number of VPs that have to be
configured correctly by conforming to a large
number of constraints. Product configuration is
therefore an error-prone and time-consuming
activity when it is totally manual. Hence, it is
important to have an interactive and semi-automated
configuration solution for CPS PLE.
PLE is composed of two distinct phases: Domain
Engineering and Application Engineering. In
domain engineering, PLA modelling and constraint
specification approaches are used by a Domain
Expert to capture commonalities and variabilities in
the system architecture and design and constraints
relevant to the configuration of a valid product. In
different contexts, different modelling and
specification approaches can be used. As part of the
Zen-Configurator solution, we rely on SimPL
(Behjati et al., 2013), which is a modeling
methodology with a UML profile for specifying
commonalities and variabilities of a product line of
integrated control systems at the architecture and
design level. SimPL was developed to deal with four
types of variabilities: Cardinality, Attribute,
Topology and Type. As shown in Figure 1, a subsea
production system that may have more than one
IndTrackMODELSWARD 2016 - MODELSWARD - Industrial Track
692
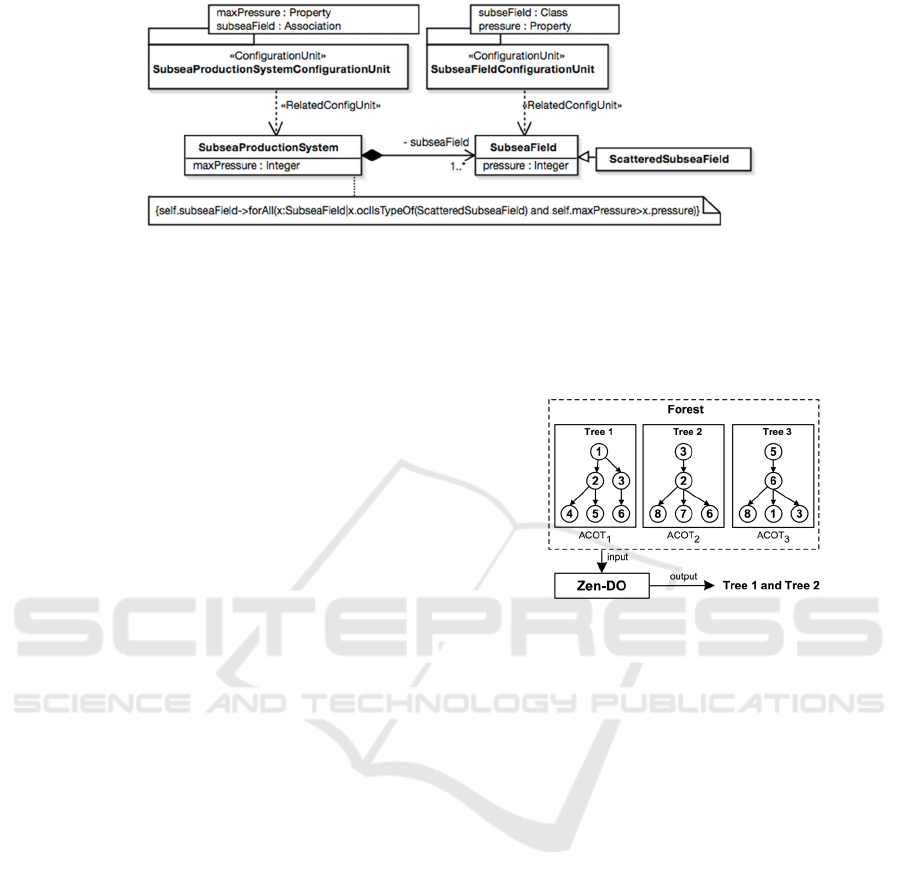
Figure 1: An Example of SimPL Model (Excerpted From (Behjati et al., 2013)).
subsea fields with various types, such as scattered
subsea fields. Two template packages are
stereotyped with <<ConfigurationUnit>> and
associated to classes SubseaProductionSystem and
SubseaField to specify the VPs of each of these two
classes. As an example, we specify one OCL
constraint for this model, that is, all the subsea fields
are scattered subsea fields and the pressure of all
subsea fields is less than the max pressure of a
subsea production system.
In the application-engineering phase, Zen-
Configurator has three key functionalities (Decision
Inference, Decision Ordering and Conformance
Checking), to assist configuration engineers to
configure a product. PLA models and constraints of
the product line are considered as product line assets
stored in a repository, which are used as the input to
facilitate the automation of configuring products.
Configured products are therefore stored in the
Product Artifacts Repository. We have previously
implemented an automated and incremental
conformance checking approach, named Zen-CC, to
ensure that the manual configuration of each VP
conforms to a set of pre-defined conformance rules
specified in OCL (Hong et al., 2014).
Zen-Configurator relies on a set of algorithms
that implement a set of heuristics (e.g., determining
optimal decision orders), which are identified as key
elements to optimize the effectiveness and efficiency
of the configuration solution. These algorithms need
to access the PLA models and constraints at runtime
and therefore, it is crucial to have a lightweight
internal representation capturing sufficient
information for supporting efficient configuration. In
Zen-Configurator, we use Trees (e.g., with nodes
representing VPs and edges denoting VP
dependencies) for this purpose. Automated
transformation from the PLA models and constraints
(SimPL and OCL respectively) to Trees is needed in
Zen-Configurator. Zen-Configurator also needs to
employ search algorithms for optimal decision
ordering, which require encoding of the problem, a
fitness function to assess a solution, and parameter
settings specific to each search algorithm. The focus
of the paper is to propose such a search-based
decision ordering solution.
Figure 2: Illustrative Example of Zen-DO.
2.2 Zen-DO
In a typical PLE practice, a product line specification
captures commonalties and variabilities of a product
line. For example, feature models (Czarnecki et al.,
2005) are commonly used for this purpose. VP is a
configurable element of a product line specification
and it defines the place of the variability. A variant is
one of the possible choices to be bound for a VP.
VPs can be specified in different ways, including
value range, constraints, or enumeration literals,
depending on applications. When resolving a VP, a
variant is bound to the respective VP. A Constraint,
in our context, is an element of system specification
constraining one or more other elements to support
automated product configuration.
Zen-Configurator is an interactive configuration
tool that interacts with users, in our context
Configuration Engineers, to configure a product line
family and derive a set of family members: products.
Configuration engineers in this configuration
environment are considered as part of the
optimization as they receive feedback (on which
decisions to make first) from the tool and
configuration engineers’ manual decisions trigger
the configuration tool to dynamically find other
Search-based Decision Ordering to Facilitate Product Line Engineering of Cyber-Physical System
693

optimized configuration orders based on the
remaining VPs to be configured in the whole
configuration space (all VPs should be configured
and all constraints should be satisfied to various
extents). This kind of configuration design is called
“User-in-the-loop” (Sayyad et al., 2013).
VPs and constraints are taken as input by the tool.
Note that as we investigated in our previous work
(Nie et al., 2013b), decision ordering in such a user-
in-the-loop interactive configuration environment
relies on two types of constraints: variability
dependencies and ordering constraints. These
constraints can be either user defined, derived from
system specifications, or enforced by a particular
system development process. These constraints,
together with the product line architecture model,
contribute to the formation of the internal
representation: Forest consisting of a set of Trees,
which are necessary to formulate our optimization
problem, thereby proposing the fitness function.
Suppose we have obtained such a set of
constraints, applying each constraint will form an
ordering tree with nodes representing VPs to be
configured and edges describing which VP should
be configured before or after which other VP(s). By
applying all the identified constraints, a forest is
formed, containing a set of trees (each of which
corresponds to a constraint constraining the
configuration sequence of a set of VPs) and having
each yet-to-be configured VP covered in the forest.
In the forest, all the yet-to-be configured VPs must
be configured to obtain a product.
We then apply search algorithms to derive a set
of trees based on three heuristics: 1) covering yet-to-
be configured VPs as many as possible, 2)
minimizing the number of Abstract Configuration
Ordering Trees (ACOTs) to be contained in a
solution, and 3) minimizing the manual steps
required to configure a product. For example, as
shown in
Figure 2, Tree 1 and Tree 2 were selected
as the optimal solution given the forest, because
these two trees cover all the VPs (1-8) and form a
solution with the minimum number of trees (i.e., 2).
An optimal solution (Tree 1 and Tree 2) will be
provided to configuration engineers and they will
select any of the root nodes of these trees
(representing VP1 and VP3) to configure them
manually. The consequence of this manual
configuration is that the remaining VPs to configure
will be updated. Therefore, the forest will be
updated and the optimization process will start to
find another solution for the new updated forest.
It is important to notice that our optimization
solution is independent of any product line
specification or modeling methodology as the
optimization starts from the forest, which captures
all the required information for the optimization.
This gives us the freedom to make this work
applicable to different contexts such as combing
with feature models or architecture and design based
variability modeling methodologies. However, as an
integrated part of Zen-Configurator, a
transformation from SimPL to the internal
representation (Trees) has been implemented.
3 PROBLEM REPRESENTATION
AND FITNESS FUNCTION
3.1 Definitions
A forest F is a set of Configuration Ordering Trees
and is defined as F= {COT
1
, COT
2
, …, COT
ncot
},
where ncot is the total number of configuration
ordering trees.
VP = {vp
1
, vp
2
, …, vp
nvp
} is a set of VPs, where
nvp is the total number of VPs to be configured.
Each vp
i
in VP has an attribute Configured of type
Boolean.
Configuration Ordering Tree (COT) is a tree of
in the F forest defined above. COT = {{Node},
{Edge}}. Note that it is also possible that a COT only
constrains one node. Each node represents a VP
from VP. Each edge represents an ordering
dependency of two VPs. Edge = {e
1
, e
2
, .., e
ne
},
where each edge e
i
connects a pair of vp
k
and vp
j
from Node. Each edge e
i
has a set of attributes:
Manual and Infer of type Boolean, respectively
indicating whether a configuration step is manual or
can be automatically inferred. Such information can
only be obtained using heuristic rules, as it is
impossible to know in advance which step is manual
and which step can be automatically inferred based
on pre-defined constraints, as the whole process is
dynamic and interactive. For example, one simple
heuristic rule could be that VPs that are configurable
parameters with primitive types but are not involved
in any pre-defined constraint are most probably
required to be manually configured. Another
example is that for VPs with primitive types have
high chance to be automatically inferred when they
are involved in constraints with other VPs that are
already configured. Note that implementing these
heuristics to predict this property of a configuration
step is out of the scope of this paper and will be
automated in the future.
Each edge of a COT is also characterized with
IndTrackMODELSWARD 2016 - MODELSWARD - Industrial Track
694

another attribute Weight with three categories: High,
Medium and Low, each of which respectively
indicates the extent of dependency of two VPs.
There are several ways to obtain this information.
One commonly used way is to ask user’s preference
on the configuration order, which might not be
classified as Medium and Low. Some dependencies
should be classified High as configuring one VP
depends on the decision made for another VP. Such
information can be automatically obtained by
querying variability models or constraints on VPs.
Abstract Configuration Ordering Graph (ACOG)
consists of a set of nodes and edges: ACOG =
{{AbstractCOT}, {AbstractEdge}}. AbstractCOT =
{acot
1
, acot
2
, …, acot
nan
}, where each acot
i
is a COT.
AbstractEdge = {ae
1
, ae
2
, .., ae
nae
}, each ae
i
connects
a pair of acot
j
and acot
k
. Note that edges in
AbstractEdge do not have attributes.
3.2 Optimization Problem
For configuration, there is a subset of AbstractCOT:
,
,…
, based on which a set of
potential solutions
,
,…
can
be derived, where ns is the total number of solutions
and can be calculated as 2
1. For each s
i
,
there is nacot
i
belonging to S
NACOT
= {nacot
1
,
nacot
2
, …, nacot
ns
}, where 1=<nacot
i
<=n
acot
. In
addition, for each s
i
, there is vpcot
i
belonging to
S
NACOT
= {vpcot
1
, vpcot
2
, …, vpcot
ns
}, where
1=<vpcot
i
<=total number of remaining VPs. This
constraint is implemented as part of our algorithms
and we also implemented the four heuristics below.
Covering VPs that appear in the forest as many
as possible. Our aim is to find s
i
such that the
maximum number of VPs that appear in the
forest should be included in the abstract nodes of
s
i
. This is to ensure that most of the VPs in the
forest should be taken into account when making
a configuration ordering plan (a solution to
search). We define the following formula for this
aim: ∀:
,
,
. This heuristic tries to find a solution s
i
with
the maximum number of VPs.
Starting from most constraining configuration
decisions. To achieve this, a search algorithm
must guide the search towards large abstract
nodes having the largest number of VPs
connected to them. Recall that when constructing
the forest, a constraint is applied to form a tree in
the forest. Therefore, large trees (i.e., large
abstract nodes) reflect complex constraints
restricting large numbers of VPs. Hence, we
define this formula for this heuristic, which later
on is translated into a part of the fitness function:
∀:
,
, ,
meaning to find a solution s
i
with the minimum
number of abstract nodes in AbstractCOT.
Searching for a solution with the minimum
number of manual configuration steps. To
achieve this, we defined formula:
∑
1,
.∀
1,
∑
1,
.
.
Guiding the search towards the direction of
satisfying dependencies of VPs to the maximum
extent. Recall that the edges in the trees of the
forest are weighted with three categories: High
(0), Medium (1), Low (2), indicating to which
extent configuration ordering dependencies of
VPs should be satisfied while deriving a solution.
We use the following formula to formulate the
heuristic:
0,
.′′
1,
.′′
2,
.′′
∀1
1
,
0,
.′′
1,
.′′
2,
.′′
1
3.3 Fitness Function
Based on the definitions and the formulated
optimization problem, we derive the fitness function
that is used along with the six selected search
algorithms to find optimal solutions for our
optimization problem.
The fitness function (formula (1)) is composed of
four parts, which are defined in formulas (2)-(5),
respectively. These four formulas correspond to the
heuristics described in the previous section. We
applied the division method in the fitness function to
normalize values produced by formulas (2)-(5) so
that each heuristic has equal importance. n
acot
is the
total number of nodes in AbstractCOT.
∑
represents the total number of edges in AbstractCOT.
Our objective is to minimize f(s
i
), i.e., searching a
value of f(s
i
) closer to 0 (fittest solution).
4 EMPIRICAL STUDY
We conducted experiments to evaluate the fitness
function with the four search algorithms for
addressing our optimization problem: minimizing
the manual steps required to configure a product,
while covering the VPs, fulfilling the configuration
ordering dependencies to the maximum extent and
Search-based Decision Ordering to Facilitate Product Line Engineering of Cyber-Physical System
695

4
(1)
1
(2)
(3)
∑
1,
.
∑
(4)
∑
0,
.
1,
.
2,
.
∑
(5)
starting from most constraining configuration
decisions. Details are reported in Section 5.
In Section 4.1, we present the research questions
of the empirical study. In Section 4.2, we discuss
two case studies used in the empirical evaluation.
4.1 Research Questions
In the empirical study, we aim to investigate the
following five research questions (RQs): RQ1: Are
the search algorithms effective to solve our
optimization problem, to compare with RS? RQ2:
Among the studied search algorithms, which one
fares best in solving our optimization problem? RQ3:
How does the configuration of VPs impact the
performance of the search algorithms? RQ4. How
does the number of VPs and the number of trees
impact the performance of the search algorithms?
4.2 Case Studies
Crisis Management System (CMS): We
significantly extended the scope of Crisis
Management System (CMS) based on the
requirements defined by Capozucca et al.
(Capozucca et al., 2012), modeled the architecture of
CMS containing CMS police, rescue, traffic control
etc., as well as corresponding VPs using SimPL, and
specified ordering and conformance rules as OCL
constraints. Part of the SimPL model (Table 1) has
been presented in the CMA@MODELS 2013
workshop, evaluated by modeling experts and was
deposited to the ReDoMM repository
1
for public
access.
Subsea Control: Based on several years of
experience of conducting industry-oriented research
in subsea oil and gas and in the context of PLE
1
http://www.cs.colostate.edu/remodd/v1/content/modeling-architecture-
and-design-crisis-management-system-product-line-using-simpl
(Behjati et al., 2013, Briand et al., 2012), we
modeled the main concepts presented in Part 6
(subsea production systems) of the ISO 13628-
6:2006 standard (ISO13628-6, 2006) using SimPL.
The developed SimPL (Table 1) was further
enriched with the well-known subsea engineering
hand-book (Bai and Bai, 2012).
Table 1: Descriptive Statistics of CMS and Subsea
Control.
Model Elements CMS Subsea Control
Packages
30 13
Classes
188 71
VP Types Cardinality
62 13
Attribute
49 91
Topology
9 7
All
120 111
OCL Constraints
31 25
5 EVALUATING SEARCH
ALGORITHMS
This section reports the evaluation for answering
RQ1-RQ4. The experiment design and execution is
presented in Section 5.1 and analyses and results are
discussed in Section 5.2.
5.1 Experiment Design and Execution
In our experiments, we compared three search
algorithms: AVM, GA, (1+1) EA, and used RS as a
comparison baseline to assess the difficulty of the
addressed problems. AVM represents typical local
search algorithms. GA is the most commonly
applied global search algorithm. (1+1) EA has been
proved effective for software engineering problems
(e.g., see (Huihui et al., 2015, Yan et al., 2015)). In
terms of GA, we set the population size to 100 and
the crossover rate to 0.75, and a 1.5 bias for rank
selection. We use a standard one-point crossover,
IndTrackMODELSWARD 2016 - MODELSWARD - Industrial Track
696
and mutation of a variable is done with the standard
probability 1/n, where n is the number of variables.
5.1.1 Design of Search Problems
Real-world Configuration Problems: To answer
RQ1-RQ3, we simulated two configuration
processes of the two case studies (Section 4.2) and
evaluated the performance of the search algorithms
at each manual configuration step. Notice that Zen-
DO is invoked as a result of manual configuration of
a VP in Zen-Configurator, which can lead to the
automated decision inference of other VPs. At each
manual configuration step, a new search problem is
formed and then solved by the search algorithms. As
shown in Table 1, the VPs defined in the PLA
models of CMS and Subsea Control are 120 and 111
respectively. We simulated a large part of a
complete configuration process for each case study
and as a result, we obtained 106 search problems for
CMS and 64 search problems for Subsea Control.
Notice that during the configuration process,
instances of a cardinality VP are populated based on
the configuration value to the cardinality VP. The
populated instances usually contain attribute VPs,
which need to be further configured. In short, the
number of VPs in a product model dynamically
changes while the configuration progresses.
Artificial Problem Design: To empirically
evaluate the scalability of our approach, we created
130 artificial problems. We used a range of 100 to
4600 with an increment of 500 for the number of
VPs, and a range from 10 to 250 with an increment
of 20 for the number of trees. In total we had 10
options for the number of VPs and 13 options for the
number of trees and defined 10*13 = 130 artificial
problems.
5.1.2 Dependent and Independent Variables
We used fitness value (FV) as the main dependent
variable, which is the best fitness value obtained
after a certain number of generations by an
algorithm (2000 in our experiments). In addition, we
used two additional dependent variables: mean
fitness value (MFV
p
) for each problem and mean
fitness value for a specific number of problems
(MFV
ps
). The independent variables include: type of
search algorithm (TSA), number of VPs (NVPs), and
number of trees (NTs).
For each problem, both NVP
S
and NT
S
are fixed.
MFV
p
is calculated for each algorithm using the
formula
∑
. FV is the fitness value of
one run, while l is the number of runs (100 in our
experiments).
For MFV
ps
, there are two situations. With the
fixed NVPs and various NTs, mean fitness values are
calculated for each algorithm using the
formula MFV
,
∑∑
∗
. FV
v
is the fitness
value of one run for a given NVPs. l is the number of
runs while t is NTs. With the fixed NTs and various
NVPs, mean fitness values are calculated for each
algorithm using the formula MFV
,
∑∑
∗
.
FV
t
is the fitness value of one run for a given NTs. l
is the number of runs while v is NVPs.
5.1.3 Statistical Tests
To compare the obtained results of the search
algorithms, we applied the Wilcoxon signed-rank
test and the Vargha and Delaney statistics (Arcuri,
2011). For all pairs, we conducted two samples
Wilcoxon signed-rank test to obtain a p-value which
determines the significance of results (with the
significance level of 0.05). The Vargha and Delaney
statistics (A
) was used to calculate the effect size
measure. If A
is equal to 0.5, the two algorithms A
and B are equivalent. A
is more than 0.5 implies
that A has higher chances of obtaining higher fitness
value than B. To study the correlation between the
performance of the search algorithms and NVPs as
well as NTs, we use the Spearman’s rank correlation
coefficient.
|
|
is used to determine the
significance of results with a significance level
0.0001. If ρ is greater than 0, there is a positive
correlation; otherwise, a negative correlation exists.
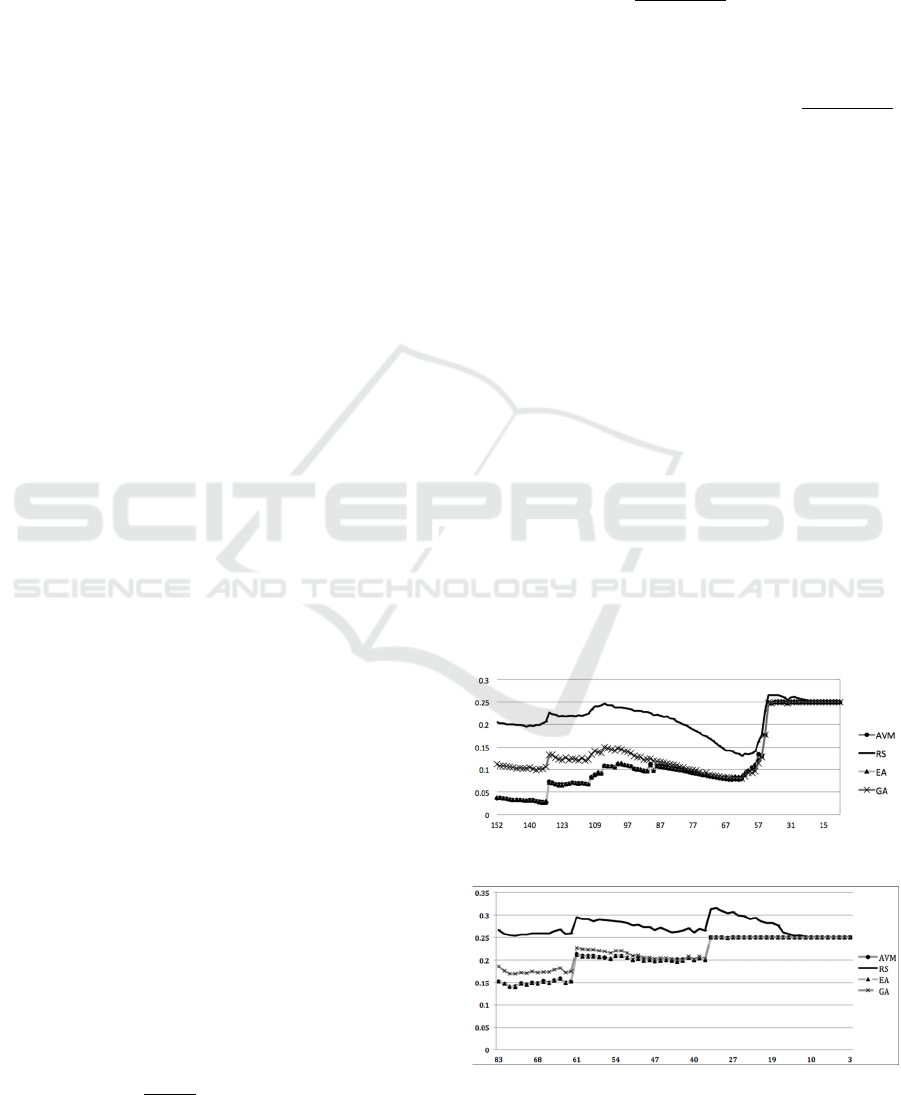
Figure 3: MFVs along with NVPs (CMS).
Figure 4: MFVs along with NVPs (Subsea Control).
Search-based Decision Ordering to Facilitate Product Line Engineering of Cyber-Physical System
697
5.1.4 Experiment Execution
Each configuration problem was repeated 100 times
for each search algorithm to counter random
variation. Each algorithm was run up to 2000
generations and the best FV obtained in the 2000
generations was recorded.
5.2 Analyses and Results
In Section 5.2.1, we report analyses and results for
the two real-world case studies for answering RQ1-
RQ3. In Section 5.2.2, we present analyses and
results for the 130 artificial problems for answering
RQ1-RQ2 and RQ4.
5.2.1 Results for the Real-World Case Study
RQ1 and RQ2: We compare RS with AVM, (1+1)
EA and GA, based on FV for each problem (Table
2). Notice that the CMS case study has in total 106
problems and the Subsea Control case study has in
total 64 problems (Section 5.1.1).
For the CMS case study, all the three search
algorithms performed significantly better than RS
for all the 106 problems (Table 1). A similar pattern
can be observed for the Subsea Control case study,
where AVM, (1+1) EA and GA performed
significantly better than RS for 64, 63 and 63
problems, respectively. We therefore can answer
RQ1 as follows: AVM, (1+1) EA and GA
significantly outperformed RS for most of the
problems suggesting the search algorithms are
effective to solve our optimization problem
compared with RS.
Regarding RQ2, for CMS, (1+1) EA
outperformed AVM for 93 problems, out of which
for 51 problems (1+1) EA performed significantly
better than AVM. There were no significant
differences observed for 48 problems. AVM
performed better than (1+1) EA for 12 problems and
only for 6 of them AVM significantly outperformed
(1+1) EA. AVM significantly outperformed GA for
105 problems and (1+1) EA significantly
outperformed GA for all the 106 problems. For
Subsea Control, (1+1) EA significantly
outperformed AVM for 59 problems and GA for all
the problems. AVM significantly outperformed GA
for 62 problems. We therefore can answer RQ2 as
follows: (1+1) EA is the best search algorithm to
solve our optimization problem followed by AVM
and GA.
RQ3: To answer RQ3, we plot the graphs shown
in Figure 3 and Figure 4, where for a given NVP
during the configuration process, the mean fitness
value is calculated for each algorithm using the
formula MFV
p
defined in Section 5.1.2. It is
important to notice that for CMS and Subsea Control
there are 106 and 64 problems respectively; the x-
axes in Figure 3 and Figure 4 should have 106 and
64 data points respectively. To avoid cluttering the
figures, only some of them are shown on the x-axis
of the figures.
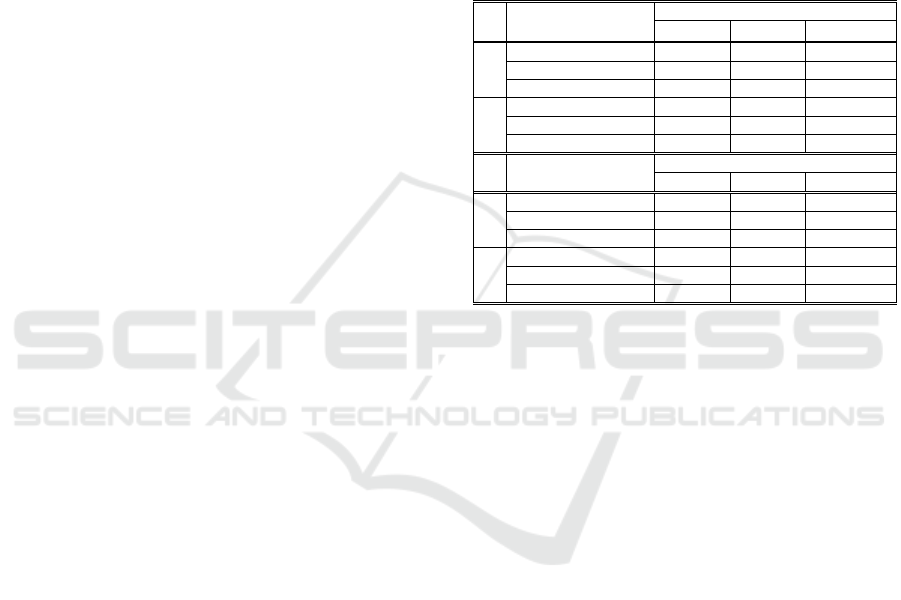
Table 2: Results for the Wilcoxon signed-rank and the
Vargha and Delaney A
statistics*.
RQ Pair of Algorithms
(A vs. B)
CMS
A>B A<B A=B
1
AVM vs. RS 106/106 0/0 0/0
(1+1) EA vs. RS 106/106 0/0 0/0
GA vs. RS 106/106 0/0 0/0
2
AVM vs. (1+1) EA 6/12 51/93 48/1
AVM vs. GA 105/106 0/0 1/0
GA vs. (1+1) EA 0/0 106/106 0/0
RQ Pair of Algorithms
(A vs. B)
Subsea Control
A>B A<B A=B
1
AVM vs. RS 63/64 0/0 1/0
(1+1) EA vs. RS 64/64 0/0 0/0
GA vs. RS 63/63 0/1 1/0
2
AVM vs. (1+1) EA 0/0 59/64 5/0
AVM vs. GA 62/63 1/1 1/0
GA vs. (1+1) EA 0/0 64/64 0/0
* In columns ‘A>B’ and (‘A<B’), the values before the slashes
are the number of problems that A is significantly better (worse)
than B, while the values after the slashes are the number of
problems that A has higher probability to be better (worse) than
B. Column ‘A=B’ tells that the number of problems that there is
no difference between A and B.
For both case studies, as shown in Figure 3 and
Figure 4 along with the configuration of the VPs,
(1+1) EA, AVM and GA are consistently better than
RS, until the value of NVPs reaches less than 30 (for
CMS) and 15 (for Subsea Control). The reason for
this may be explained by the dynamic change of the
forest itself. Along with the configuration of VPs,
the trees in the forest are becoming smaller and there
may be fewer trees in the forest. So in order to cover
as many as possible the remaining VPs, more trees
are selected, which subsequently leads to higher
fitness values. In addition, along with the
configuration, the remaining trees may have a higher
percentage of manual steps and a higher percentage
of low weight, both of which contribute to higher
fitness values. In other words, we think when
reaching the point of having less number of VPs to
configure, there is no much space for optimization.
(1+1) EA and AVM performed in a very similar
pattern for all the problems. GA performed worse
than AVM and (1+1) EA when the value of NVPs is
larger than 70 (for CMS) and 50 (for Subsea
Control). This is mostly because GA uses both
IndTrackMODELSWARD 2016 - MODELSWARD - Industrial Track
698
mutation and crossover operators to explore more
search space as compared to (1+1) EA that uses only
mutation operator and thus GA needs more
generations (greater than 2000) to obtain better
solutions for problems with a large number of VPs.
We also calculated the Spearman’s rank
correlation between MVPs for each search algorithm
with increasing NVPs. Results (Table 3) show that
for all the algorithms except for RS, along with the
increase of NVPs, MVPs decreases. Therefore, the
performance of all the algorithms in terms of finding
optimal solutions increases. Notice that the results
are consistent with what we can observe from Figure
3 and Figure 4 along with the decrease of NVPs,
MPVs increases in general. Therefore, the
explanation described above applies to here as well.
Table 3: Results of the Spearman’s correlation analysis
with the increasing NVPs.
Case Study Algorithm Spearman’s ρ Prob>|ρ|
CMS
AVM -0.8167
<.0001
(1+1) EA -0.8156
<.0001
GA -0.3412
0.0003
RS -0.2943
0.0022
Subsea Control
AVM -0.8756
<.0001
(1+1) EA -0.8713
<.0001
GA -0.7966
<.0001
RS 0.1458 0.2502
5.2.2 Results for the Artificial Problems
RQ1 and RQ2: To answer RQ1 and RQ2, we
compared the selected search algorithms with RS
and then compared each pair of them based on MFV
for each algorithm and each of the 130 artificial
problems. From Table 4, one can see that 1) AVM,
(1+1) EA and GA significantly outperformed RS for
most of the artificial problems (RQ1), 2) (1+1) EA
and AVM significantly outperformed GA for most
of the problems (RQ2) and 3) AVM is significantly
better than (1+1) EA for 62 problems while (1+1)
EA is significantly outperformed AVM for 50
problems (RQ2).
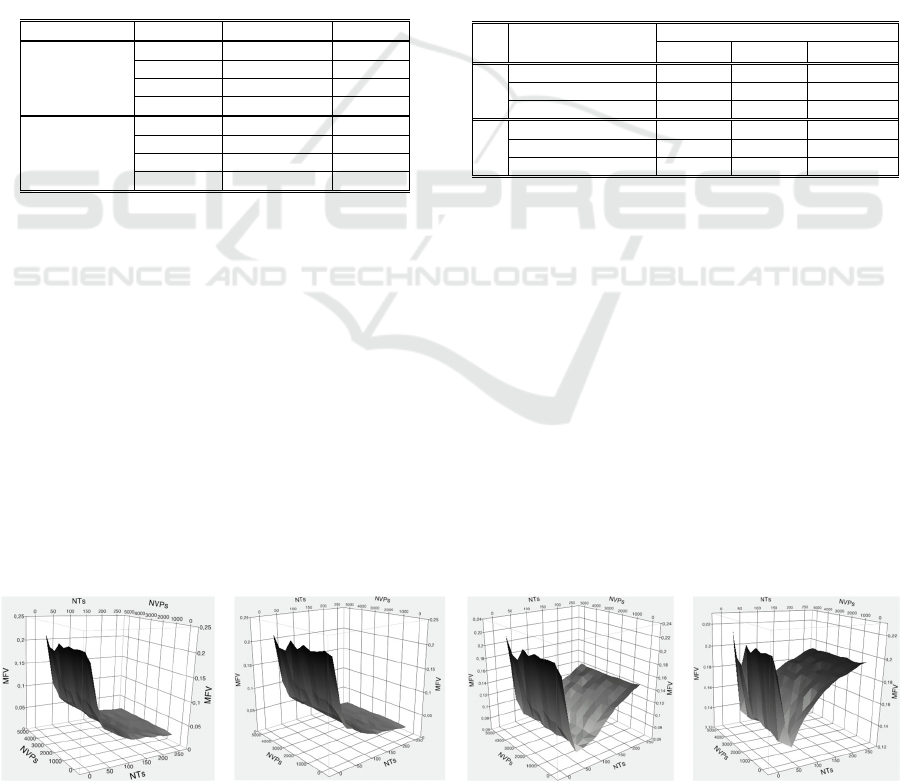
RQ4: Recall that RQ4 aims to study the impact
of the increasing number of VPs and trees on the
performance of the search algorithms. We therefore
plot surface plots as shown in Figure 5 for each
algorithm. In each plot, MFVs decrease when the
color of curves goes from black to white.
From Figure 5, we can observe that (1+1) EA
and AVM performed in a very similar pattern:
achieving very low MFVs when NTs is over 150 and
performing worse when NTs is getting smaller. The
performance of GA is the best when NTs is around
100. Its performance degraded when NTs increases
over 150. This might be because more generations
are required for GA to get better solutions when the
number of trees is large since the problems are
getting more complex. The performance of RS
follows a similar pattern as GA but RS achieved
much worse MFVs when NTs is over 100 than GA.
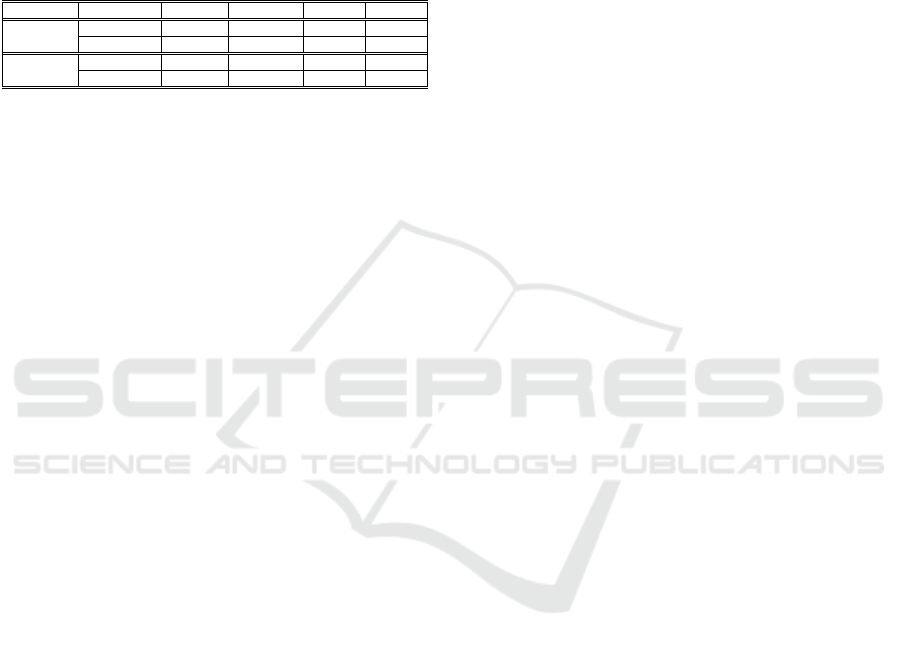
Table 4: Results for the Wilcoxon signed-rank test and the
Vargha and Delaney A
statistics.
RQ
Pair of Algorithms
(A vs. B)
CMS
A>B A<B A=B
1
AVM vs. RS 122/123 6/7 2/0
(1+1) EA vs. RS 129/130 0/0 1/0
GA vs. RS 130/130 0/0 0/0
2
AVM vs. (1+1) EA 62/70 50/58 18/2
AVM vs. GA 111/112 14/16 5/2
GA vs. (1+1) EA 0/5 120/120 10/5
When NTs decreases below 100, the
performance of all the algorithms degrades
significantly. This might be because along with the
configuration, the remaining trees may have a higher
percentage of manual steps and a higher percentage
of low weight, both of which will make a higher
fitness value. In other words, we think when
reaching this point, there will be no much space for
optimization, as we discussed previously.
To further analyze the correlation between the
performance and NTs and NVPs, we conducted the
Spearman correlation analysis. Results are presented
in Table 5. For AVM and (1+1) EA, NTs has a
significant negative correlation with MFVs,
implying that increasing NTs leads to the
improvement of the performance of these two
(1+1) EA AVM GA RS
Figure 5: Surface Plots of MFVs, NVPs and NTs.
Search-based Decision Ordering to Facilitate Product Line Engineering of Cyber-Physical System
699
algorithms. For GA, a positive (but not significant)
correlation was discovered, while a significant
positive correlation was obtained for RS. When
looking into NVPs, a significant positive correlation
with MFVs for (1+1) EA was obtained, implying
that it increasing NVPs leads to the degradation of
the performance of (1+1) EA.
Table 5: Results of the Spearman’s correlation analysis
with the increasing NVPs and NTs.
Variable Measure AVM (1+1) EA GA RS
NTs ρ
-1 -1 0.4396 0.5659
Prob>|
ρ
|
<0.0001 <0.0001
0.1329
0.0438
NVPs ρ
0.6242 0.7212 0.4545 -0.1152
Prob>|
ρ
| 0.0537
0.0186
0.1869 0.7514
6 OVERALL DISCUSSION
Based on the results of the empirical study, we
suggest using either AVM or (1+1) EA together with
our fitness function to solve the decision-ordering
problem, since these two algorithms exhibit the best
performance as compared to the other algorithms.
Recall that the mechanism of Zen-DO is based
on ordering dependencies of VPs, which can be
identified by querying the product line architecture
and design model and from constraints explicitly
capturing such dependency information. Therefore,
if a product line has a larger number of such
ordering dependencies specified, Zen-DO will
perform more effectively. In other words, it is
important to document/specify ordering
dependencies as product line assets and associate
them (via suitable mechanisms) to VPs specified in
the product line architecture and design model in the
first place, to enable effective, automated decision
ordering. In our Zen-Configurator tool, the SimPL
methodology should be used to model the product
line architecture and design and OCL should be used
to specify constraints, which can naturally integrate
with the SimPL model.
7 THREATS TO VALIDITY
Regarding construct validity, we applied the
effectiveness measure: fitness value, which is
comparable across all the algorithms. In addition, the
number of generations was used in all the search
algorithms as the stopping criterion. Random
variations inherent in the search algorithms are the
the most probable conclusion validity threat. To
tackle it, we ran each experiment repeatedly 100
times to reduce the chance that the results were
obtained by chance.
In our experiments, we used only one
configuration setting for the search algorithms,
which might form a possible threat to internal
validity. It is however worth noting that these
settings conform to common guidelines (Arcuri and
Fraser, 2011) and our experience of applying search
algorithms for addressing other software engineering
optimization problems.
We ran our experiments on the 130 artificial
problems of different complexity to test the
scalability of the algorithms. However, one may say
that the results may not be generalized to other case
studies. Such threat to external validity is common
to all empirical studies. In the future, we plan to
evaluate our approach with more case studies.
8 RELATED WORK
As concluded in (Rabiser et al., 2012, El-Sharkawy
and Schmid, 2012), an automated configuration
solution should support product configuration with
the ultimate objective of improving both the quality
of configured products and the productivity of a
configuration process. Especially for CPSs,
hundreds and thousands of configuration parameters
with complicated constraints among them have to be
correctly configured, as reported in our previous
work (Nie et al., 2013b). Automated solutions for
configuring CPSs is therefore critically required to
support, automated consistency checking, decision
inference, etc., among which decision ordering has
been recognized as one of the most important
functionalities.
8.1 Literature Review
In (Nohrer and Egyed, 2011), an approach was
proposed to optimize user guidance during decision
making with the aim to automatically order
decisions to minimize user input while giving users
freedom to make decisions that are most important
to them. SAT was used to reason about the impact of
an answer given by a user and the ideal order of the
remaining decisions. Note that this method considers
two types of dependencies among questions and
answers. For CPSs, as we reported in (Nie et al.,
2013b) we encountered very complicated constraints
as in some cases, configuring a VP is not just
making a Boolean choice but also providing a value
or selecting a type.
The authors of (White et al., 2009) proposed an
IndTrackMODELSWARD 2016 - MODELSWARD - Industrial Track
700

approach to derive a valid sequence of feature
selections, while accounting for resource constraints
such as budgetary constraints, in the context of
multi-step feature model configuration process,
which was formally formulated and mapped to CSP.
CSP solvers were then applied
to solve the problem.
An approach is proposed in (Chen and Erwig, 2011)
to identify feature selection sequences by
prioritizing features that have high selectivity, such
that the overall efficiency of the feature selection
process can be improved. Each feature is associated
with a value called selectivity, indicating the impact
of selecting a feature on the selection and removal of
other features. Feature models are translated to
algebraic expressions to compute the selectivity.
Guo et. al (Guo et al.) proposed a GA based
approach to automatically optimize feature
selections with resource constraints such as cost,
CPU and memory. Evaluation results show that the
proposed search based approach achieved promising
optimal solutions.
Notice that all the above mentioned related work
address decision ordering issues in the context of
feature models or decision models. Therefore,
constraints considered are relatively simple
dependencies among variabilities. To configure
CPSs, there exist a large number of complicated
constraints on VPs with various types, considering
that a configured product is typically an operational
CPS system. Methods for decision/feature selection
cannot meet the needs of configuring CPSs. Zen-DO
aims to address the similar kind of challenges, but in
the context of CPSs and because of their enormous
complexity, we aimed for a scalable optimization
solution and search algorithms seem to be a proper
candidate for such a solution.
To compare with these related work, an approach
proposed by Sayyad et al. in (Sayyad et al., 2013) is
most closely related to our work. Their objective is
to support feature model based automated
configuration of product lines by accounting for user
preferences. Five optimization objectives were
defined and implemented, including minimizing rule
violations, the number of deselected features, and
the number of features that was not used before,
known defects and cost. With these five objectives,
the author investigated a series of well-known multi-
objective evolutionary optimization algorithms and
concluded, based a set of extensive and well-
designed experiments, that search algorithms in
SBSE should be carefully selected and tailored for
studying complex product line
configuration/decision space.
8.2 Configuration Tool Review
We reviewed 16 product configuration tools, among
which six of them provide decision ordering support:
Pure::Variants (Beuche, 2008), Dopler (Dhungana et
al., 2011), Covamof (Sinnema et al., 2004), SPLOT
(Mendonca et al., 2009), FMP (Czarnecki et al.,
2005) and Questionnaire (La Rosa et al., 2009). We
classify the approaches for these tools into three
categories: User Defined, Dependency Based and
Depth First approaches.
The User Defined approach relies on users to
predefine configuration sequences. Some modeling
methodologies have feature attributes (FMP and
Pure::variants) or specific annotations (Covamof
using Procedural Knowledge (Hotz et al., 2004)) to
facilitate the specification of such additional
information on top of variability models (mostly
feature models). The Dependency Based ordering
approach relies on the dependency or constraints
defined as part of the product line models to derive
valid configuration sequences of VPs. Dopler,
Questionnaire and SPLOT implement this approach.
The Depth First strategy is implemented in FMP to
guide the configuration process by traversing feature
models with a predetermined order (depth-first).
Note that one of them implemented algorithms to
minimize manual configuration steps.
El-Sharkawy and Schmid (El-Sharkawy and
Schmid, 2012) categorized configuration problems
into several categories, among which ensuring
correct configuration is considered as the one that
received the most attention in the past. To ensure
correct configuration, different approaches have
been taken, including validation of (partial)
configurations, optimization based on, e.g.,
minimizing costs of resulting systems, value
propagation to reduce the number of manual
configuration steps, root analysis support for invalid
configurations, and dependency based prioritization
of configuration sequences. Our work follows into
the last category of minimizing the amount of work
that needs to be done by recommending a
configuration ordering to users. Several heuristics
based on analyzing dependencies among variabilities
are summarized in the paper: 1) analyzing the
impact of a decision on possible products that can be
derived based on the current configuration
(Benavides et al., 2005), 2) identifying local feature
selection decisions to make such that reducing the
impact of a decision on other parts of the feature
hierarchy (Czarnecki and Kim), and 3) configuring
most constraining decision first to reduce the amount
of decisions to make manually.
Search-based Decision Ordering to Facilitate Product Line Engineering of Cyber-Physical System
701

According to the study of El-Sharkawy and
Schmid (El-Sharkawy and Schmid, 2012), Dopler
(Rabiser et al., 2007) is the only tool that
implemented the heuristic: “most constraining
decisions” should be configured first with the aim to
minimize the number of decisions that must be made
manually and therefore reducing the overall
configuration effort. Our solution also includes this.
9 CONCLUSIONS
Due to the enormous complexity of Cyber-Physical
Systems (CPSs), manual configuration of products
based on a large number of various types of
constraints in CPSs is a complicated and error prone.
However, not all the steps in the configuration can
be automated and some decisions must be taken by
users. To this end, in this paper, we presented our
search-based approach to identify an optimal set of
decisions with the objectives to reduce overall
manual configuration steps, configure most
constraining decisions first, and satisfy ordering
dependencies among VPs to the maximum extent.
This objective was implemented as a fitness function
used by the search algorithms to find an optimal
solution. We empirically evaluated four search
algorithms with the fitness function on two real-
world case studies and 130 artificial problems.
Results show that Alternating Variable Method
(AVM) and (1+1) Evolutionary Algorithm (EA)
significantly outperformed the others.
REFERENCES
Cyber-Physical Systems (CPSs) [Online]. Available:
http://cyberphysicalsystems.org/.
Ali, S., Yue, T., Briand, L. & Walawege, S. 2012. A
Product Line Modeling and Configuration
Methodology to Support Model-Based Testing: An
Industrial Case Study. In the 15th international
conference on Model Driven Engineering Languages
and Systems, 2012.
Arcuri, A. 2011. It really does matter how you normalize
the branch distance in search-based software testing.
Software Testing, Verification and Reliability.
Arcuri, A. & Fraser, G. 2011. On Parameter Tuning in
Search Based Software Engineering. International
Symposium on Search Based Software Engineering
(SSBSE).
Bai, Y. & Bai, Q. 2012. Subsea engineering handbook,
Gulf Professional Publishing.
Behjati, R., Yue, T., Briand, L. & Selic, B. 2013. SimPL:
A Product-Line Modeling Methodology for Families
of Integrated Control Systems. Information and
Software Technology, 55, 607-629.
Benavides, D., Trinidad, P. & Ruiz-Cortés, A. Automated
reasoning on feature models. Advanced Information
Systems Engineering, 2005. Springer, 491-503.
Beuche, D. 2008. Modeling and building software product
lines with pure:: variants. Software Product Line
Conference, 2008. SPLC'08. 12th International, 2008..
Briand, L., Falessi, D., Nejati, S., Sabetzadeh, M. & Yue,
T. 2012. Research-based innovation: a tale of three
projects in model-driven engineering. Model Driven
Engineering Languages and Systems. Springer.
Capozucca, A., Cheng, B. H., Georg, G., Guelfi, N.,
Istoan, P., Mussbacher, G., Jensen, A., Jézéquel, J.-M.,
Kienzle, J. & Klein, J. 2012. Requirements Definition
Document for a Software Product Line of Car Crash
Management Systems. University of Nice Sophia
Antipolis, I3S CNRS, Technical Report.
Chen, S. & Erwig, M. Optimizing the product derivation
process. Software Product Line Conference (SPLC),
2011 15th International, 2011. IEEE, 35-44.
Czarnecki, K., Antkiewicz, M., Kim, C. H. P., Lau, S. &
Pietroszek, K. fmp and fmp2rsm: eclipse plug-ins for
modeling features using model templates. Companion
to the 20th annual ACM SIGPLAN conference on
Object-oriented programming, systems, languages,
and applications, 2005.
Czarnecki, K. & Kim, C. H. P. Cardinality-based feature
modeling and constraints: A progress report.
Dhungana, D., Grünbacher, P. & Rabiser, R. 2011. The
DOPLER meta-tool for decision-oriented variability
modeling: a multiple case study. Automated Software
Engineering, 18, 77-114.
El-Sharkawy, S. & Schmid, K. Supporting the effective
configuration of software product lines. Proceedings
of the 16th International Software Product Line
Conference-Volume 2, 2012. ACM, 119-126.
Frakes, W. B. & Kang, K. 2005. Software reuse research:
Status and future. Software Engineering, IEEE
Transactions on, 31, 529-536.
Guo, J., White, J., Wang, G., Li, J. & Wang, Y. A genetic
algorithm for optimized feature selection with resource
constraints in software product lines. Journal of
Systems and Software, 84, 2208-2221.
Hong, L., Tao, Y., Ali, S., Kunming, N. & Li, Z. 2014.
Zen-CC: An Automated and Incremental
Conformance Checking Solution to Support
Interactive Product Configuration. Software Reliability
Engineering (ISSRE), 2014 IEEE 25th International
Symposium on.
Hong, L., Tao, Y., Shaukat, A. & Li, Z. 2015. Model-
based Incremental Conformance Checking to Enable
Interactive Product Configuration. accetped in
Information and Software Technology.
Hotz, L., Krebs, T. & Wolter, K. Combining software
product lines and structure-based configuration—
methods and experiences. Proceedings of the
Workshop on Software Variability Management for
Product Derivation, at Software Product Line
Conference (SPLC), 2004.
IndTrackMODELSWARD 2016 - MODELSWARD - Industrial Track
702

Huihui, Z., Tao, Y., Shaukat, A. & Chao, L. 2015.
Facilitating Requirements Inspection with Search-
Based Selection of Diverse Use Case Scenarios. 9th
EAI International Conference on Bio-inspired
Information and Communications Technologies
(formerly BIONETICS).
ISO13628-6 2006. Petroleum and natural gas industries-
Design and operation of subsea production system-
Part 6:Subsea production control systems.
La Rosa, M., Van Der Aalst, W. M., Dumas, M. & Ter
Hofstede, A. H. 2009. Questionnaire-based variability
modeling for system configuration. Software and
Systems Modeling, 8, 251-274.
Mendonca, M., Branco, M. & Cowan, D. SPLOT:
software product lines online tools. Proceedings of the
24th ACM SIGPLAN conference companion on
Object oriented programming systems languages and
applications, 2009. ACM, 761-762.
Nie, K., Yue, T. & Ali, S. Towards a Search-based
Interactive Configuration of Cyber Physical System
Product Lines. Demos/Posters/StudentResearch@
MoDELS, 2013a. 71-75.
Nie, K., Yue, T., Ali, S., Zhang, L. & Fan, Z. Constraints:
The Core of Supporting Automated Product
Configuration of Cyber-Physical Systems. ACM/IEEE
16th International Conferene on Model Driven
Engineering Languages and Systems (MODELS),,
2013b.
Nohrer, A. & Egyed, A. Optimizing user guidance during
decision-making. Software Product Line Conference
(SPLC), 2011 15th International, 2011. IEEE, 25-34.
OMG Accessed: 2015. OCL 2.0 Specification,
http://www.omg.org/spec/OCL/2.2/.
Rabiser, R., Dhungana, D. & Grünbacher, P. Tool support
for product derivation in large-scale product lines: A
wizard-based approach. Workshop on Visualisation in
Software Product Line Engineering (ViSPLE), IEEE
Computer Society, 2007. 119-124.
Rabiser, R., Grünbacher, P. & Lehofer, M. A qualitative
study on user guidance capabilities in product
configuration tools. The 27th IEEE/ACM
International Conference on Automated Software
Engineering, 2012.
Sayyad, A. S., Menzies, T. & Ammar, H. 2013. On the
Value of User Preferences in Search-Based Software
Engineering: A Case Study in Software Product Lines.
Software Engineering (ICSE), 2013 35th International
Conference on.
Sinnema, M., Deelstra, S., Nijhuis, J. & Bosch, J. 2004.
Covamof: A framework for modeling variability in
software product families. Software product lines, 25-
27.
White, J., Dougherty, B., Schmidt, D. C. & Benavides, D.
Automated reasoning for multi-step feature model
configuration problems. The 13th International
Software Product Line Conference, 2009. Carnegie
Mellon University, 11-20.
Yan, L., Tao, Y., Shaukat, A. & Li, Z. 2015. Zen-
ReqOptimizer: A Search-based Approach for
Requirements Assignment Optimization. Accepted in
Empirical Software Engineering (EMSE).
Search-based Decision Ordering to Facilitate Product Line Engineering of Cyber-Physical System
703
