
Optimization of Routes for Hazardous Materials Transportation
A Case Study of Fuel Deliveries in Lisbon
Duarte Correia
1
, Marta Castilho Gomes
2
, Alexandre B. Gonçalves
2
and Sílvia Shrubsall
2
1
Instituto Superior Técnico, Universidade de Lisboa, Av. Rovisco Pais, Lisboa, Portugal
2
CERIS, Instituto Superior Técnico, Universidade de Lisboa, Av. Rovisco Pais, Lisboa, Portugal
Keywords: Hazardous Materials Transportation, Bi-level Linear Programming, Road Safety in Urban Areas,
Geographical Information Systems (GIS).
Abstract: This study aims at contributing to increase road safety by expanding knowledge on how to identify safe
urban routes for Hazardous Materials that are commercially doable. A bi-level linear model was
implemented in GAMS modelling software considering fuel distribution data and the road network for the
city of Lisbon. Its first level consists in road risk minimization whereas the second level aims at maintaining
the economic viability of the itineraries. This work expands the research of Rodrigues et al. (2015) by
increasing: (1) the comprehensiveness of the road data, and (2) the complexity of the analysis by including,
besides resident population, hospital and school users potentially affected by an accident, and by comparing
different itineraries and the computational time needed to solve the model. The work analyses much more
comprehensive data than those found in previous studies in the literature and was successful in identifying
optimal solutions, most of which in short computational time. This suggests that this methodology can be
used by the industry to identify routes for fuel distribution in urban environments. In the future, the routes
generated by the model will be compared with routes currently used in fuel distribution.
1 INTRODUCTION
Societies nowadays are extremely dependent on
Hazardous Materials (HazMats), which fulfil a wide
range of purposes, including energy supply to cities,
vehicles and industries (Erkut et al., 2007).
This study deals with the transportation of fuels,
which are also classified as HazMats (Verter and
Kara, 2008). Even though the number of accidents
involving HazMats is relatively small –
approximately four times less than the probability of
being struck by lightning (Transportation and
Infrastructure Committee, 2011), when accidents
involving HazMats occur, the severity of damages
(both personal, environmental and material) can be
high (Erkut et al., 2007).
The objective of this research is to contribute to
increase road safety through the identification of
routes for the transportation of HazMats that
minimize the risk of accident without compromising
the economic feasibility of the industry. It builds
upon and continues the research of Rodrigues (2015)
with further challenges of the road network given
that here the entire city of Lisbon (Portugal) was
analysed as the case study.
2 OPTIMIZATION MODEL
In order to identify safe routes for the transportation
of HazMats, the bi-level linear programming model
presented by Kara and Verter (2004) was
implemented. This model features two problems,
which are hierarchically solved. The problems are
related and correspond to different entities, in which
the choice that one makes is directly influenced by
the choice of the other (Bianco et al., 2009). In this
particular case, it is acceptable to consider that the
regulator, whose objective is to minimize total risk
(defined as total population exposure) is in the outer
level. Then the transportation companies correspond
to the inner level and their objective is to minimize
total cost. It is thus clear that the outer level chooses
a network where risk is controlled and the inner
level then chooses the minimum cost path from
those available (Kara and Verter, 2004).
Correia, D., Gomes, M., Gonçalves, A. and Shrubsall, S.
Optimization of Routes for Hazardous Materials Transportation - A Case Study of Fuel Deliveries in Lisbon.
DOI: 10.5220/0005711703570361
In Proceedings of 5th the International Conference on Operations Research and Enterprise Systems (ICORES 2016), pages 357-361
ISBN: 978-989-758-171-7
Copyright
c
2016 by SCITEPRESS – Science and Technology Publications, Lda. All rights reserved
357

In Kara and Verter (2004) model, the authors
consider that the consequences of an accident
involving HazMats occur until a given distance from
the place where the accident happened. This means
that when a truck is driving through a given arc, only
the people within that distance to the arc are exposed
to risk. In this model, total risk is the measure used
by the regulator and total time spent travelling is
used by companies for selecting the routes.
However, this can easily be adapted and other risk
and economic measures can be used (Rodrigues,
2014).
The outer problem decision regards which arcs
should be made available for the transportation of
HazMats and has risk as the objective function.
Since the inner problem consists in choosing which
routes will actually be used for transportation, the
binary decision variables from the outer problem
constitute parameters for the inner problem. This is
essentially the minimum cost flow problem, which
minimizes the objective function time (or distance)
travelled.
To solve the bi-level model a transformation was
applied using the Karush-Kuhn-Tucker (KKT)
conditions. The resulting model is of the mixed
integer linear programming (MILP) type, having as
the objective function the one of the outer problem
(total risk).
A detailed description of both the bi-level linear
programming model as well as the MILP model can
be found in Rodrigues (2014) and Rodrigues et al.,
(2015).
3 CASE STUDY DESCRIPTION
This work follows the methodology that was
presented by Rodrigues (2014) but with a different
road network for the Lisbon case study, which
translates into a larger problem size.
The methodology for data collection and
processing as well as the problem simplifications
were similar to the one described in Rodrigues et al.
(2015), and so only the main differences are
highlighted in this section.
Data characterising the fuel distribution includes
petrol stations and direct clients in Lisbon
municipality, supplied by the company. The amount
of daily distribution during 2013 was provided and
then aggregated to obtain annual amounts.
Rodrigues (2014) used a network for a specific
district of Lisbon (Olivais parish). This dataset was a
very detailed network, with 654 nodes and 6 origin-
destination (O-D) pairs. For the present work, the
road network for the entire Lisbon city (mapped in a
desktop geographical information system (GIS),
namely ArcGIS 10, was analyzed but considering
only the higher hierarchy routes. Even though only a
part of the roads are featured, this network consists
of 2685 arcs and 2285 nodes, which represents a
significant increase compared to the networks that
have been used previously in the reviewed literature.
There is a total of 26 O-D pairs, which also
represents a considerable increase in complexity of
the problem to be solved.
Figure 1: Road network and census tracts in Lisbon.
Figure 1 represents the road network plus the
geographical information referencing basis (census
tracts), from which the resident population was
determined (Census 2011 data).
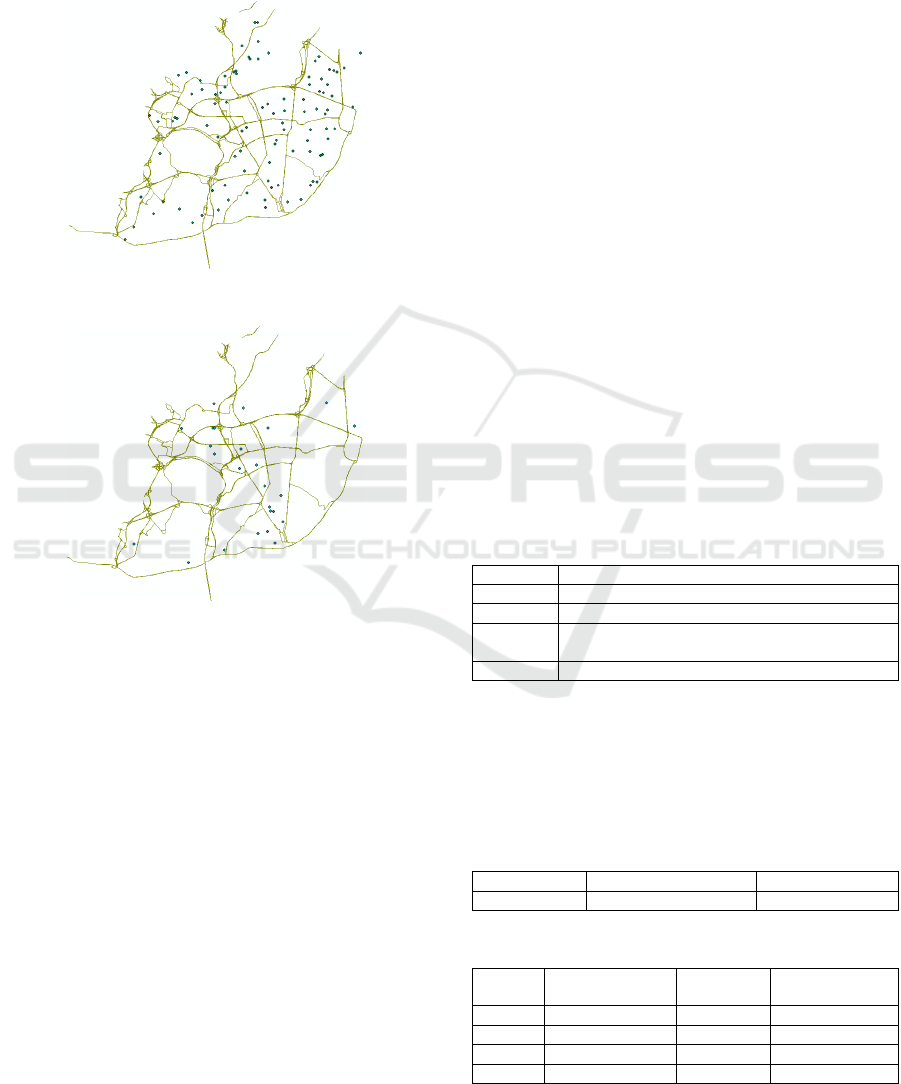
The locations of the destinations were given by
the petrol company as a list of latitude and longitude
GPS coordinates and were georeferenced in the
ArcGIS software. Then there was the need to find
out which arcs were the closest to each of these
locations, which was done using the nearest function
available in the software. Figure 2 shows in blue the
destinations operating in 2013 (26 in total) and in
black those that operated in 2012 but were shut
down during 2013 (6 in total).
Figure 2: Destinations in the road network.
ICORES 2016 - 5th International Conference on Operations Research and Enterprise Systems
358
Besides the resident population, people in
schools and hospitals nearby network arcs were also
considered (based on facility capacity data provided
by Lisbon Municipality). This encompassed 124
public and private schools and 25 public hospitals,
depicted in Figures 3 and 4.
Figure 3: Location of schools in the road network.
Figure 4: Location of hospitals in the road network.
The incorporation of high-density population
centres such as schools or hospitals in models
aiming to calculate safe routes for HazMats were not
found in the literature review. Authors such as Kara
and Verter (2004) had previously discussed the
importance of its consideration.
4 COMPUTATIONAL TOOLS
The MILP model was implemented in GAMS
modelling system and solved with CPLEX version
12.4.0.0 on a 2.8GHz Intel Core i7 4GB RAM.
The data was extracted from ArcGIS version 10
to an MS Excel spreadsheet, which was then read by
GAMS. Functionalities xls2gms and gdx that make
the connection between Excel and GAMS regarding
model input and output, respectively, were used.
After solving the model, an Excel output file is
written with a binary table where the arcs used in the
route to each destination are expressed.
As a measure of the problem data size, there are
over 1200 columns and 6600 rows in the largest
table in the Excel input data file.
5 CASE STUDY RESULTS AND
DISCUSSION
Results for the case study were obtained based on
four different sets of population figures assigned to
the network arcs. The MILP model was solved for
each of these sets henceforth named “population
combination”. For each network arc, two population
figures were computed using the GIS software: the
population living nearby each arc (the “arc
population”) and the fluctuating population due to
the schools and public hospitals considered.
Table 1 displays the four different ways these
populations figures were combined in a weighted
sum to obtain the final value for each arc, which was
the one used when solving the MILP model (i.e., the
actual model parameter). For solutions A through C
a 300 m buffer was applied, while for D the distance
of 800 m was used. Thus, comparison of objective
function values should consider that the population
that was accounted for varies among solutions.
Table 1: Weighted population combinations tested.
Solution Population combinations
A 1 x arc population + 0 x hosp_school
B 0 x arc population + 1 x hosp_school
C
0.5 x arc population +
0.5 hosp_school
D 0.5 x arc population + 0.5 x hosp_school (800m)
Table 2 shows the numeric characteristics of the
model (which depend solely on the road network)
and Table 3 shows the results when solving the
model to optimality: number of iterations, CPU time
and objective function value.
Table 2: Numeric characteristics of the model.
No. of variables No. of binary variables No. of constraints
271,842 72,603 1,824,265
Table 3: Summary of results.
Solution No. of iterations CPU time (s)
Objective
function value
A 76,155 304.6 341,974
B 1,242,987 5,010.1 706,069
C 586,489 706.0 286,199
D 28,681 29.8 316,173
Optimization of Routes for Hazardous Materials Transportation - A Case Study of Fuel Deliveries in Lisbon
359
It is worthwhile noticing that the even though the
dimension of the model was the same, CPU times
ranged from 30 sec observed for solution D to
approximately 5 min and 12 minutes in solutions A
and C, respectively, and up to 1 hour and 20 minutes
in solution B (where only school and hospital
population is considered). In solution B, population
is concentrated only in a set of points and the impact
of not having a more homogeneously distributed
population relatively to the network arcs was
decisive upon the time required to compute the
optimal solution.
Table 4 summarizes, for each solution, the
average values of population exposure, travel time
and number of arcs per route (chosen to each
destination). The average number of trucks per
destination is 112.12 per year. This number is
constant for each destination as it only depends on
the quantity of fuel delivered (information provided
by the company). Hence, it is a model parameter,
unlike the population exposure, travel time and
number of arcs per route that were computed based
on the value of the decision variables after solving
the model.
It is clear that solution B, the one that accounts
for hospitals and schools population only, stands out
for presenting higher values for time and number of
arcs per route. On the other hand, solution D, with a
weight of 0.5 for each type of population and a
buffer of 800 meters, is the solution where the
population associated with each arc, when solving
the MILP model, is more uniform, therefore it is also
the one with lowest values for time and number of
arcs. Solutions A and C present similar values and
intermediate between those of solutions B and D.
Table 4: Summary of results (average values per
destination).
Solution
Population exposure
(average)
Time (min.)
(average)
No. of arcs
used
(average)
A 13,152 14.76 79.88
B 27,156 26.96 129.23
C 11,007 15.18 74.23
D 12,160 12.29 55.58
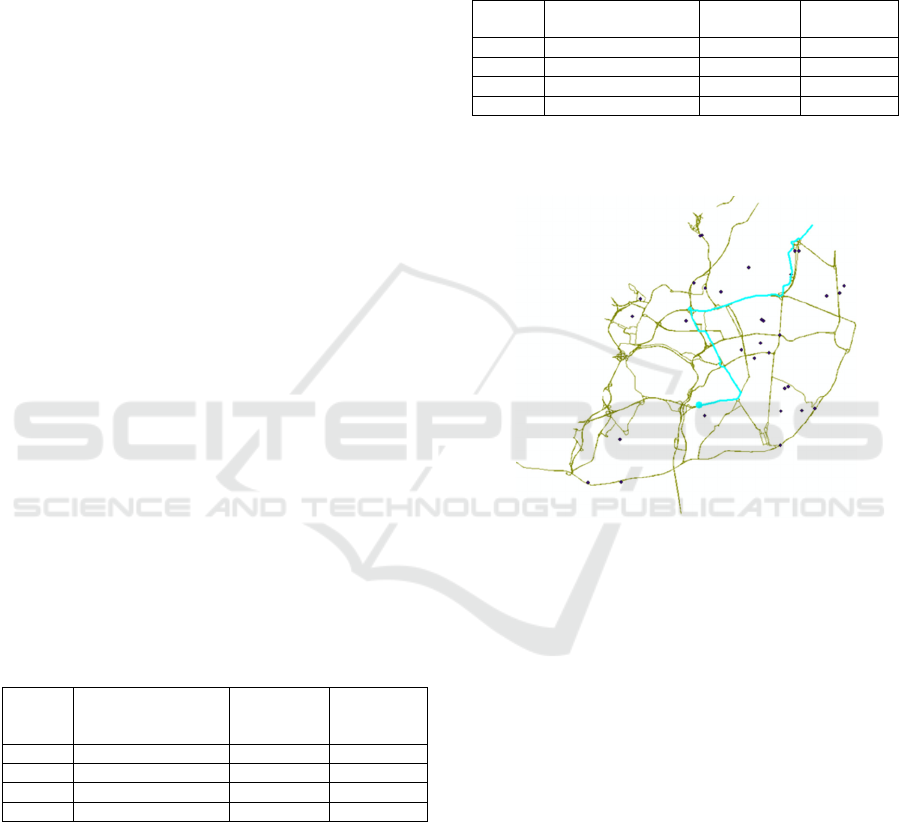
Table 5 compares the different solutions for a
particular destination (destination 23, for which the
number of trucks used is 271). This is located in the
the middle of the city, far away from the route origin
(A1 highway entrance in Lisbon). While there are
only minor changes along the route for solutions A,
C and D, there is a major change for solution B.
Population exposure is the lowest for solutions C
and D, the ones that have a split contribution from
each population source. Solution A, the one where
all the population from the census tracts is taken into
account, is the one with the least amount of people
exposed. The one where the most people are
exposed is solution B, which is also the longest route
(average travel time and number of arcs used).
Table 5: Comparison of model outputs for destination 23.
Solution Population exposure Time (min.)
No. of arcs
used
A 25,018 19.43 97
B 32,663 50.51 225
C 20,429 18.58 89
D 21,377 15.67 70
Figure 5 illustrates the route for destination 23
and solution A.
Figure 5: Route for solution A and destination 23.
6 CONCLUSIONS
There is a consensual belief on the importance of
minimizing risks associated to HazMats
transportation, particularly in urban areas, where
increasingly more people live. The growing
complexity and density of urban environments is
pressing the development of reliable and practical
tools to support the industry identifying safe and
economically viable HazMats routes. However, the
research found in the literature is still limited
particularly in the complexity of the analyzed road
networks. Aiming at contributing to increase urban
road safety and urban economic growth by
specifically supporting safe and feasible fuel
distribution, this work studied the whole city of
Lisbon, capital of Portugal, using up-to-date
distribution data provided by one petrol company
operating in the city.
ICORES 2016 - 5th International Conference on Operations Research and Enterprise Systems
360

A Geographical Information System (GIS)
platform was used in which the road network and
population were represented for Lisbon. Information
extracted from the GIS was subsequently introduced
into the mathematical modelling software GAMS.
The adopted MILP model successfully identified
optimal routes, i.e. those with least population
exposure to risk while still keeping economic
viability. Results indicate that with an optimized
method of representing population exposure along
the road network arcs it is possible to compare
population exposure for different routes and identify
options on best routes for HazMats distribution.
The presented model can be further improved by
refining the road network representation, the
information on both resident and commuter adjusted
daytime population distribution and include traffic
data. Once these recommended improvements are
built-in and adequate model calibration has been
performed there is a real potential for industry
adoption of the described methodology for HazMats
route planning.
Regarding the impact of this work, the company
is very interested in gaining more control upon the
fuel distribution routes, which are currently a
decision of the subcontracted transportation
companies. With the proposed model application,
risk and cost are made explicit and both can be
considered when deciding the routes.
REFERENCES
Bianco, L., Caramia, M., Giordani, S., 2009. A bilevel
flow model for hazmat transportation network design.
Transportation Research Part C, 17(2), 175-196.
Erkut, E., Alp, O., 2007. Designing a road network for
hazardous materials shipments. Computers &
Operations Research, 34(5), 1389-1405.
Kara, B. Y., Verter, V. 2004. Designing a Road Network
for Hazardous Materials Transportation.
Transportation Science, 38(2), 188-196.
Rodrigues, M. (2014). Itinerários seguros para o
transporte de mercadorias perigosas em Portugal.
Distribuição de combustíveis líquidos da Galp em
Lisboa. MSc dissertation in Civil Engineering,
Instituto Superior Técnico, Universidade de Lisboa.
Rodrigues M., Gomes, M. C., Gonçalves, A. B., Shrubsall,
S. 2015. Hazardous materials transportation using bi-
level linear programming. A case-study of liquid fuel
distribution. Proceedings of the 4th International
Conference on Operations Research and Enterprise
Systems (ICORES 2015), Lisbon, Portugal, 10-12
January.
Transportation & Infrastructure Committee, 2011. Hazmat
regulations must recognize importance of safety and
economic growth, http://transportation.house.gov/
Verter, V., Kara, B. Y., 2008. A Path-Based Approach for
Hazmat Transport Network Design. Management
Science, 54(1), 29-40.
Optimization of Routes for Hazardous Materials Transportation - A Case Study of Fuel Deliveries in Lisbon
361
