Building a Driving Simulator with Parallax Barrier Displays
Christoph Schinko
1
, Markus Peer
2
, Daniel Hammer
2
, Matthias Pirstinger
2
, Cornelia Lex
2
,
Ioana Koglbauer
2
, Arno Eichberger
2
, Jürgen Holzinger
3
, Eva Eggeling
1
, Dieter W. Fellner
1
and Torsten Ullrich
1
1
Fraunhofer Austria Research GmbH / Institut für ComputerGraphik & Wissensvisualisierung,
TU Graz, Graz, Austria
2
Institut für Fahrzeugtechnik, TU Graz, Graz, Austria
3
AVL List GmbH, Graz, Austria
Keywords:
Driving Simulator, Parallax Barrier, Optimization.
Abstract:
In this paper, we present an optimized 3D stereoscopic display based on parallax barriers for a driving sim-
ulator. The overall purpose of the simulator is to enable user studies in a reproducible environment under
controlled conditions to test and evaluate advanced driver assistance systems.
Our contribution and the focus of this article is a visualization based on parallax barriers with (I) a-priori
optimized barrier patterns and (II) an iterative calibration algorithm to further reduce visualization errors in-
troduced by production inaccuracies. The result is an optimized 3D stereoscopic display perfectly integrated
into its environment such that a single user in the simulator environment sees a stereoscopic image without
having to wear specialized eye-wear.
1 INTRODUCTION
A parallax barrier is a device placed in front of a dis-
play enabling it to show stereoscopic, or multiscopic
images without the need for the viewer to wear 3D
glasses. Multiscopy differs from stereoscopy in that it
displays multiple angles at once, allowing a viewer to
see the content from different angles – not just a left-
eye / right-eye angle. The parallax barrier consists of
a material with a set of precision slits, or a translucent
material with an opaque pattern, allowing each eye to
see a different set of pixels. With this separation of
the pixels it is possible to create an autostereoscopic
display – a display without the need for glasses. This
effect is illustrated in Figure 1.
The intended purpose for the parallax barrier tech-
nology in this context is an autostereoscopic display
system for a driving simulator. It consists of a mod-
ified MINI Countryman chassis with eight liquid-
crystal displays (LCDs) mounted around windscreen
and front side windows. Four 55inch LCDs are placed
radially around the hood of the car in a slanted an-
gle. Two 23inch LCDs are used for each of the two
front side windows. The four LCDs in the front are
equipped with parallax barriers made of 2cm thick
acrylic glass to minimize strain caused by the slanted
angle. Each barrier is printed with a custom-made
striped pattern, which is the result of an optimiza-
tion process. The displays are connected to a cluster
of four “standard” computers with powerful graph-
ics cards. In order to account for movement of the
driver’s head inside the car, an eye-tracking system
from SmartEye consisting of two cameras with in-
frared flashes is installed on the dashboard of the
car. The position-depended rendering of the simula-
tion scenario is performed on a cluster using the In-
stantReality framework.
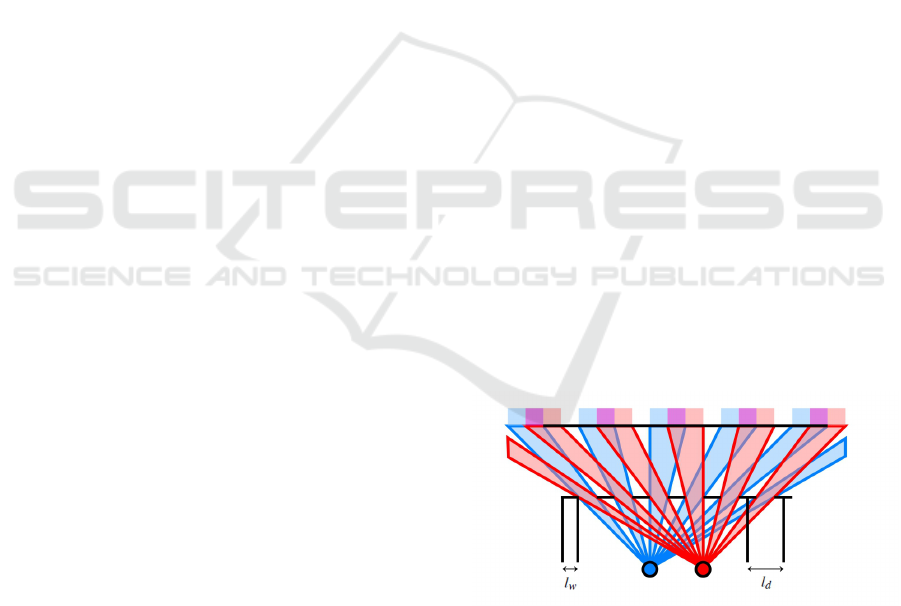
Figure 1: An autostereoscopic display can be realized us-
ing a parallax barrier. The barrier is located between the
eyes (visualized in blue and red) and the pixel array of the
display. It blocks certain pixels for each eye, which results
in the eyes seeing only disjoint pixel columns (at least in
an optimal setting). If the display is fed with correct image
data, the user sees a stereo image. The free parameters (to
optimize) are its line distance l
d
and its line width l
w
.
Schinko, C., Peer, M., Hammer, D., Pirstinger, M., Lex, C., Koglbauer, I., Eichberger, A., Holzinger, J., Eggeling, E., Fellner, D. and Ullrich, T.
Building a Driving Simulator with Parallax Barrier Displays.
DOI: 10.5220/0005711302810289
In Proceedings of the 11th Joint Conference on Computer Vision, Imaging and Computer Graphics Theory and Applications (VISIGRAPP 2016) - Volume 1: GRAPP, pages 283-291
ISBN: 978-989-758-175-5
Copyright
c
2016 by SCITEPRESS – Science and Technology Publications, Lda. All rights reserved
283

2 RELATED WORK
2.1 Teaching, Learning, Testing in a
Safe Environment
It is easy to understand why simulators have become
such a critical tool for researchers and engineers in
many fields of application. They not only consti-
tute an excellent means of research for understanding
human behavior, but also are an effective and cost-
saving tool for designing human-machine-interaction
interfaces (Eugen, 2008). Driving simulators for re-
search and development are common today, for many
reasons. The main advantages of simulators are (Pinto
et al., 2008):
1. they provide the opportunity to study either rare or
dangerous situations, as well as the environment
and configurations that do not yet exist in the real
world;
2. the parameters relevant to the conditions under
study can be recorded and experimental setups
can be strictly controlled;
3. they save time and money.
In the context of driving simulators, the applica-
tions range from research on emergency maneu-
vers (Malaterre, 1995), driving in fog (Cavallo and
Pinto, 2001), and driver vigilance (Rogé et al., 2001)
to driver training (Flexman and Stark, 1987), (Farmer
et al., 1999), (Monin, 2004), dashboard design
(Champion et al., 1999), road ergonomics (Hoekstra
and van der Horst, 2000), and prototyping of lighting
systems (Dubrovin et al., 2000).
2.2 3D Displays & Parallax Barrier
As already established in the introduction, a graphical
display is autostereoscopic when all of the work of
stereo separation is done by the display (Eichenlaub,
1998), so that the viewer does not need to wear special
glasses.
Parallax barrier technology can be used to create
autostereoscopic displays. While the technology is
harder to apply for television sets, because of the re-
quirement for a wider range of possible viewing an-
gles, it is used in the Nintendo 3DS hand-held game
console and in various smartphones (Benzie et al.,
2007). Besides the use for 3D displays, the tech-
nology also allows to separate two views to use one
display at the same time. These dual-view displays
are, for example, used for the navigation system in the
2010-model Range Rover allowing driver and passen-
ger to view different content.
Parallax barrier displays are quite simple to pro-
duce, but they have a number of limitations. The
most important one is that they are limited to one user
whose position needs to be fixed or is at least limited
to a few viewing spots that depend on the viewing an-
gle with respect to the display. In our scenario the
limitation to a single user is not a problem, since it is
limited to one user (the driver) anyway. The other part
is the fact that the viewer must remain in a fixed posi-
tion. This drawback can be eliminated by virtually ad-
justing the pixel columns such that the separation re-
mains intact, as presented by (Sandin et al., 2001) and
by (Peterka et al., 2007). In order to accurately ad-
just the pixels, some kind of user tracking is needed,
which also limits the number of possible users. Most
consumer products containing autostereoscopic dis-
plays, however, just combine parallax barriers with
lenticular lenses. This approach does not put any con-
straints on the number of possible users at a time, but
is relatively restricted concerning the possible view-
ing position(s).
Since the user’s possible viewing positions are
very limited in our scenario anyway, there is no need
to adjust for large distance variations, for example, us-
ing a dynamic parallax barrier (Perlin et al., 2000). A
static setup of the two cameras used by the eye-tracker
is enough to cover the typical movement of a user.
Another drawback of the parallax barrier tech-
nique is that the resolution drops down to about a half
for just a single user. In the presented scenario, this is
not a critical point since the available resolution is suf-
ficiently with respect to the distance of the driver (four
displays each with a resolution of 1920 × 1080 pix-
els results in an overall resolution of more than eight
megapixels).
Finally, the loss of brightness caused by the par-
allax barrier is a limitation for many use cases.
Lanman et al. presented an approach for content-
adaptive parallax barriers to overcome this issues
by using an adaptive mask in a dual-stacked LCD
(Lanman et al., 2010). However, the real-time appli-
cation for dynamic content in a driving simulator is
ruled out due to the involved computational complex-
ity.
Glasses-free 3D Displays are not limited to use
parallax barrier technology. Recent research by
Wetzstein et al. provides alternatives to static par-
allax barrier solutions. One approach is based
on a light field display using volumetric attenua-
tors (Wetzstein et al., 2011). Another approach uses
a family of compressive light field displays employ-
ing a stack of time-multiplexed, light-attenuating lay-
ers (Wetzstein et al., 2012).
GRAPP 2016 - International Conference on Computer Graphics Theory and Applications
284
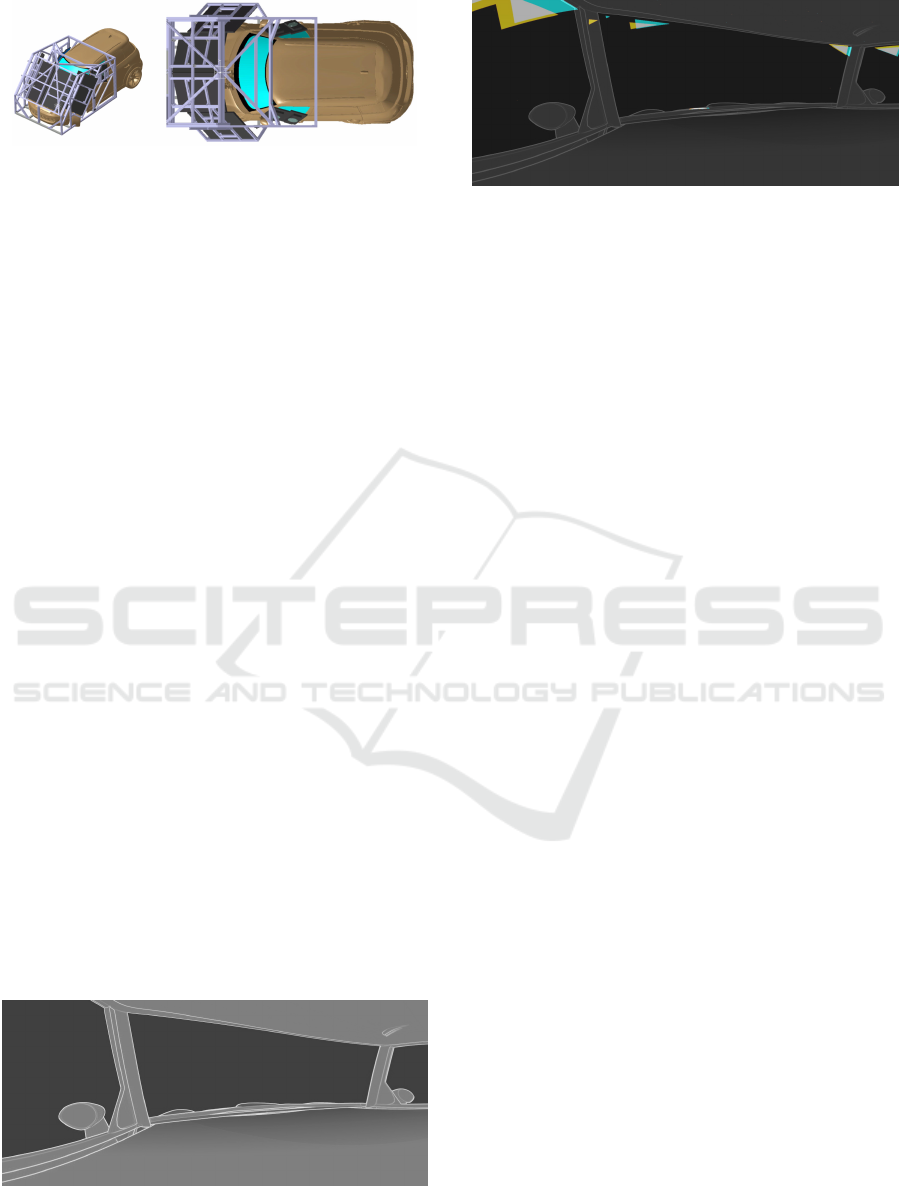
Figure 2: The result of the optimized display arrangement
has been the basis of the simulator construction. This Figure
illustrates the final setup with four 55" front displays and
two 23" displays on each side.
3 PARALLAX BARRIER DISPLAY
CONFIGURATION
During the design of the driving simulator, the dis-
play configuration has been optimized in a two step
procedure (see Figure 2).
3.1 Display Arrangement
The first optimization step determines the best posi-
tion of each display. The displays have to be arranged
around a MINI Countryman, which is the basis of the
driving simulator, without interfering or penetrating
the vehicle’s bodywork. Furthermore, the displays
should obstruct the driver’s view as much as pos-
sible in order to avoid distracting parts of the non-
simulation environment being visible.
The optimization uses a cylindrical rendering as
a cost function: the cameras are placed at the posi-
tion of the driver’s eyes, occluding geometry by the
vehicle is supplied with a black / non-visible mate-
rial, the displays are black / non-visible as well, and
the whole scene is placed in surrounding, illuminat-
ing sphere in cyan and yellow – for each eye sepa-
rately. The geometric setting is illustrated in Figure 3,
while the result of the cost function of the optimal so-
lution is shown in Figure 4. Each non-black pixel is
a disturbing view past the displays. Minimizing the
number of such pixels, improves the overall simulator
experience.
Figure 3: In order to optimize the display arrangement, the
displays’ visibility has been analyzed using cylindrical ren-
derings from the driver’s position.
Figure 4: Using the setting illustrated in Figure 3 with oc-
cluding vehicle geometry and displays rendered in black,
and the environment rendered in cyan and yellow for each
eye separately, the cost function can be minimized easily:
Each non-black pixel is a disturbing view past the displays.
These pixels should be removed. For ease of understanding
Figure 3 is overlaid semi-transparently.
3.2 Pattern Optimization
The first step of the optimization of the display con-
figuration determined the best position of each dis-
play. The second step uses the display position and
the driver’s position in order to optimize the barrier
pattern. In detail, the barrier pattern is a set of lines,
which is printed on 2cm thick acrylic glass in the front
of each display. The pattern is described by three pa-
rameters; i.e. the line width l
w
, the distance between
two consecutive lines l
d
measured between medial
axes, and their deviation from a vertical alignment l
a
.
The cost function of the second optimization routine
depends on these three parameters. In each evaluation
a geometric scene is generated (including the vehicle,
the displays, and the line of the barrier pattern). For
each scene, the rays – from the position of the driver’s
eyes to each display pixel – check the visibility of a
display pixel for each eye.
The result for each pixel can be: (i) visible by both
eyes, (ii) visible by left eye only, (iii) visible by right
eye only, or (iv) not visible at all. The objective func-
tion simply counts the number of pixels, which can
be seen by both eyes, or which cannot be seen at all
(i.e. which are not separable). More details on this op-
timization process have been published in (Eggeling
et al., 2013).
The optimization returns the optimal configura-
tion. Unfortunately, the manufactured driving simu-
lator differs significantly from its specification:
• As the displays and the barriers are arranged in
an inclined plane, sagging effects in the order of
millimeters occur.
• The printed parallax barrier pattern has not the
required precision; that is, the lines are up to
0.15mm (+12.4%) wider than specified.
• The refractive index of the acrylic glass has not
been considered in the planning stage.
Building a Driving Simulator with Parallax Barrier Displays
285

While the first problem has been fixed with additional
mountings, the second and the third problem have
been solved via the calibration described below.
4 PARALLAX BARRIER DISPLAY
CALIBRATION
Due to the already mentioned deviations of the man-
ufactured acrylic glasses from the ideal ones, addi-
tional calibration steps became necessary. We opted
for a calibration solution on-site because of possi-
ble inaccuracies in the direct measurement of display
and parallax barrier parameters, and the inability to
make exact measurements of the distance from the
display’s pixel array to the parallax barrier – at least
without disassembling the displays. Also we need to
take influences of the environment, like lighting con-
ditions and heat development of all participating com-
ponents, into account.
To establish a ground truth, we need accurate mea-
surements of a number of display and barrier param-
eters. Some parameters are scalar values (e.g. dis-
tance between two consecutive lines of a parallax bar-
rier l
d
), while others are vectors (e.g. the global po-
sition of the parallax barriers and the displays) that
need to be registered to a global coordinate system. A
first idea to measure vector-valued parameters using
a robotic arm was soon discarded due to the intricate
construction of the mounting frame for the displays
and the resulting inaccessibility of the corner points.
A second idea to use a tracked (using the eye-tracker)
laser distance measuring unit was discarded as well
due to line of sight problems.
The solution we opted for is an indirect system
using a digital video camera. Since we already have
initial values from direct measurements and the digi-
tal construction of the driving simulator, we can opti-
mize the parameters by evaluating a video feed from
a camera. In this way, we do not optimize and cali-
brate the display parameters directly, but we calibrate
the end result.
This calibration is done for each display sepa-
rately. It requires a custom mounting for the camera to
be able to account for horizontal rotation. Therefore,
the optical center of the camera was measured using
a Panosaurus device from Gregwired. Afterwards we
created a matching mounting to be able to rotate the
camera horizontally around it’s center (initial tests re-
vealed that no vertical rotation is necessary). Attach-
ing the mount in the driving simulator was no difficult
task, since we already had a mounting for the calibra-
tion pattern of the eye-tracking system. We modified
it for the camera mount to be placed exactly in the
position of left and right eye (separated by 65mm).
Our parallax barrier display calibration consists of
several steps that are designed to be performed one
after the other.
4.1 Video Mask Determination
In a first step, we render two images and capture them
with the video feedback loop. One image is com-
pletely black; the other one is completely white (see
Figure 5, left). We perform this step in order to au-
tomatically create a mask, which is used in all subse-
quent steps to restrict the calibration to the display’s
area and to ignore irrelevant parts of the video images.
For each pixel the mask stores a value between zero
and one indicating whether the pixel shows a part of
the display (1.0) or not (0.0 otherwise). The result is
shown in Figure 5, right.
Figure 5: The parallax barrier display calibration only uses
clipped / weighted video input. The corresponding mask
is generated in the first step. Although the automatically
generated mask is sufficient, we advise to use a manually
clipped mask as shown on the right hand side. (The oc-
cluder in the upper right part of the images is the MINI’s
interior mirror).
4.2 Color Calibration
The next step is to perform a single color test to com-
pare input colors (sent to a display) with output col-
ors (captured by the video camera) for a configurable
amount of colors (256 per default) spread evenly in
the RGB color space. A smaller example is shown
in Figure 6. This step is done in order to take color
deviation into account. Color deviation occurs due to
non-calibrated hardware and due to color shifting ef-
fects caused by looking at the displays at an angle.
The error function of the color calibration is the sum
of per-pixel differences weighted with the normalized
mask of the previous step.
4.3 Display Calibration
The third and the fourth steps are the optimization of
the barrier parameters: we start in the third step with
the sampling of the parameter space using the theo-
retical parameters (the values the parameters should
GRAPP 2016 - International Conference on Computer Graphics Theory and Applications
286
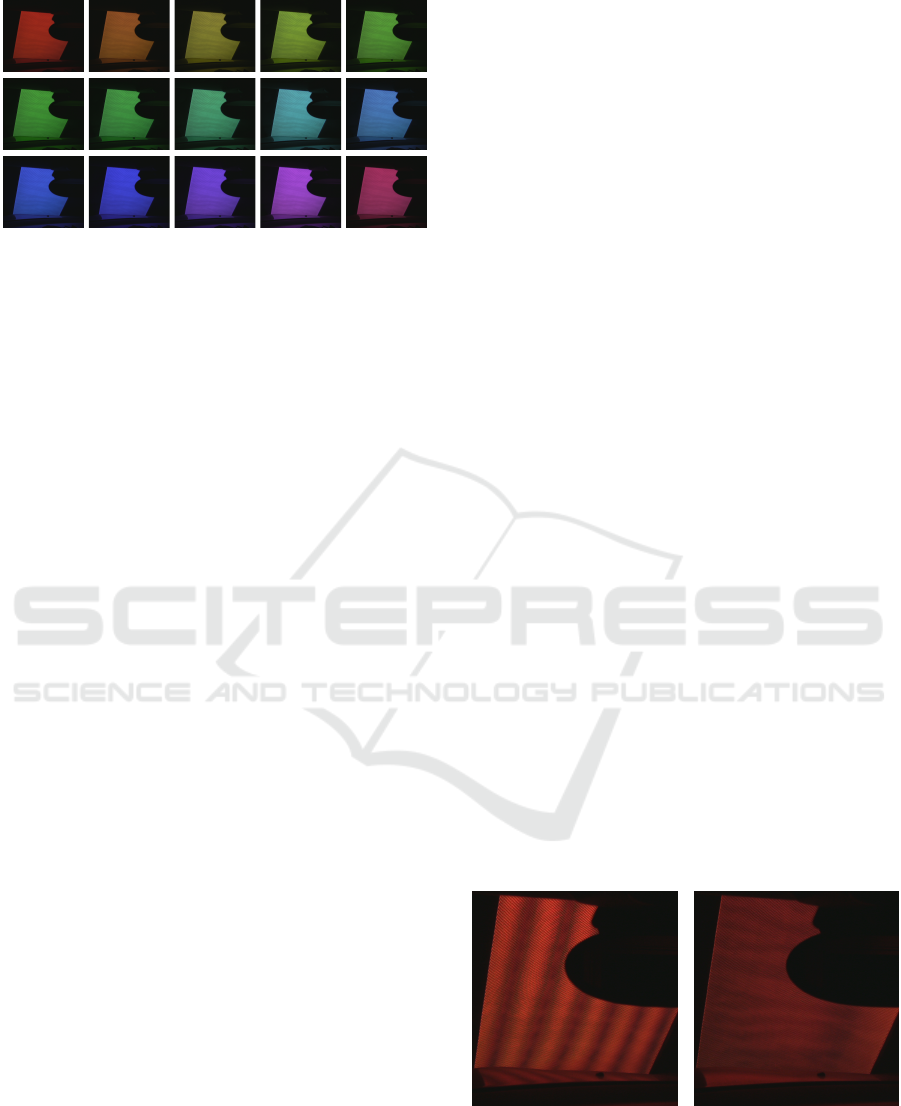
Figure 6: The color calibration step is performed to re-
duce hardware-based color shifting effects. These 15 im-
ages show the captured results of fully saturated colors with
varying hue. In our setting the color red shows exceedingly
few shifting effects. Consequently, it is the selected color
for the following calibration steps.
have according to the construction plan) extended to
a sufficiently large interval. The fourth step uses the
best configuration of the third step and performs a
fine-tuning using a minimizing optimization routine.
In both steps we use the following setup. We start
with a parameter vector, i.e., the assignment of all
variables (barrier line width l
w
, barrier line orienta-
tion l
α
, barrier line vertical offset l
y
, etc.). Based on
these values, a test image is calculated. It shows a
black pixel, if the pixel is visible from the eye posi-
tion at which the camera is currently positioned. Oth-
erwise a colored pixel (using the color determined in
the color calibration step) is shown. Having calcu-
lated the test image, our calibration tool displays the
image and captures the video image to check the re-
sult. The goal is to have a completely black image.
Consequently, the error function simply counts the
number of non-black pixels weighted with the cali-
bration mask.
While the third step is a sampling of the multidi-
mensional parameter space to obtain uniformly dis-
tributed samples (see Figure 7, left), the fourth step
uses the same error function and the best sample in
order to fine-tune the settings with a conjugate direc-
tion search routine (see Figure 7, right).
During several calibrations we made some inter-
esting observations:
• The parameters barrier line width l
w
and barrier
line distance l
d
are not independent (see Figure 1).
If the optimization routine does not have addi-
tional constraints, it returns a parameter setting,
which corresponds to a black test image and there-
fore in a black video captured image. We solved
this problem by introducing the linear constraint
2 · l
w
= l
d
, which we identified heuristically in a
manual optimization test.
• The optimization routine returns the same config-
uration for both eyes (with the numerical preci-
sion of the termination condition used by the op-
timization routine), although the calibrations have
been performed separately. Therefore, we have
not been confronted with the problem of handling
two different parameter settings and how to merge
/ combine them.
• The complete calibration is not optimized for
speed, but it runs completely automatically and
can be started at any step, if previous results are
available. In practice, the color calibration is per-
formed once, for one eye position only. Also it is
also possible to directly define a staring set of par-
allax barrier parameters to skip the time consum-
ing sampling step in the second stage and directly
start with the optimization routine.
4.4 Parameter Tuning
With the optimized set of parameters at hand, the first
tests with real persons using the eye-tracking data re-
vealed problems with ghosting effects, thus the pixel
separation was not ideal. Having ruled out any prob-
lems in the visualization pipeline, we encountered
two problems.
1. The size of a pixel with respect to the line width
of the barrier is rather large. Depending on the
viewing angle, it is possible to have a pixel classi-
fied as visible by one eye, while nearly half of the
pixel is visible for both eyes.
2. We also found the eye-tracking data to be the
source of inaccuracy – the two camera system is
struggling with partial occlusion and/or bad light-
ing conditions.
A solution to overcome these issues is to virtually in-
crease the parameter value of the barrier line width.
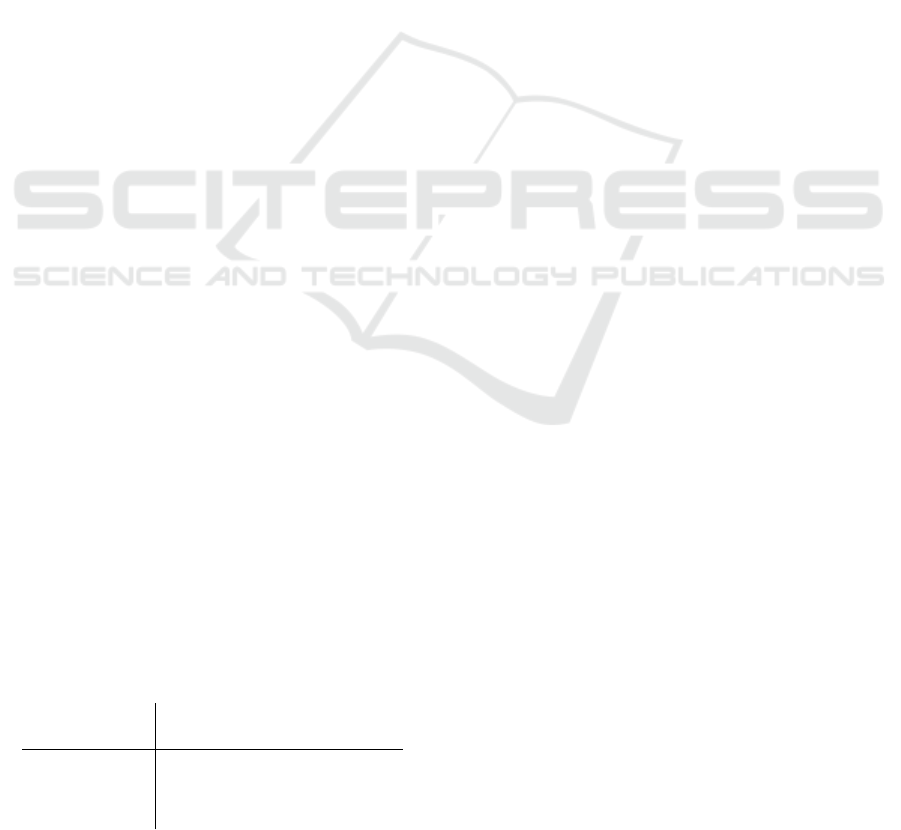
Figure 7: The display calibration optimizes the parameter
configuration using a sampling of the multidimensional pa-
rameter space to obtain uniformly distributed samples and
a directed conjugate search routine. On the left hand side
the Figure shows a bad configuration captured during the
sampling stage. The right hand side shows a good, final
configuration.
Building a Driving Simulator with Parallax Barrier Displays
287

This way the virtual barrier becomes larger and more
pixels are considered as non-separable. They are vis-
ible by both eyes or not visible at all. This solution
reduces ghosting at the cost of resolution and bright-
ness (as non-separable pixels are rendered black). The
reduced resolution was observable in driving scenar-
ios with detailed models and textures. We did not en-
counter any problems concerning brightness, because
the environment in the driving simulator is very dark.
4.5 Runtime
Visualizing a scene in the driving simulator is handled
by the InstantReality framework. Several components
work hand in hand to incorporate user tracking as well
as autostereoscopic rendering. User tracking is car-
ried out by a SmartEye eye-tracking system with two
cameras mounted at the base of the A-pillar on the
dashboard and inside the left ventilation vent of the
co-driver. This placement ensures minimal occlusion
caused by the steering wheel and the necessary degree
of inconspicuousness for drivers to not feel observed.
The mandatory infrared flashes however are clearly
visible (see Teaser Figure). The eye-tracking system
provides head position and rotation as well as the po-
sition of left and right eye. These values are needed
to calculate the correct perspective projection and to
take the parallax barrier into account using a custom
InstantReality node.
In detail, the perspective projection is directly
handled by the InstantReality framework, while all
parallax barrier calculations are performed using a
multi-pass shader pipeline. In a first step, the images
for left and right eye are rendered off-screen into two
textures. A fragment shader in the following pass per-
forms intersection tests (viewing ray ↔ parallax bar-
rier) at runtime from both eyes to all display pixels for
the classification of the pixels (visible by both eyes,
visible by left eye only, visible by right eye only, not
visible). With the classification of the pixels at hand,
the corresponding values from the textures are used to
create the final image. Pixels visible by both eyes as
well as pixels not visible are set to black.
For the simulation part of the driving simulator,
the visualization is a black box for visualizing a scene
graph. All updates are sent using the External Author-
ing Interface of the InstantReality framework. The vi-
sualization system on the other hand is not dependent
on the simulation.
5 EVALUATION
The complete optimization (including video mask de-
termination, color calibration, display calibration, and
parameter tuning) ran fully automatically and needed
approximately 2
1
2
hours per display. The final bar-
rier parameters returned by the calibration routine has
led to an error of 14%–16%; i.e. approximately one-
seventh of all pixels show a wrong color for at least
one eye. These values have been used in a final user
study with 21 test persons. Each test consisted of
different, combined driving situations including in-
ner city scenarios, overland tours and high-speed mo-
torway driving. The participants answered several
questions during the test phase and afterwards. The
questionnaire consisted of the standardized simulator
sickness questionnaire (Kennedy et al., 1993), gen-
eral questions about the overall system and specific
questions on relevant subsystems such as visualiza-
tion, physical simulation, haptic realism of the force-
feedback devices, acoustics, etc. In the following sub-
sections we focus on the overall impression including
simulator sickness and visualization specific aspects.
5.1 Visualization System
The visualization system has a large influence for the
overall experience with the driving simulator. While
some preliminary tests have been conducted using 2D
visualization, the majority of the scenarios was tested
in 3D. Since it is not easily possible to remove the
parallax barriers, the participants had to deal with the
parallax barriers during tests in 2D as well.
On a scale from unrealistic to realistic, 16 out
of 21 participants (about 76%) evaluated the visual-
ization system as being rather realistic or realistic.
Three participants deemed the visualization system to
be unrealistic. Two of them had problems with ghost-
ing effects and projection offsets which are caused by
problems of the eye-tracking system. The last partic-
ipant of the three was not experiencing these effects,
but suffered from general discomfort.
With the same scale, 13 out of 21 participants
(about 62%) experienced the representation of the en-
vironment (i.e. the modeled 3D scene) as rather real-
istic or realistic. One of the participants voted with
unrealistic. The participant was one of the three ex-
periencing the visualization system as unrealistic.
From the 21 participants, 20 (about 95%) an-
swered neutral or positive when asked to rate the driv-
ing simulator towards usefulness – 15 of them rated
positive. The remaining participant was the one suf-
fering from general discomfort.
A total of 14 participants (about 67%) would defi-
nitely partake in another study using this driving sim-
ulator; two participants would not. When asked to
recommend the driving simulator to other drivers, 17
GRAPP 2016 - International Conference on Computer Graphics Theory and Applications
288
(about 81%) participants would do so. One partici-
pant answered negative when asked which impression
of the driving simulator other drivers would get.
Answering open questions, one participant
deemed the 3D visualization as being the most useful
part of the driving simulator. On the other hand,
participants had problems with dizziness, ghosting
effects, the parallax barrier lines as well as stifling air.
One participant struggling with ghosting effects had
difficulties in perceiving speed with the 2D visualiza-
tion, but had a better perception in 3D. We also had a
suggestion to change the color of the parallax barrier
lines from black to some color with less contrast.
Regarding the choice of the preferred visualization,
we had an almost neutral result between 2D and 3D.
5.2 Simulator Sickness Questionnaire
Simulator sickness and motion sickness result in
feelings of nausea, dizziness, vertigo, and sweating
(among other symptoms). Simulator sickness is gen-
erally the result of the discrepancy between simulated
visual motion and the sense of movement stemming
from the vestibular system (Balk et al., 2013). In
many simulators, the visual system receives informa-
tion that suggests movement (e.g., roadway scenes
passing by the viewer), yet the vestibular system in-
terprets a stationary status. It is this discrepancy that
causes simulator sickness in many people.
There are many different ways to assess simula-
tor sickness. The most popular way is the Simulator
Sickness Questionnaire (SSQ) by R. S. Kennedy et
al. (Kennedy et al., 1993). This questionnaire asks
participants to score 16 symptoms (of three general
categories: oculomotor, disorientation, and nausea)
on a four point scale (0-3). Weights are assigned to
each of the categories and summed together to obtain
a single score.
The average values of our driving simulator us-
ing parallax barrier techniques in the categories ocu-
lomotor, disorientation, and nausea are listed in Ta-
ble 1 (evaluated according to Fisher et al (Fisher et al.,
Table 1: The driving simulator using parallax barrier has
been evaluated using the Simulator Sickness Question-
naire (Kennedy et al., 1993). In order to interpret the scores
we include comparative values for non-stereoscopic dis-
plays (Virtual 2D) and stereoscopic displays using shutter
techniques (Virtual 3D) (Häkkinen et al., 2006).
Parallax Virtual Virtual
Barrier 2D 3D
nausea 34.9 11.8 29.9
oculomotor 49.8 14.0 26.9
disorientation 79.5 21.1 41.1
2011)). The Table includes comparative values pub-
lished by Häkkinen et al. (Häkkinen et al., 2006),
who investigated “Simulator sickness in virtual dis-
play gaming: a comparison of stereoscopic and non-
stereoscopic situations”.
6 CONCLUSION & FUTURE
WORK
This article describes the construction, design, opti-
mization, calibration and evaluation of a parallax bar-
rier on a driving simulator.
6.1 Contribution
This work presents a real system by a selective exam-
ination of specific aspects embodied in the system. To
the best of our knowledge, our driving simulator is the
first one with parallax barrier stereoscopic displays.
While each single component has been investi-
gated before (Eggeling et al., 2013), the combina-
tion and interaction of all parts has been a challenge.
Therefore, the description of the lessons learned (see
Section 3. and 4.) are a valuable contribution – espe-
cially, the approach to use a video feedback loop and
the calibration routine to compensate for
• hardware inaccuracies and
• problems due to inaccessible displays, respec-
tively intricate direct measurements.
6.2 Benefit
When faced with the question which visualization
technique to be used in the context of a simulator en-
vironment, our evaluation gives decision support: it
allows a reader to assess parallax barrier techniques.
Some aspects (hardware costs, etc.) can be estimated
in advance, while other ones (user acceptance, simu-
lator sickness, etc.) cannot be estimated beforehand.
Based on the “in advance estimation”, we have cho-
sen the parallax barrier technique mainly due to its
reduced costs.
Concerning user acceptance, the evaluation uses
the “standardized” Simulator Sickness Question-
naire (Kennedy et al., 1993) and relates the scores
of the barrier approach with shutter-based, stereo-
scopic solutions. Unfortunately, the parallax barrier
approach is still not the first choice considering simu-
lator sickness.
Building a Driving Simulator with Parallax Barrier Displays
289

6.3 Future Work
A question of future research is what to do with the
pixels that are visible by both eyes. Preliminary tests
using a blend of both images for these pixels resulted
in significant ghosting effects. These effects are no-
ticeable in areas of high frequency (i.e. with large
differences in the pixel values of the two images), but
are less noticeable in homogeneous regions. An idea
would be to use the pixels only for these areas to ob-
tain more overall brightness.
With the availability of the gaze direction pro-
vided by the eye-tracking system it is possible to re-
strict the parallax barrier calculation to a certain re-
gion. The idea is to have a two-dimensional render-
ing for peripheral areas and do intricate barrier calcu-
lations only in an area around the gaze direction. This
kind of rendering may reduce the simulator sickness.
An open question in this context is whether there is
a need to predict the movement of the eye, or the up-
date rate of the eye positions (totally depending on the
eye-tracking system) is sufficiently high.
Especially in driving scenarios, dazzling effects
play an important role; they are difficult to implement
using standard display hardware because of low dy-
namic range of the light source. Such High Dynamic
Range effects can be approximated using special ren-
dering techniques – but only to a limited degree.
ACKNOWLEDGEMENT
This work is part of the project “MueGen Driving”,
funded by the Austrian Ministry for Transport, In-
novation and Technology and the Austrian Research
Agency in the FEMtech Program Talents. Further-
more, it is supported by the government of the Aus-
trian federal state of Styria within the project “CUBA
– Contextual User Behavior Analysis”.
REFERENCES
Balk, S. A., Bertola, A., and Inman, V. W. (2013). Simula-
tor Sickness Questionnaire: Twenty Years Later. Pro-
ceedings of the International Driving Symposium on
Human Factors in Driver Assessment, Training, and
Vehicle Design, 7:257–263.
Benzie, P., Watson, J., Surman, P., Rakkolainen, I., Hopf,
K., Urey, H., Sainov, V., and von Kopylow, C. (2007).
A Survey of 3DTV Displays: Techniques and Tech-
nologies. IEEE Transactions on Circuits and Systems
for Video Technology, 17:1647–1658.
Cavallo, V. and Pinto, M. (2001). Does Speed Perception
Indeed Fog up as Visibility Drops? Proceedings of the
International Conference Vision in Vehicles, 9:308–
314.
Champion, A., Mandiau, R., Kolski, C., Heidet, A., and
Kemeny, A. (1999). Traffic Generation with the
SCANER II Simulator: Towards a Multi-Agent Ar-
chitecture. Proceedings of Driving Simulation Con-
ference, 5:1–15.
Dubrovin, A., Lelevé, J., Prévost, A., Canry, M., Cherfan,
S., Lecocq, P., Kelada, J. M., and Kemeny, A. (2000).
Application of Real-Time Lighting Simulation for In-
telligent Front-Lighting Studies. Proceedings of Driv-
ing Simulation Conference, 6:32–38.
Eggeling, E., Halm, A., Fellner, D. W., and Ullrich, T.
(2013). Optimization of an Autostereoscopic Display
for a Driving Simulator. Joint Conference on Com-
puter Vision, Imaging and Computer Graphics Theory
and Applications, 8:318–326.
Eichenlaub, J. B. (1998). Lightweight compact 2D/3D au-
tostereoscopic LCD backlight for games, monitor, and
notebook applications. Stereoscopic Displays and Vir-
tual Reality Systems, 5:180–185.
Eugen, T. (2008). Use and validation of driving simulators.
Doctoral Theses at NTNU (Norwegian University of
Science and Technology).
Farmer, E., Reimersma, J., Moraal, J., Jorna, P., and
Van Rooij, J. (1999). Handbook of Simulator-Based
Training. Ashgate Publishing.
Fisher, D. L., Rizzo, M., and Caird, J. K. (2011). Handbook
of Driving Simulation for Engineering, Medicine, and
Psychology. Crc Press Inc.
Flexman, R. P. and Stark, E. A. (1987). Training simulators.
Handbook of Human Factors, 1:1012–1037.
Häkkinen, J., Pölönen, M., Takatalo, J., and Nyman, G.
(2006). Simulator sickness in virtual display gaming:
a comparison of stereoscopic and non-stereoscopic
situations. Proceedings of the conference on Human-
computer interaction with mobile devices and ser-
vices, 8:227–230.
Hoekstra, W. and van der Horst, A. R. A. (2000). New road
designs tested in a driving simulator. Proceedings of
Driving Simulation Conference, 6:1–6.
Kennedy, R. S., Lane, N. E., Berbaum, K. S., and Lilienthal,
M. G. (1993). Simulator Sickness Questionnaire: An
enhanced method for quantifying simulator sickness.
Journal of Aviation Psychology, 07:203–220.
Lanman, D., Hirsch, M., Kim, Y., and Raskar, R. (2010).
Content-adaptive Parallax Barriers: Optimizing Dual-
layer 3D Displays Using Low-rank Light Field Fac-
torization. ACM Trans. Graph., 29(6):163:1–163:10.
Malaterre, G. (1995). Comparisons between simulation and
actual driving situations: Some experiments. Proceed-
ings of Driving Simulation Conference, 2:60–76.
Monin, C. (2004). TRUST3000: The truck simulator for ad-
vanced continuous professional training. Proceedings
of Driving Simulation Conference, 8:389–399.
Perlin, K., Paxia, S., and Kollin, J. S. (2000). An Au-
tostereoscopic Display. Proceedings of the annual
conference on Computer graphics and interactive
techniques, 27:319–326.
GRAPP 2016 - International Conference on Computer Graphics Theory and Applications
290

Peterka, T., Kooima, R. L., Girado, J. I., Ge, J., Sandin,
D. J., and A., D. T. (2007). Evolution of the Varrier
Autostereoscopic VR Display: 2001–2007. Stereo-
scopic Displays and Virtual Reality Systems, 14:1–11.
Pinto, M., Cavallo, V., and Ohlmann, T. (2008). The devel-
opment of driving simulators: toward a multisensory
solution. Le travail humain, 71:62–95.
Rogé, J., Pebayle, T., and Muzet, A. (2001). Variations of
the level of vigilance and of behavioral activities dur-
ing simulated automobile driving. Accident Analysis
and Prevention, 33:181–186.
Sandin, D. J., Margolis, T., Dawe, G., Leigh, J., and A.,
D. T. (2001). The Varrier Auto-Stereographic Dis-
play. Stereoscopic Displays and Virtual Reality Sys-
tems, 8:1–8.
Wetzstein, G., Lanman, D., Hirsch, M., and Raskar, R.
(2012). Tensor displays: Compressive light field syn-
thesis using multilayer displays with directional back-
lighting. ACM Trans. Graph., 31(4):1–11.
Wetzstein, G., Lanman, D., W., H., and R., R.
(2011). Layered 3D: Tomographic image synthesis for
attenuation-based light field and high dynamic range
displays. ACM Trans. Graph., 30(4):95:1–95:12.
Building a Driving Simulator with Parallax Barrier Displays
291
