
Blood Products Inventory Pickup and Delivery Problem under Time
Windows Constraints
Imane Hssini
1
, Nadine Meskens
1
and Fouad Riane
2
1
Louvain School of Management, Catholic University of Louvain, Mons, Belgium
2
Ecole Centrale Casablanca, Casablanca, Morocco
Keywords: Blood Products, Perishable Products, Inventory Routing, Pickup and Delivery, Multi-products, Time
Windows.
Abstract: The inventory pickup and delivery problem with time windows (IPDPTW) addressed in this paper is a
variant of the well known inventory routing problem (IRP). It consists in combining the inventory
management problem and the problem of delivery and collection under the constraints of time window. In
our study, we apply this approach to model a blood products distribution system over a certain horizon. The
objective is to determine for each period of the planning horizon, the quantities of products to deliver and
collect as well as the routing to be performed by each vehicle in order to minimize the total transportation
and storage cost without allowing shortages. We present a brief review of literature related to our problem
and we provide a mathematical model that takes into account the constraint of perishability.
1 INTRODUCTION
Blood is a critical commodity for human race. The
demand for blood products is stochastic while the
supply is irregular. The management in such context
consists on matching supply and demand in an
efficient manner. This task becomes complicated
when one considers the fact that blood products are
perishable. Shortages can cause increase mortality
rates while outdates products are not accepted
(Beliën and Forcé, 2012).
An efficient manner to handle the problem of
concern is to integrate the all supply chain processes.
In this context, the Inventory Routing Problem (IRP)
method can achieve this purpose by managing
simultaneously the distribution and the storage.
Indeed, the IRP objective is to determine the optimal
distribution circuit according to the topology
adopted: from a central warehouse to a set of clients
("one to many" typology) or to a single customer
("one to one" typology), or from several warehouses
to a single client ("many to one"), or from several
warehouses to several customers (" many to many").
This circuit (or these circuits) must jointly optimize
the costs of transportation and storage without
causing any shortage. It thus consists to answer three
questions: when each customer should be supplied?
How much should we deliver to each customer
every visit? And which route(s) should be used?
The IRP problem has been addressed by different
authors in several studies. We cite among them the
work of (Coelho et al., 2014) and (Bertazzi and
Speranza, 2012). They have featured very interesting
literature reviews where they classified the IRP
according to several variants such as:
The nature of demand: deterministic or
stochastic.
The planning horizon: Finite or infinite.
The size of the fleet: A single vehicle, multiple
or unconstrained.
The nature of the fleet: Homogeneous or
Heterogeneous.
The routing: direct or multiple.
The inventory decision: nonnegative, back-
orders or lost sales.
The number and the type of products: one or
multi-products, homogeneous or heterogeneous.
Periodicity: one or multi-periods.
In addition to the variants mentioned above, the
formulation of an IRP problem requires the
definition of an objective function. Generally the
aim of this function is to minimize simultaneously
the inventory and the transportation costs. Since the
IRP problem is an extension of vehicle routing
problem (VRP), it is considered as NP-hard problem
(Coelho et al., 2014).
Hssini, I., Meskens, N. and Riane, F.
Blood Products Inventory Pickup and Delivery Problem under Time Windows Constraints.
DOI: 10.5220/0005705503490356
In Proceedings of 5th the International Conference on Operations Research and Enterprise Systems (ICORES 2016), pages 349-356
ISBN: 978-989-758-171-7
Copyright
c
2016 by SCITEPRESS – Science and Technology Publications, Lda. All rights reserved
349
In our research, we aim at optimizing the supply
chain of blood products by ensuring the availability
of the right product in the right quantity at the right
time while reducing the inventory and transport
costs. This study will focus on the Belgian blood
supply chain.
For the French-speaking part of Belgium, the
management of the supply chain of blood is at 95%
guaranteed by the Red Cross (Croix Rouge, 2012).
This ensures the smooth running of the blood
collection process from blood donation until the
delivery of various blood products to hospitals,
passing through storage.
The blood service of the Red Cross is responsible
for the organization and the planning of blood
collection which is done in fixed collection sites and
also through mobile collection ‘bloodmobiles’.
Every day, the Red Cross distribution service
organizes shuttles to pick up the blood bags
collected at blood centers and route them to the Red
Cross blood central service (central and unique
geographical location) where they will be
decomposed, qualified biologically and then stored
in the form of three perishable products called blood
products (plasma, red cells, platelets) before being
distributed. Theses shuttles carry also the bags of
plasma and platelets collected by Apheresis in order
to be qualified biologically and then stored before
being distributed. The Apheresis is a blood sampling
technique for taking a single blood component
(plasma, platelets, red blood cells) using a cell
separator
Thus, during an apheresis donation, the
required component is collected in a sample bag, and
other components are returned to the donor.
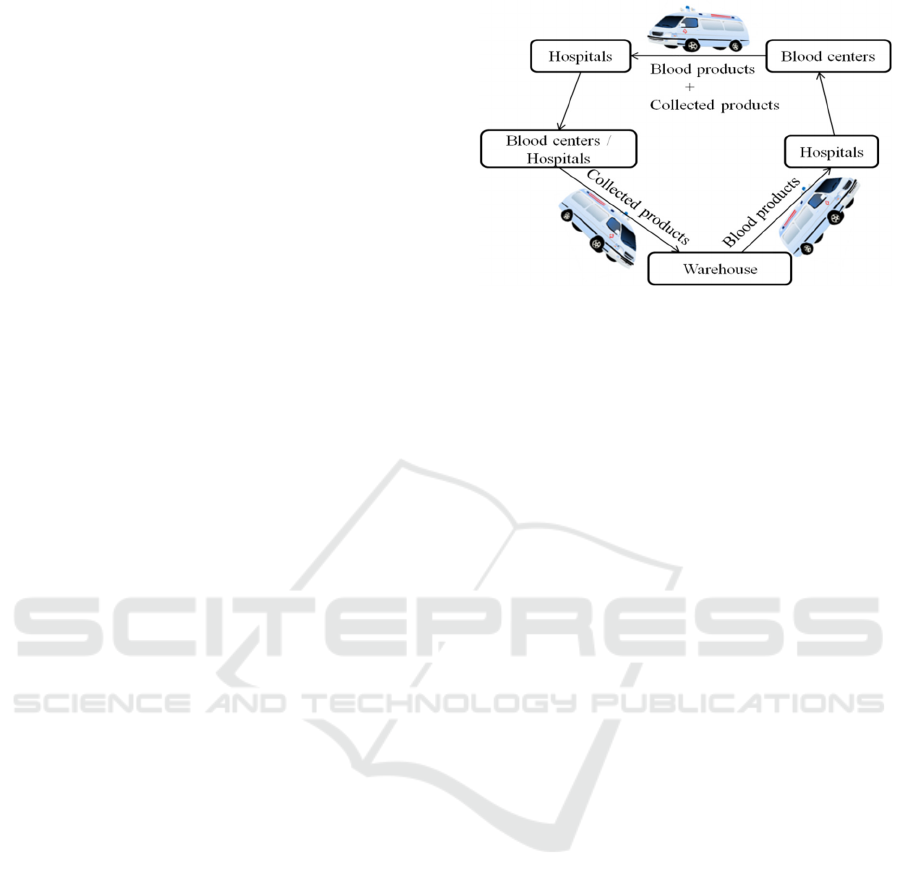
Due to the heterogeneity of these products in
terms of shelf life and storage temperature, the
conditions of storage and distribution must be
appropriate to each product. The blood service uses
the same vehicle (with limited capacity) pick up the
collected products (Whole blood, non qualified
plasma and platelets) from the blood centers and at
the same time to deliver the blood products to
hospitals (figure 1).
The hospitals served by the Red Cross are
divided into four regions (clusters), each hospital has
a time window during which it should be visited and
has a frequency of visits that is based on its
consumption.
The plasma is transported separately from other
products, as it is distributed in a frozen state and
under a temperature of -25 ° C. Therefore, a specific
vehicle should be used to transport this product. Our
study will then cover only the distribution of
platelets and red blood cells.
Figure 1: The route for Pickup and Delivery of blood
products.
The stochastic nature of the demand, either in the
number of patients who need blood products or in
number of blood units required by each patient, may
imply shortages which are not authorized because
blood products are vital.
To improve the performance of blood products
distribution process, it is necessary to optimize both
the inventory management problem and the vehicle
routing problem with pickup and delivery and time
windows (VRPPDTW). This problem is referred to
as an inventory pickup and delivery problem with
time windows (IPDPTW).
Furthermore, in the VRPPDTW, the vehicles
must ensure during the same tour a dual service:
pickup and delivery of products to customers during
specific periods of time called time windows. This
temporal constraint can be divided into two types:
tight time windows and wide time windows.
In the case of the tight time windows, the
customer cannot be visited outside the time window
i.e. if a vehicle arrives to customer location before
the start of the time window, then it must wait until
the beginning of the time window to deliver, and if it
arrives late (after the end of the time window), it
cannot serve the customer. While in the case of the
wide windows, the time windows cannot be
respected: the customer can be visited outside the
time window; however, the penalties can be applied
to the supplier. In this paper, we study the IPDPTW
problem as part of a two stage blood product supply
chain (a single supplier with multiple hospitals and
blood centers). In reality, the demand of blood
products is stochastic; however, to simplify our
model we assume that the demand is deterministic.
Referring to the classification of the IRP problem
presented by (Coelho et al., 2014), the problem of
concern is a deterministic, multi-period, multi-
product, multi-vehicle, multi-routing problem over
finite planning horizon.
ICORES 2016 - 5th International Conference on Operations Research and Enterprise Systems
350

The objective function is the minimization of the
inventory and the transportation costs. This paper is
organized as follows. We start reviewing related
studies encountered in the literature. We then
suggest a mathematical formulation for the problem
that we solved to optimality for small size instances.
We finally analyze the relevant computational results.
2 RELATED LITERATURE
During the last two decades, the literature on the IRP
problem has increased exponentially. Despite the
abundant literature on the IRP problem, we did not
find any papers that address the problem of
Inventory Pickup and Delivery Problem with Time
Windows for Perishable Products (IPDPTWPP). To
this end, we have introduced in this state of the art
the articles dealing the IRP problem applied to
perishable products since blood products share this
relevant characteristic.
Indeed, the IRP problem researches related to
perishable products are very rare. Of these, we
include those performed by (Federgruen et al.,
1986) ; (Coelho and Laporte, 2014) ; (Jia et al.,
2014) ; (Chen and Lin, 2009) ; (Hemmelmayr et al.,
2010) ; (Hemmelmayr et al., 2009); (Rusdiansyah
and Tsao, 2005) ; (Zanoni and Zavanella, 2007) ;
(Le et al., 2013) ; (Niakan and Rahimi, 2015) ;
(Mirzaei and Seifi, 2015) ; (Diabat et al., 2014);
(Soysal et al., 2015); (Al Shamsi et al., 2014);
(Kande et al., 2014).
Among the researchers interested in the IRP
problem with a single perishable product we quote:
(Coelho and Laporte, 2014) ; (Hemmelmayr et al.,
2009); (Rusdiansyah and Tsao, 2005) ; (Diabat et al.,
2014); (Soysal et al., 2015); (Jia et al., 2014). Each
of them analyzed the problem in a different way
according to the used variants (number and nature of
product, nature of demand, size of fleet...) or the
proposed solution. For example, (Rusdiansyah and
Tsao, 2005) ; (Diabat et al., 2014); (Jia et al.,
2014); (Mirzaei and Seifi, 2015) have studied the
IRP problem in the case of a deterministic demand,
others such as (Soysal et al., 2015); (Coelho and
Laporte, 2014) are interested in the case of a
stochastic demand. In these articles, the authors
have used several homogeneous vehicles to transport
products; they targeted the minimization of costs
(transport, storage and shortages) as the main
objective function. In the case of multiple perishable
products, (Al Shamsi et al., 2014); (Zanoni and
Zavanella, 2007) ; (Le et al., 2013) studied the IRP
with deterministic demand. In addition to the
multiplicity of products, the stochasticity of demand
was considered by researchers as (Federgruen et al.,
1986) ; (Chen and Lin, 2009); (Hemmelmayr et al.,
2010) and (Niakan and Rahimi, 2015).
Blood products have been the subject of some
works such as those of (Federgruen et al., 1986) ;
(Hemmelmayr et al., 2010) ; (Hemmelmayr et al.,
2009). Indeed, (Hemmelmayr et al., 2009) studied
the impact of the adoption of the VMI policy by the
Austrian Red Cross blood service. The objective of
this study was to minimize the distribution cost.
They have developed a flexible vehicle routing
system to deliver one blood product with
deterministic demand. This study has been extended
by (Hemmelmayr et al., 2010) to cover the case of
several blood products with a stochastic demand.
Certainly the optimization of inventory
management and distribution of blood products is
complex given the perishable nature of these
products and their heterogeneity. In fact, each blood
product has its own shelf life, storage temperature,
temperature to be maintained during transport,
storage conditions: in the case of blood platelets
(must be stored under continuous agitation), so each
product should be stored separately from other
products and transported separately in insulated
containers. All these constraints further complicate
the management of the distribution process and
storage of blood products.
According to this state of art we noticed that the
articles on the IRP problem applied to perishable
products are few in number especially in the case of
blood products (three papers), and, the only paper
that has searched the almost similar characteristics to
ours is that of (Niakan and Rahimi, 2015). However,
our research is distinguished by taking into account
constraints such as the respect time windows and
treatment of problems of delivery and pickup at the
same time. To our knowledge no research has
focused on optimizing inventory management
problems of perishable products and vehicle routing
problems with pickup and delivery with time
window simultaneously. In the following, we
present the mathematical model.
3 PROBLEM DESCRIPTION
In our problem, a single warehouse receives from
the laboratory during each period three
heterogeneous perishable products (red cells, plasma
and platelets) (indexed ∈ each with a quantity
N
rt
. Each product has an age a
rt
at period t. In this
study, we will be limited to the case of distribution
Blood Products Inventory Pickup and Delivery Problem under Time Windows Constraints
351
of platelets and red blood cells seen as plasma are
distributed separately from the other blood
components. The warehouse uses a fleet of
heterogeneous vehicles V (indexed byv ∈ V), with
a charge capacity Cap
v
of insulated containers K and
a travel cost per km of CT
v
to distribute these
products to a set of geographically dispersed
hospitals denoted H (indexed by i or j Є H) and at
the same time to collect the bags of whole blood and
plasma and platelets (indexed r’ Є P’) collected in
blood centers and which are not yet qualified
biologically. The quantity of qualified products is
Z
r’t
. In the following we present the parameters, the
sets and the decision variables that are used:
Table 1: The used sets.
H
The set of hospitals
H
+
The set of hospitals plus the warehouse (0 for
warehouse, 1 and higher for hospitals).
B
c
The set of blood centers
HB
c
The set of blood centers plus hospitals (= H+B
c
)
HB
c
+
The set HB
c
plus the warehouse (= H
+
+ B
c
)
P
The set of blood products (delivered products)
P’
The set of collected products
Table 2: The used parameters.
c
Consumption rate of each product r whose age a
rt
(at
period t) at each hospital during each period time t
C
ir
The capacity of storage at each hospital i for each
product r
Cc
r’
The capacity of storage at the warehouse for each
collected product collected r’
I
The inventory level of the product r whose age a
rt
(at pe-
riod t) at each location j Є H
+
by the beginning of period t
IC
0
r’t
The initial inventory of collected products r’ at the
warehouse at each period
N
rt
The quantity produced of products r at period t
Z
r’t
The quantity of qualified products r’ at period t
Ic
r’t
The final inventory of collected product r’ at the
warehouse in period t
Cap
v
The capacity of vehicle v
a
rt
The age of product r at period t (in days)
s
lr
The shelf life of product r (in days)
k
r
The insulated container of delivered product r
k
r’
The insulated container of collected product r’
Dist
ij
The distance between locations i,j Є HB
c
+
(in Km)
φ
ij
The travel time between locations i,j Є HB
c
+
(in hours)
b
i
start of time window for location i Є HB
c
e
i
end of time window for location i Є HB
c
CS
rjt
The holding cost of product r at location j Є H
+
at
period t
CT
v
Travel cost per Km
τ
t
Total working hours per driver per each period t
M
A big number
Table 3: The decision variables.
Q
The quantity of product r whose age a
rt
(at period t)
delivered to hospital i Є H by vehicle v Є V in
period t∈T
CP
The quantity of product r’ collected from blood
center z Є B
c
by vehicle v Є V in period t∈T
O
rjt
The amount of outdated product r at location j Є H
+
during the period t
I
rjt
sl
r
+1
The inventory level of product r whose age sl
r
+1 at
location j Є H
+
by the end of period t
I
The inventory level of product r whose age a
rt
(at
period t) at location j Є H
+
by the end of period t
x
A binary variable set to 1 if location j is visited
immediately after location i by vehicle v at each
period t, 0 otherwise
q
Total quantity of product r whose age a
rt
(at period
t) transported in insulated container k
r
in vehicle v
from a location i∈ HB
c
+
to location j∈ HB
c
+
at
period t
qc
′
Total quantity of product r’ transported in insulated
container k
r’
in vehicle v from a location i∈ HB
c
+
(HB
c
+
= H
+
+ B
c
) to location j∈ HB
c
+
at period t
y
A binary variable set to 1 if vehicle v visits location
i Є HB
c
at period t, 0 otherwise
s
The arriving time of vehicle v at hospital i at period
t
Some assumptions are made in this study:
Each tour must begin and end at the warehouse
and each hospital and blood center must be
served by a single vehicle.
The storage capacity at each hospital cannot be
exceeded.
Given that the products concerned are perishable
products, we assume that each product r is
delivered only if its age a
rt
is less than or equal to
its shelf life sl
r
, thus any outdated product is no
longer appearing in the inventory and it cannot
be used to satisfy the demand.
Also we assume that no stock-out is allowed.
Since each blood product has its own conditions
of conservation, each product is transported
in insulated container k
r
Є K separately from
other products. We assume that all insulated
containers k
r
and k
r’
have the same size.
The model is:
Min CT
v
*Dist
ij
*x
ijt
v
v t
HB
c
+
j=i+1
HB
c
+
-1
i=0
+
CS
rjt
*I
rjt
a
rt
r ta
rt
≤ sl
r
H
j
(1)
ICORES 2016 - 5th International Conference on Operations Research and Enterprise Systems
352

Subject to:
x
ijt
v
i Є HB
c
+
i ≠ j
≤1 ∀ j Є HB
c
+
, v Є V , t Є T
(2)
y
it
v
vЄ V
≤1 ∀ i Є HB
c
, t Є T
(3)
x
ijt
v
i ЄHB
c
+
i ≠ j
- x
jmt
v
m ЄHB
c
+
m ≠ j
=0
∀ j Є HB
c
, v Є V , t Є T
(4)
q
ijrk
r
t
a
rt
v
i ЄH
+
i ≠ j
- q
jmrk
r
t
a
rt
v
=
m ЄH
+
m ≠ j
Q
jr t
a
rt
v
∀jЄH,∀k
ЄK,
∀a
sl
, v Є V , r Є P, t Є T
(5)
qc
ji r'k
r'
t
v
iЄHB
c
i≠j
- qc
mjr'k
r'
t
v
=
mЄHB
c
m≠j
CP
r'jt
v
∀jЄB
,∀
k
Є
K
,
v
ЄV,r
ЄP
,tЄT
(6)
qc
′
′
′
Є
q
Є
Cap
∗x
∀i,jЄHB
,rЄP,r
ЄP
,
v
ЄV,tЄT
(7)
b
∗y
s
e
∗y
∀iЄHB
,
v
ЄV,tЄT
(8)
s
φ
s
M1x
∀i,jЄHB
,ij,
v
ЄV,tЄT
(9)
x
ijt
v
HB
c
+
j
HB
c
+
-1
i
* φ
ij
≤ τ
t
∀ vЄ V ,
t
Є T
(10)
I
rjt
0a
rt
a
r
≤ sl
r
+ Q
jrt
a
rt
v
a
r
≤ sl
r
≤C
jr
∀ jЄ H ,∀ vЄ V,
r
Є P ,
t
Є T
(11)
IC
r't
0
+ CP
r'jt
v
≤Cc
r’
∀
jЄB
,
∀
v
ЄV,r
ЄP
,tЄT
(12)
O
rjt
= I
rjt
sl
r
+1
∀ j Є H
+
,rЄ P , tЄ T
(13)
I
rjt
0a
rt
=I
rjt-1
a
rt-1
- O
rjt-1
∀
j Є H
+
, a
rt
≤ sl
r
,rЄ P , tЄ T
(14)
I
rjt
a
rt
=I
rjt-1
a
rt-1
+ Q
jrt
a
rt
-c
rjt
a
rt
∀
jЄ H,
∀
vЄ V, a
rt
≤ sl
r
, rЄ P ,tЄ T
(15)
I
r0t
a
rt
=I
r0t-1
a
rt-1
+ N
rt
- Q
jrt
a
rt
v
jЄ H
∀
v Є V, a
rt
≤ sl
r
,
r
Є P ,
t
Є T
(16)
Ic
r't
=Ic
r't-1
+ CP
r'jt
v
-Z
r't
∀
j Є B
c
,
∀
v Є V, r'Є P',
t
Є T
(17)
x
ijt
v
HB
c
+
i
= y
jt
v
∀
j Є HB
c
,i ≠ j ,
∀
v Є V,
t
Є T
(18)
y
it
v
, x
ijt
v
Є
0,1
∀ i , j Є HB
c
+
, i ≠ j , ∀ vЄ V, tЄ T
(19)
CP
r'zt
v
; Q
jrt
a
rt
v
; I
rjt
a
rt
; I
rjt
0a
rt
≥ 0
∀ i,jЄ H
+
, i≠j , ∀ vЄ V, ∀a
rt
≤ sl
r
,
r Є P, r
'
Є P
'
, z ЄB
c
, tЄ T
(20)
Objective function of the proposed model is defined
by (1), it includes the total transportation cost and
the total inventory holding cost at the end of each
period. Constraints (2) ensure that each location
(hospital or blood center) is visited at most once in
period t. Constraints (3) define that each location
(hospital or blood center) can be visited by one
vehicle maximum per period. Constraints (4) ensure
the continuity of a tour, so that if a vehicle arrives at
a location (hospital or blood center), it must leave
after it has served it to a next location or to the
warehouse. Constraints (5) determine the quantity of
delivered product r Є P to a hospital and eliminate
sub-tours. Constraints (6) determine the quantity of
collected product r’ Є P’ from a blood center and
also eliminate sub-tours. Constraints (7) ensure that
the quantity transported is less than or equal to the
Blood Products Inventory Pickup and Delivery Problem under Time Windows Constraints
353
vehicle’s capacity. Vehicles arriving time at location
(hospital or blood center) must be in given time
windows for each location (hospital or blood center),
constraints (8) ensure that these time windows are
respected for each location (hospital or blood center)
and constraints (9) define the time arriving.
Constraints (10) ensure that the total travel time of a
vehicle should not exceed the planned total working
hours in period. Constraints (11) ensure the respect
of storage capacity at each hospital. Constraints (12)
ensure the respect of storage capacity of collected
product at the warehouse. Constraints (13) define the
amount of outdated product. Constraints (14) ensure
that the inventory at the beginning of a period is
equal to the inventory at the end of the previous
period minus the quantity of outdated products
during this period. Constraints (15), (16) and (17)
define the inventory conservation conditions for the
warehouse and the hospitals. Constraints (18)
indicate that a vehicle cannot be used to serve any
hospital or blood center unless it is selected.
Constraints (19) and (20) require that inventory
levels at hospitals and warehouse, quantity of
products delivered to hospitals, and quantity of
products collected from blood centers are non-
negative and define the binary nature of decision
variables.
4 COMPUTATIONAL RESULTS
In order to validate the proposed mathematical
model we tested it on small size fictitious instances.
We have randomly generated seven test instances
with the following parameters: one warehouse
delivers two products to a set of hospitals, varying
from 3 to 14 and picks up three products from a set
of blood centers
,
varying from 2 to 4, two
heterogeneous vehicles are used. The capacity of
each vehicle is [Cap
v1
=60, Cap
v2
=140]; Hospital
consumption by product is integer value randomly
generated within the interval [1, 90]. We consider a
planning horizon of three days (T=3). The travel
distance between locations i and j is given in
kilometer. The inventory level at location i Є H
+
at
the beginning of planning horizon is randomly
generated as an integer between [7, 65]; the
inventory level of each collected product at the
warehouse at the beginning of planning horizon is
randomly generated as an integer between [2, 40];
the maximum working hours is set to 8 hours per
day (b
i
=0 min, e
i
=480 min); The big number in
constraints is set to M=100, the travel cost is 1.2
euros per km and the storage cost at each location
i Є H
+
is [r
1
=20, r
2
=10] in euro. The IPDPTWPP
was tested by the Cplex 12.5 on the Intel(R)
Core(TM) i5-2450M CPU 2.50 GHz with 4 GB
RAM.
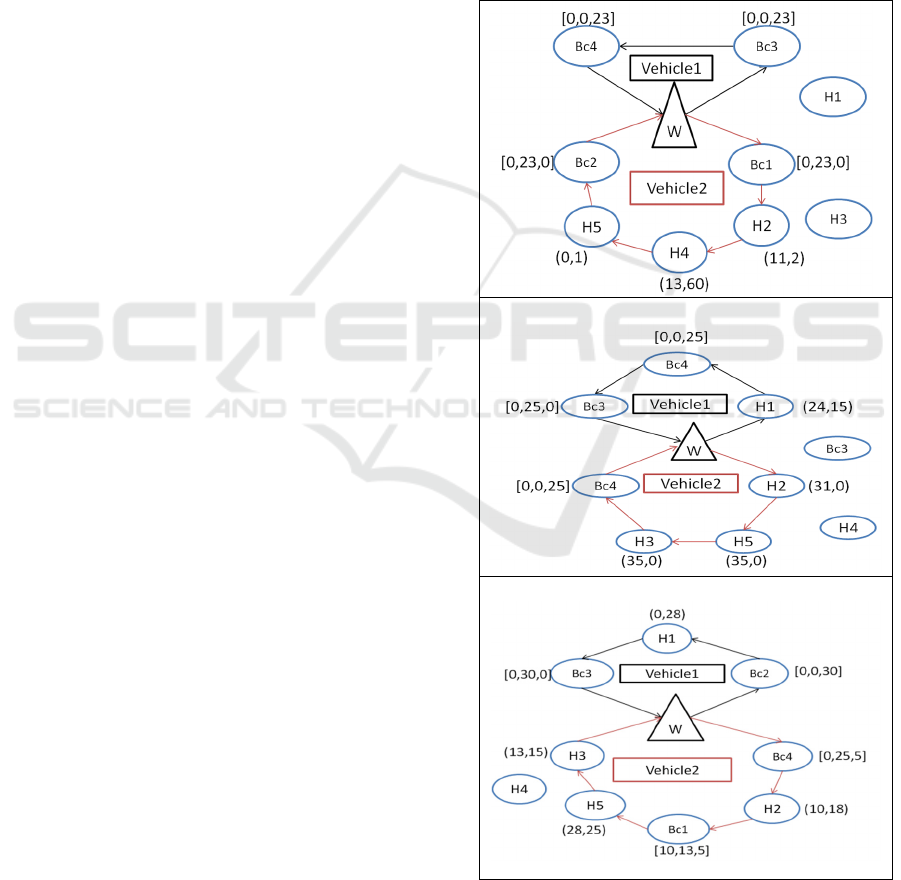
The results for the seven test instances are
presented in Table 4. The table indicates the
objective function values, the transportation cost, the
storage cost and the CPU computing time. Given the
small size of the first four instances, we have chosen
to present the delivery routes, the quantities of
products (
1
,
2
) to be delivered and of products
[
1
′
,
2
′
,
3
′
] to be collected during the fifth instance
(figure 2).
t=1
t=2
t=3
Figure 2: Delivery routes in each day for the instance5.
ICORES 2016 - 5th International Conference on Operations Research and Enterprise Systems
354
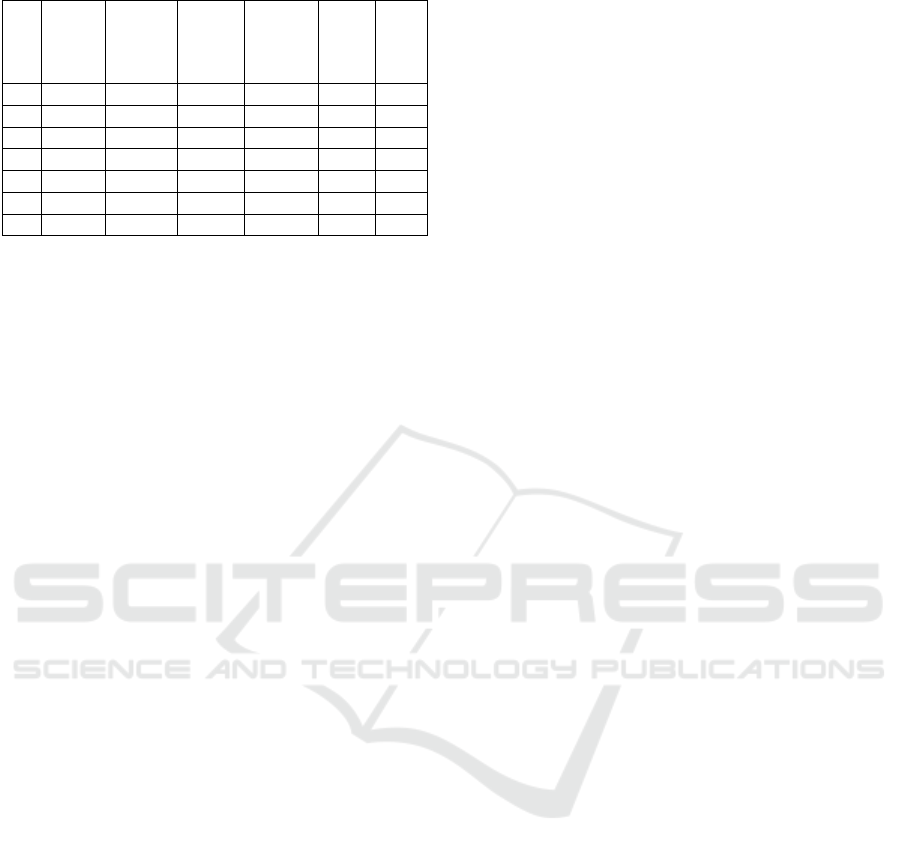
Table 4: Results for the seven test instances.
Inst Nb of
blood
centers
Nb of
hospitals
Storage
cost
(in €)
Transport
cost
(in €)
Total
cost
(in €)
CPU
time
(in
sec)
1 2 3 9190 1944 11134 2.90
2 2 5 8860 2693 11553 2.37
3 2 7 9080 4490 13570 12.06
4 4 3 9080 2208 11288 3.24
5 4 5 7570 2952 10522 14.26
6 4 7 9470 5054 14524
3
8.41
7 4 14 17470 5611 23081 900
The obtained results show that by increasing the
number of hospitals, the distribution cost increases.
This can be explained by the fact that by increasing
the number of the served hospitals, the distance
traveled during the deliveries increases, and
consequently the related cost also increases. As for
the change in the storage cost, it is considered as a
consequence of the variation in the final level of
stock in the warehouse and in the hospitals. This is
due to the variation in the level of consumption from
one period to another. Also, it should be noted that
for very small size instances, the model presented in
Section 3 can be solved by using Cplex solver in
very small CPU time.
However, the instance 7 cannot be solved in
maximum allowed CPU time of 900 sec. This
implies that the resolution of the presented model is
affected by any change in instance input parameters.
Additionally, CPU time for solving the small
instances shows that the instances of realistic sizes
cannot be solved to optimality in a reasonable time.
5 CONCLUSIONS
In this paper, we have modeled the optimization
problem of the blood products supply chain as an
IPDPTWPP problem with the objective of
determining the quantities to be delivered and
collected and fixing the optimal routes while
respecting the constraints of storage and
transportation related to the perishable nature of the
products as well as the time windows during which
each location must be visited. The studied products
are heterogeneous and perishable, each with its own
characteristics in terms of shelf life and storage
conditions. Hence, the need to respect some
constraints in the storage and distribution such as the
separation of products and delivery in specific
insulated containers. Also, no shortage will be
permitted because of the criticality of these products.
We conducted an experimental analysis of the model
on seven instances of small size. Since the IRP
problem is NP-difficult, we are now looking for a
heuristic approach to solve this problem for real life
instances of realistic sizes. Also we plan include
additional constraints such as the possibility to visit
hospitals more than once per period and the
stochastic nature of the demand.
REFERENCES
Al Shamsi, A., Al Raisi, A., Aftab, M. 2014. Pollution-
Inventory Routing Problem With Perishable Goods.
In: Golinska, P. (Ed.) Logistics Operations, Supply
Chain Management And Sustainability. Springer
International Publishing.
Beliën, J., Forcé, H. 2012. Supply Chain Management Of
Blood Products: A Literature Review. European
Journal Of Operational Research, 217, 1-16.
Bertazzi, L., Speranza, M. G. 2012. Inventory Routing
Problems: An Introduction. Euro Journal On
Transportation And Logistics, 1, 307-326.
Chen, Y. M., Lin, C.-T. 2009. A Coordinated Approach
To Hedge The Risks In Stochastic Inventory-Routing
Problem. Computers & Industrial Engineering, 56,
1095-1112.
Coelho, L. C., Cordeau, J.-F., Laporte, G. 2014. Thirty
Years Of Inventory Routing. Transportation Science,
48, 1-19.
Coelho, L. C., Laporte, G. 2014. Optimal Joint
Replenishment, Delivery And Inventory Management
Policies For Perishable Products. Computers &
Operations Research, 47, 42-52.
Croix Rouge 2012. Rapport Annuel. 1-25.
Diabat, A., Abdallah, T., Le, T. 2014. A Hybrid Tabu
Search Based Heuristic For The Periodic Distribution
Inventory Problem With Perishable Goods. Annals Of
Operations Research, 1-26.
Federgruen, A., Prastacos, G., Zipkin, P. 1986. An
Allocation And Distribution Model For Perishable
Products. Operations Research, 34, 75-82.
Hemmelmayr, V., Doerner, K., Hartl, R., Savelsbergh, M.
P. 2009. Delivery Strategies For Blood Products
Supplies. Or Spectrum, 31, 707-725.
Hemmelmayr, V., Doerner, K. F., Hartl, R. F.,
Savelsbergh, M. W. P. 2010. Vendor Managed
Inventory For Environments With Stochastic Product
Usage. European Journal Of Operational Research,
202, 686-695.
Jia, T., Li, X., Wang, N., Li, R. 2014. Integrated Inventory
Routing Problem With Quality Time Windows And
Loading Cost For Deteriorating Items Under Discrete
Time. Hindawi Publishing Corporation, Mathematical
Problems In Engineering, 2014, 1-14.
Kande, S., Prins, C., Belgacem, L. 2014. Modèle Linéaire
Mixte Et Heuristique Randomisée Pour Un Réseau De
Distribution A Deux Echelons Pour Des Produits
Périssables. Roadef - 15ème Congrès Annuel De La
Blood Products Inventory Pickup and Delivery Problem under Time Windows Constraints
355

Société Française De Recherche Opérationnelle Et
D'aide A La Décision, 1-22.
Le, T., Diabat, A., Richard, J.-P., Yih, Y. 2013. A Column
Generation-Based Heuristic Algorithm For An
Inventory Routing Problem With Perishable Goods.
Optimization Letters, 7, 1481-1502.
Mirzaei, S., Seifi, A. 2015. Considering Lost Sale In
Inventory Routing Problems For Perishable Goods.
Computers & Industrial Engineering, 87, 213-227.
Niakan, F., Rahimi, M. 2015. A Multi-Objective
Healthcare Inventory Routing Problem; A Fuzzy
Possibilistic Approach. Transportation Research Part
E: Logistics And Transportation Review, 80, 74-94.
Rusdiansyah, A., Tsao, D.-B. 2005. An Integrated Model
Of The Periodic Delivery Problems For Vending-
Machine Supply Chains. Journal Of Food
Engineering, 70, 421-434.
Soysal, M., Bloemhof-Ruwaard, J. M., Haijema, R., Van
Der Vorst, J. G. A. J. 2015. Modeling An Inventory
Routing Problem For Perishable Products With
Environmental Considerations And Demand
Uncertainty. International Journal Of Production
Economics, 164, 118-133.
Zanoni, S., Zavanella, L. 2007. Single-Vendor Single-
Buyer With Integrated Transport-Inventory System:
Models And Heuristics In The Case Of Perishable
Goods. Computers & Industrial Engineering, 52, 107-
123.
ICORES 2016 - 5th International Conference on Operations Research and Enterprise Systems
356
