
Indoor Positioning: A Comparison of WiFi and Bluetooth Low Energy
for Region Monitoring
Alexander Lindemann, Bettina Schnor, Jan Sohre and Petra Vogel
Department of Computer Science, University of Potsdam, August-Bebel Str. 89, Potsdam, Germany
Keywords:
Assistive Technology, Indoor Positioning, Bluetooth Low Energy.
Abstract:
Mobile devices like smartphones equipped with several sensors make indoor positioning possible at low costs.
This enables location based services, like mobile marketing, navigation, and assistive technologies in health-
care. In case of supporting disoriented people, the exact position of the person has not to be known, but it is
sufficient to inform a caretaker when the attended person enters a critical region. This is the so-called region
monitoring approach. The paper presents results from region monitoring implemented as an app for Android
smartphones using WiFi and the low power protocol Bluetooth Low Energy respectively. Both networks are
compared regarding accuracy and the power consumption on the mobile device.
1 INTRODUCTION
With their widespread use, smartphones get interest-
ing for indoor positioning in the context of assistive
technologies. Thereby, disoriented people like de-
mented people or people suffering from amnesia can
be supported in their daily living. In case of demented
people living in a house for elderlies, the patient, or a
device like a wheelchair, is equipped with a smart-
phone. The smartphone periodically checks whether
the person is still in a safe environment. In case the
person leaves the home environment and seems to get
lost, the smartphone will send an alarm message to
the mobile of the caretaker.
At Potsdam University, the Kompass system is de-
veloped which investigates Ambient Assistive Living
(AAL) technologies for the support of elderlies (Fu-
dickar et al., 2011). The Kompass system uses smart-
phones for fall detection and adds localization infor-
mation to the alarm message when a fall with uncon-
sciousness is detected (Gimpel et al., 2015).
Further, indoor positioning is used for mobile
marketing application and indoor navigation within
complex buildings, like airports.
In our use case the need for accuracy is low com-
pared with mobile marketing applications, where the
application needs to know exactly in front of which
product the user is currently standing, or compared
with indoor navigation. To support disoriented peo-
ple, it is sufficient to notify the caretakers in case the
user leaves the safe environment and enters a critical
region, like the corridor in front of the door.
Therefore, we proposed region-based position-
ing where the given environment is divided into re-
gions (Fudickar et al., 2011). A so-called region map
lists the beacons/routers which have to be received in
each region.
Since most buildings today have a WiFi infrastruc-
ture, this protocol was an obvious first choice for po-
sitioning and was successfully tested in the Kompass
project (Schindler, 2011; Scheffler et al., 2013; Kap-
pel, 2014).
This paper compares region-based indoor posi-
tioning using WiFi versus Bluetooth Low Energy
(BLE). The evaluation metrics are positioning cor-
rectness (percentage of correct localizations) and
power consumption of the mobile device. BLE is
available on most of modern smartphones and oper-
ates like WiFi in the 2.4 GHz license-free band. BLE
may be an interesting alternative to WiFi, since mod-
ern WiFi-routers have a feature called cell breathing
which makes accurate positioning much harder. A
WiFi-router which uses cell breathing may change its
transmit power dynamically. In case of a high num-
ber of users, the radio reduces its transmit power and
hence its cell radius is decreased. Thereby, heavily
loaded cells may hand over load to neighboring cells.
While this approach is beneficial for load distribution
and a good service quality, the dynamically changing
transmit power makes the definition of region maps
more difficult. Further, it is a serious problem for po-
sitioning algorithms which rely on Received Signal
314
Lindemann, A., Schnor, B., Sohre, J. and Vogel, P.
Indoor Positioning: A Comparison of WiFi and Bluetooth Low Energy for Region Monitoring.
DOI: 10.5220/0005704603140321
In Proceedings of the 9th International Joint Conference on Biomedical Engineering Systems and Technologies (BIOSTEC 2016) - Volume 5: HEALTHINF, pages 314-321
ISBN: 978-989-758-170-0
Copyright
c
2016 by SCITEPRESS – Science and Technology Publications, Lda. All rights reserved

Strength values.
The remainder of this article is structured as fol-
lows: The next section discusses different approaches
for wireless indoor positioning. In Section 3, related
work is discussed. The region-based indoor position-
ing algorithm and its parameters are presented in Sec-
tion 4. The results of our evaluation are given in Sec-
tion 5. Finally, the article ends with a conclusion.
2 WIRELESS INDOOR
POSITIONING
Due to the attenuation by walls and other obstacles,
a Global Navigation Satellite System (GNSS) like
GPS or Galileo is not usable for indoor positioning.
Therefore, other approaches are investigated like lo-
calization via the Received Signal Strengths (RSS)
in a wireless network. Typically, the environment
is equipped with so-called beacons which send wire-
less advertisement messages with a beacon identifier.
The smartphones are configured with the information
about the beacons and their location within the envi-
ronment. Further, the Received Signal Strength Indi-
cator (RSSI) is used to estimate the distance of the
smartphone from the beacon. This is done by com-
paring the currently received signal strengths with a
radio-propagation map which contains the expected
RSSI values. The location with the smallest error dis-
tance is estimated as current location.
A radio-propagation map is generated either by
fingerprinting or by a model-based algorithm. In case
of fingerprinting, time consuming measurements are
done in advance, since the RSSI values have to be col-
lected at every grid point. For example, in (Fudickar
and Valentin, 2014b) the influence of the grid granu-
larity between 0.5-5 m is investigated for the model-
based approach using WiFi. The finest grid size of
0.5 m shows the best results in this study. Model-
based algorithms calculate the radio-propagation map
from a formula using different parameters like sig-
nal frequency, the distance from the beacons, and the
number of walls between beacon and the position of
interest. Typically, the influence of multi-path fading
is not considered in these models. For example, the
International Telecommunication Union (ITU) pro-
posed a path-loss function for the radio frequencies
from 900 MHz up to 5.2 GHz (ITU, 2012). Free
delectable parameters in this model are the distance
power loss coefficient and the floor penetration loss
factor. The accuracy of the modeling depends on the
tuning of these parameters for the given building.
In the region-based approach, regions are defined
by a list of beacons which have to be received (posi-
tive list) or which may not be seen in the specified re-
gion (negative list). Hence RSSI values are not used
and therefore no costly calculations have to be done
to determine the position with the least error. This
approach can be combined with a threshold for the
RSSI values to exclude beacons which are only seen
sometimes due to multi-path fading for example. The
benefit of this approach compared to fingerprinting or
model-based positioning is the higher usability, since
it has the lowest setup-time - no time consuming fin-
gerprinting is necessary, nor parameter tuning like in
the case of the model-based algorithms.
The region based approach is already supported
by the iOS API since iOS 4.0 and later
1
. iOS supports
two kinds of BLE positioning, geographical region
monitoring and beacon region monitoring, where a
beacon region is an area defined by the device’s prox-
imity to Bluetooth low-energy beacons. This fits per-
fectly to our region concept. iOS also supports a
ranging API to determine the relative distance be-
tween a beacon and a device, but the programming
guide also informs about the well-known difficulties:
“Beacon ranging depends on detecting the strength of
Bluetooth low-energy radio signals, and the accuracy
of those signals is attenuated (or lessened) by walls,
doors, and other physical objects. The signals are also
affected by water, which means the human body it-
self will affect the signals. It is important to be aware
of these factors when planning your iBeacon deploy-
ment because they will impact the proximity value re-
ported by each beacon.”
3 RELATED WORK
A comparison of different indoor location systems
is given in (Fudickar and Valentin, 2014b). The
majority of the algorithms use either WiFi (Bahl
and Padmanabhan, 2000; Gansemer et al., 2010), or
the 868 MHz network typically used in sensor net-
works (Behnke and Timmermann, 2008; Fink et al.,
2010; Fudickar and Valentin, 2014a). While the
different algorithms show a good accuracy in their
specific test environments, neither the influence of
humans nor the influence of concurrent networks,
like the campus-wide WiFi, on the Received Signal
Strength (RSS) is tested.
1
iOS Developer Library, Location and Maps Program-
ming Guide
Indoor Positioning: A Comparison of WiFi and Bluetooth Low Energy for Region Monitoring
315

3.1 Fingerprinting and Model-based
Positioning
Different model-based algorithms have been inves-
tigated by Fudickar and Valentin (Fudickar and
Valentin, 2014b; Fudickar and Valentin, 2014a). The
authors investigated the influence of different parame-
ters on the accuracy of the positioning algorithm. The
parameter tuning process is described in (Fudickar
and Valentin, 2014b), while (Fudickar and Valentin,
2014a) compares the tuned algorithm for WiFi with
a model-based algorithm tuned for the radio frequen-
cies of 868 MHz which are typically used within low
power sensor networks. The authors show that the
868 MHz network is well suited for indoor position-
ing in their test environment since it was more accu-
rate than using WiFi, and extended the device run-
times from 3.39 h (WiFi) to 7.25 h (868 MHz). Since
the energy saving features of current operating sys-
tems like Android may result in even longer runtimes,
the results show the benefit of the low power network.
But on the other hand, the lack of mobile devices
equipped with this network is a hurdle.
3.2 Positioning with BLE
Bluetooth Low Energy was already evaluated for in-
door positioning in (Faragher and Harle, 2014; Jiany-
ong et al., 2014).
Fingerprinting: Faragher and Harle compare
WiFi and BLE fingerprinting (Faragher and Harle,
2014). They use 10 Hz beaconing and a sample inter-
val of 1 second on the mobile device. First, they inves-
tigated the impact of a human body on the RSS value.
The experiment shows an influence of about 10dB. In
a distance of 1 m between beacon and receiver, this
results in a poor range estimate of 5-10 m. Next, the
authors compare the two networks in a 45m by 12m
section of a building which is covered by 3 WiFi ac-
cess points and 19 BLE beacons transmitting at power
level around - 20 dBm. They report that the error dur-
ing the WiFi tracking was less than 8.5 m in 95% of
the measurements, and less than 2.6 m in 95% of the
measurements using BLE. They state that the WiFi
performance was limited by the poor signal geometry
afforded by the existing WiFi infrastructure available
in the laboratory, and the higher BLE beacon density
on the other hand. While these results are promising,
the influence of human bodies on the positioning ac-
curacy is not further investigated in the tracking test.
Further, the power consumption was not in their fo-
cus.
Model-Based: Jianyong et al. present results from
a model-based positioning system using BLE (Jiany-
ong et al., 2014). They evaluated their algorithms in
a very simple scenario where one room was equipped
with one beacon in each corner without any obstacles.
Under this laboratory conditions, they achieved an er-
ror less than 2 meters in about 96% of their test cases.
Again, the power consumption was not investigated.
3.3 Power Consumption
In (Dementyev et al., 2013), the power consump-
tion of the three low-power protocols, Bluetooth Low
Energy, ZigBee and the proprietary ANT network,
is compared in a cyclic sleep scenario. All three
wireless networks operate in the 2.4-GHz-ISM-band.
In the cyclic sleep scenario, Bluetooth Low Energy
achieves the lowest power consumption (10.1 µA),
compared with ZigBee (15.7 µA) and ANT (18.2 µA)
on the mobile device. Since the energy consumption
of sending and receiving messages is more or less the
same, we expect a similar behavior for the location
scenario, where the mobile device periodically gets
into the listening mode. Therefore, BLE seems to be
the most suited test candidate from these low-power
protocols.
4 USING BLUETOOTH LOW
ENERGY FOR INDOOR
POSITIONING
Several BLE beacons have to be deployed within the
environment. A tracked person is equipped with a
smartphone which scans periodically for advertising
messages from the beacons and identifies each beacon
by its signature (Major/Minor/UUID). The Scan Time
is also a parameter which has to be optimized. Since
sending and receiving messages is a dominant factor
in the power consumption, the Scan Time should be
set as short as possible.
Typically, a beacon can operate in different
modes:
• Advertising Interval: time between 2 beacon ad-
vertising broadcasts. Depending on the hardware,
this time can be configured in the range from 50-
2000 ms.
A short Advertising Interval results in a higher
power consumption of the beacon, but increases
the probability to receive advertising messages
during the Scan Time of the device.
• Transmit Power: is the physical power of the
transmitted signals.
Again, the Transmit Power is relevant for the
power consumption of the beacon. A higher
HEALTHINF 2016 - 9th International Conference on Health Informatics
316
Transmit Power results in a higher energy con-
sumption of the beacon, but also in a higher re-
ceive probability during the Scan Time of the de-
vice.
As introduced in Section 2, a region map has to be
configured with a Beacon Positive and a Beacon Neg-
ative List. An example is shown in Table 3. The lo-
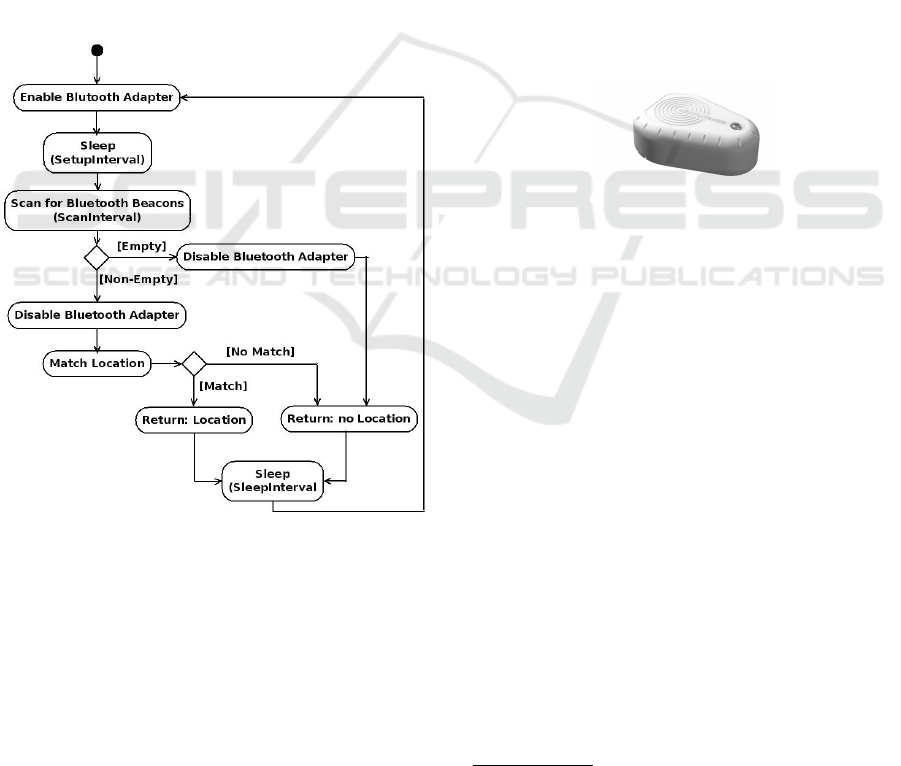
calization algorithm is illustrated in detail in Figure 1.
Periodically, the smartphone enables the Bluetooth
adapter to scan for advertising messages and sleeps
between. Since the Bluetooth radio needs some time
to get ready, the smartphone gets for Setup Time sec-
onds again in the sleep mode after starting the BLE
radio. After localization, the smartphone sleeps for
Sleep Interval seconds. Hence, localization is done
about every Sleep Interval plus Sleep Time seconds.
During localization, the received beacon signatures
are compared with the region map entries and the first
match is returned.
Figure 1: Localization algorithm.
In case a critical region is detected, the device
sends a notification to a configured address (Kompass
server or telephone number) via WiFi or SMS.
Privacy Concerns: Our location system uses 3
different reporting modes to support the privacy con-
cerns of the user which have to be configured:
1. alarm: The localization information is only re-
ported to the Kompass server in case of an emer-
gency event, for example a detected fall with un-
consciousness.
2. tracking-alarm: The localization is reported to the
Kompass server when the user leaves the safe en-
vironment and enters a critical region.
3. tracking: The device reports periodically the lo-
calization to the server. This helps to find lost de-
vices. Further, the localization is sent in case of
the alarm messages.
5 RESULTS
5.1 Hardware and Software Parameters
In our test environment we used BLE iBeacons of
BEACONinside, Model No. B0001-A
2
which is pow-
ered by two batteries from type AAA. Due to the
manufacturer’s data sheet, the beacons should op-
erate about 1-year once deployed using the default
(highest) Transmit Power of 0 dBm. The mobile de-
vice was the HTC ONE mini2 smartphone with An-
droid 4.4.2 (KitKat) installed.
Figure 2: BEACONinside: Picture of the used Beacon
3
.
First, we experimented with the parameters to set
up a robust system. We measured a Setup interval of
2.5 s. Hence, we configured a Sleep Interval of 4.5 s
to scan about every 10 s. The Advertising Interval was
set to 200 ms and the Scan Time to 3 s. Theoretically,
the device should receive up to 15 advertising broad-
casts during one scan process. The chosen parameter
values are summarized in Table 1.
5.2 Comparison WiFi and BLE
First Experiment: In our first test scenario we com-
pared the results from (Kappel, 2014) for WiFi with
a BLE setup. Kappel deployed three WLAN access
points and defined four regions as shown in Table 2
and illustrated in Figure 3. The regions were de-
fined according to the coverage of the WLAN access
points. The access points did not support cell breath-
ing. During a walk along the corridor, Kappel made
65 measurements and reports only one false localiza-
tion (98.4 % correct localizations).
We repeated this experiment using three BLE bea-
cons at the same positions, each sending with the
2
http://www.beaconinside.com
3
Picture from press kit of Beaconinside (Copyright
2014 BEACONinside GmbH. All right reserved.)
Indoor Positioning: A Comparison of WiFi and Bluetooth Low Energy for Region Monitoring
317
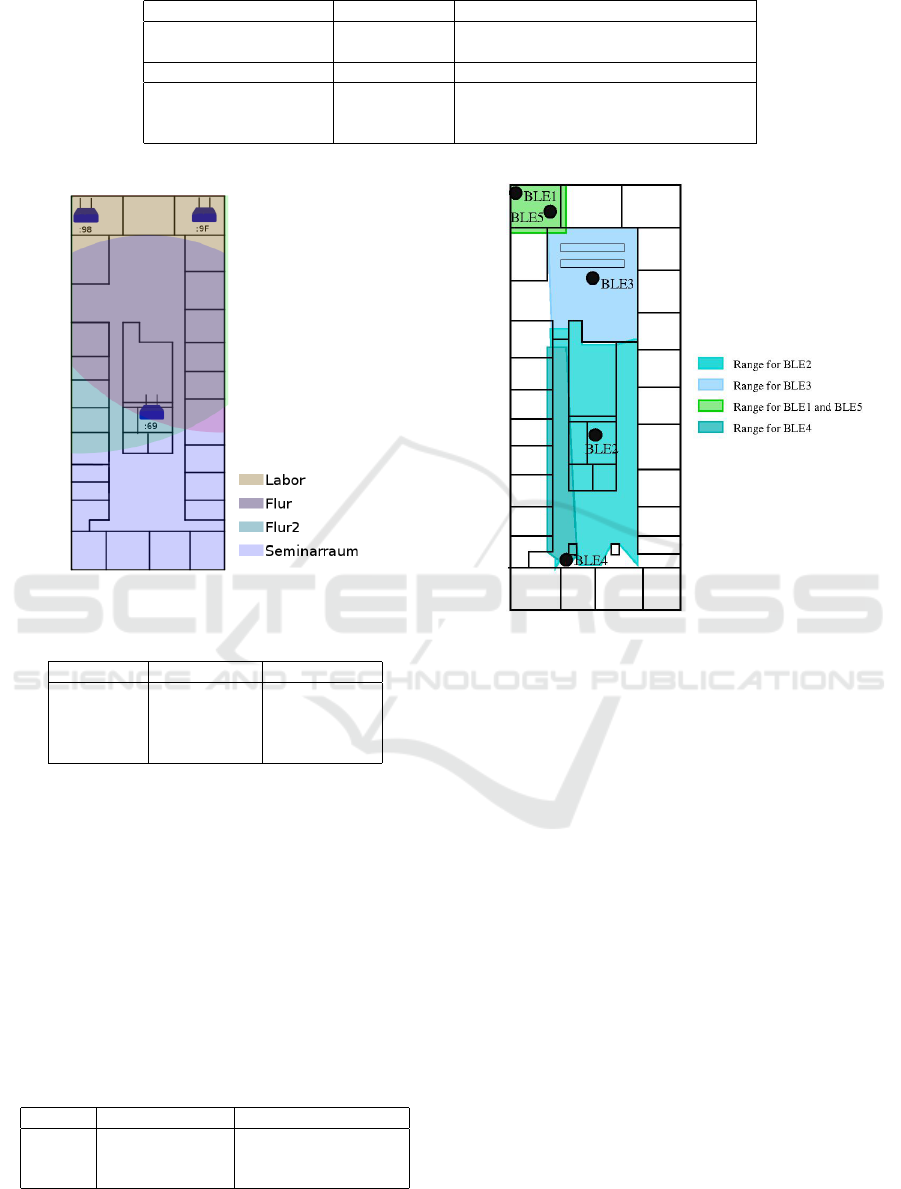
Table 1: Parameter list of the localization algorithm.
Beacon Parameter Value description
Advertising Interval 200 ms Time between two advertisements
Beacon transmit power -23/-6/0 dBm
Smartphone Parameter Value description
Setup time 2.5 s Time until the Bluetooth radio is ready
Sleep Interval 4.5 s Time between localizations
Scan Time 3 s Time the Bluetooth radio is listening
Figure 3: Regions with WLAN access points (Kappel,
2014).
Table 2: Region map for WiFi from (Kappel, 2014).
Region Positive List Negative List
Lab :9f; :98 :69
Floor :69; :9f; :98
Floor 2 :98; :69 :9f
Classroom :69 :98; :9f
highest transmitting power of 0 dBm (three beacons
instead of WLAN access points :98, :9F and :69 in
Figure 3). Similar to the test from Kappel, 70 mea-
surements were made during a walk along the corri-
dor with the smartphone in the hand, but in only 28
measurements the correct region was detected. WiFi
has a further range than BLE and does not fade out as
fast as BLE. Obstacles as walls, doors and reflecting
surfaces affect the signal strength of BLE more than
WiFi. Hence, there have been areas in which no ad-
vertisement messages could be received and therefore
no localization was possible.
Table 3: Region map for BLE test.
Region Positive List Negative List
Lab BLE 1 or BLE5 -
Floor BLE3 -
Floor2 BLE4 or BLE2 BLE1, BLE3, BLE 5
Second Experiment: In the next experiment, we
Figure 4: Regions with BLE beacons.
increased the number of beacons and used different
transmit powers. The beacon placement is shown in
Figure 4 and corresponding region map in Table 3.
The transmit power of the beacons is set as follows:
beacon BLE1 and BLE5 are in the low transmit power
mode (-23 dBm), beacon BLE3 in median (-6 dBm),
and beacon BLE2 and BLE4 in high transmit power
mode (0 dBm).
In our experiments, a low transmit power is ben-
eficial for a more accurate localization due to the
smaller cell radius (see the Lab region). On the
other hand, beacon messages sent with a low trans-
mit power are lost more often, since they are shielded
by the body of the smartphone user. Therefore, we
equipped the laboratory with two beacons to increase
the receive probability.
Further, we added an additional beacon BLE4 be-
hind the column which was no problem in case of
WiFi, but shielded the BLE beacon signal of beacon
BLE2.
We repeated the measurements and got 85 correct
localizations out of 88 (96.6 %).
HEALTHINF 2016 - 9th International Conference on Health Informatics
318
5.3 BLE Accuracy Tests
In the following test scenarios, we investigated
whether it is possible to localize more accurate us-
ing BLE. Therefore, we defined smaller regions in
the north part of the building. The test environment
is about 19 m x 19 m. Again, we experimented with
different beacon densities (3 resp. 5 beacons) and dif-
ferent beacon transmit powers. The beacons are de-
ployed as shown in Figure 5 in a height of approxi-
mately 2,3 m. The 10 test positions where the smart-
phone user made the localization are also shown in
Figure 5. For each test position, the localization was
made 9 times which results in 90 measurements. At
each test position, the test person turns around about
40
◦
after each measurement. Hence, in some of the
experiments there is a direct line-of-sight, and in the
others, there is the human body as an obstacle.
Figure 5: Three beacons with lowest Transmit Power.
Lowest Transmit Power - In our first experiment,
we tested with three beacons (Beacon 1, 2 and 3) in
the lowest transmit power mode of -23 dBm. The ex-
pected benefit of the low transmit power is a longer
beacon life time due to energy savings and a more ac-
curate localization due to smaller cells.
The goal of this test scenario was to determine
whether it is possible to distinct two neighboring
rooms (Laboratory 1 and 2), and further to identify
the critical region with two exits (elevator and stair-
case). The region map is shown in Table 4. The re-
gion map was designed in such a way that position 1
and 2 are in the laboratory 1, position 3 and 4 are in
laboratory 2, 9 and 10 within the critical region, and
all other positions (5-8) are within the safe corridor.
From the 90 localizations, 70 were correct and 20
were incorrect. The results for each position are given
in Table 5. Failures occur when the test person stands
near a beacon and shields the beacon broadcast (Po-
sition 1,2, and 10). At position 9, the elevator shields
the signal.
Medium Transmit Power - In the next step, we
Table 4: Region map for experiment with 3 Beacons.
Region Positive List Negative List
Lab 1 Beacon 1 empty
Lab 2 Beacon 2 empty
crit. region Beacon 3 empty
safe corridor empty empty
Table 5: Low Transmit Power (-23 dBm).
Test place correct false
1 5 4
2 7 2
3 9 0
4 9 0
5 7 2
6 9 0
7 7 2
8 8 1
9 4 5
10 5 4
Total 70 20
Percent 77.8 22.2
increased the transmit power to the medium mode of
-6 dBm. The results are shown in Table 6. Due to the
higher transmit power, the beacon cells are enlarged
and overlap. Hence, lots of false localizations occur
(55.5 %). It is notable that a high error rate occurs
at positions 5, 6, 7, and 8 which belong to the safe
corridor. Due to the higher transmit power, advertise-
ment messages from beacon 1, 2, or 3 were received
at these positions which results in a wrong classifica-
tion.
Table 6: Medium Send Signal strength -6 dBm.
Test place correct false
1 9 0
2 9 0
3 2 7
4 4 5
5 0 9
6 1 8
7 0 9
8 0 9
9 7 2
10 9 0
Total 41 49
Percent 45.5 55.5
Higher Beacon Density - The key problem iden-
tified in the experiment with low transmit power was
the inability to perform any localizations at all, due
to the limited beacon range. In the experiment with
medium transmit power, the key problem identified
was the number of incorrect localizations due to the
unexpectedly high range. This particularly affected
positions in the corridor where we could not distin-
guish the safe corridor from other regions including
the critical region.
Indoor Positioning: A Comparison of WiFi and Bluetooth Low Energy for Region Monitoring
319
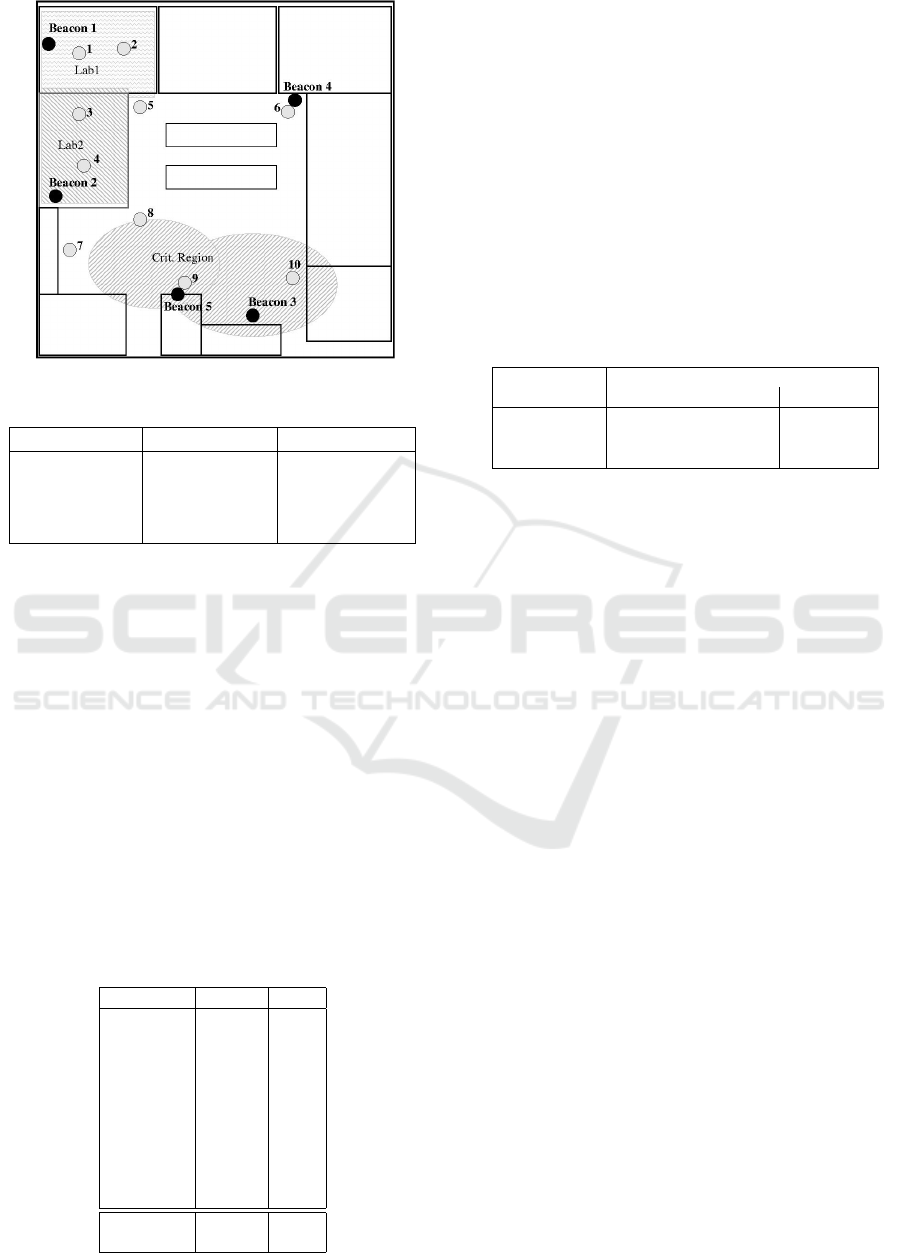
Figure 6: Five beacons with low transmit power.
Table 7: Region map with 5 beacons.
Region Positive List Negative List
Lab 1 Beacon 1 Beacon 4
Lab 2 Beacon 2 Beacon 4
Crit. Region Beacon 3 or 5 Beacon 1, 2, 4
Safe Corridor - Beacon 1, 2
Hence, we increased the beacon density as shown
in Figure 6. All beacons operated in the low transmit
power mode. We added one beacon in the corridor
to distinguish one area of the corridor from the other.
Furthermore, we added a beacon at the elevator, since
the beacon for that region could often not be seen due
to a missing line of sight (elevator shaft). For that rea-
son, point 8 is considered part of the critical region for
this experiment. The region map is shown in Table 7.
As can be seen in Table 8, this improves the results
for some positions only, while worsening the results
of other areas. In particular, point 7 is now showing
poor performance due to the high range of the added
beacon at the elevator shaft. As expected, points 9
and 10 however achieve better results compared to the
experiment with medium transmit power.
Table 8: Higher beacon density with 5 beacons.
Test place correct false
1 5 4
2 6 3
3 4 5
4 7 2
5 8 1
6 9 0
7 1 8
8 6 3
9 8 1
10 7 2
Total 61 29
Percent 67.8 32.3
5.4 Power Consumption
In a further experiment, we compared the power con-
sumption of WiFi and BLE for region monitoring.
Kappel reports experimental results for a HTC Evo
3D using WiFi (Kappel, 2014). He measured the
runtime of the smartphone when the localization is
performed every 10 or 30 seconds and compares this
value with the runtime when no positioning is done. If
the positioning app was not running, the battery was
discharged after 185 hours and 31 min. With the run-
ning app and an interval of 10 s for positioning, the
device runtime was 37 hours and 15 min, for an inter-
val of 30 s, the runtime was 50 hours and 43 min.
Table 9: Power Consumption.
Localization device runtime
WiFi (Kappel, 2014) BLE
Without 185.5 hours 500 hours
every 10 s 37 hours 70.5 hours
every 30 s 80 hours 151 hours
We measured the power consumption of region
monitoring for BLE on the smartphone HTC ONE
mini2. Table 9 shows that BLE improves significantly
the device runtime.
6 CONCLUSIONS AND FUTURE
WORK
Low power networks like Bluetooth Low Energy are
attractive for indoor positioning due to the easy in-
stallation, the low power consumption and the long
life cycle of the beacons. Therefore, we compared
Bluetooth Low Energy (BLE) with WiFi in a region
monitoring scenario where the localization is done on
a mobile device like a smartphone. The region-based
positioning was implemented as an app for Android
smartphones.
Regarding power consumption, the benefit of BLE
is impressive. BLE nearly doubled the runtime of the
mobile device from 37 hours up to 70 hours when the
device tries to localize its position every 10 seconds.
Regarding accuracy, the result is not so obvious.
Even with the maximal signal strength, we did not get
a coverage like WiFi. So we had to increase the bea-
con density. Since the costs per beacon is low com-
pared with WiFi, this is no serious drawback. On the
other hand, the higher beacon density combined with
different transmit power modes allows the definition
of smaller regions and hence a more accurate local-
ization compared with WiFi.
In a coarse grain scenario, we achieved 96.6 %
correct localizations with BLE. In a similar scenario,
HEALTHINF 2016 - 9th International Conference on Health Informatics
320

Kappel reported 98.4 % correct localizations in case
of WiFi (Kappel, 2014). In a second test series, we
tried to identify smaller regions with BLE. In these
experiments, the best result was 77.7% correct local-
izations.
Another aspect for the usability of the presented
approach is the setup time of the beacon infrastruc-
ture. While it is short compared with fingerprinting
or parameter tuning for model-based algorithms, the
effort for beacon positioning and test measurements
is not neglectable.
In our use case, the caretakers are notified when a
demented and disoriented person leaves the safe area.
For sending notification messages, the BLE infras-
tructure is not suited. Hence, the existing WiFi infras-
tructure of the building or SMS messages via GSM
have to be used.
In (Fudickar et al., 2011) a dynamic localization
interval is motivated. For example, a resident may
have lunch and is not moving. In this situation, the
localization interval may be increased for further en-
ergy savings. Therefore, we will combine sensor data
from the smartphone’s accelerometer which are al-
ready used for fall detection with the localization sys-
tem. Further, we will use thresholds for the RSS val-
ues and investigate their influence on the positioning
accuracy.
REFERENCES
Bahl, P. and Padmanabhan, V. N. (2000). RADAR: an in-
building RF-based user location and tracking system.
Proceedings IEEE INFOCOM 2000 Conference on
Computer Communications Nineteenth Annual Joint
Conference of the IEEE Computer and Communica-
tions Societies, 2(c):775–784.
Behnke, R. and Timmermann, D. (2008). AWCL: Adap-
tive Weighted Centroid Localization as an efficient
Improvement of Coarse Grained Localization. In 5th
Workshop on Positioning Navigation and Communi-
cation, pages 243–250.
Dementyev, A., Hodges, S., Taylor, S., and Smith, J. (2013).
Power consumption analysis of bluetooth low energy,
zigbee, and ant sensor nodes in a cyclic sleep scenario.
In Proceedings of IEEE International Wireless Sym-
posium (IWS), pages 1–4. IEEE.
Faragher, R. and Harle, R. (2014). An analysis of the ac-
curacy of bluetooth low energy for indoor positioning
applications. pages 201–210, Tampa, Florida, USA.
Fink, A., Beikirch, H., and Voss, M. (2010). Improved In-
door Localization with diversity and filtering based on
received signal strength measurements. Computing,
9(1):9–15.
Fudickar, S., Schnor, B., Felber, J., Neyer, F. J., Lenz, M.,
and Stede, M. (2011). KopAL - An Orientation Sys-
tem For Patients With Dementia. In Gottfried, B. and
Aghajan, H., editors, Behaviour Monitoring and In-
terpretation - BMI, volume 9 of Ambient Intelligence
and Smart Environments, pages 83–104. IOS Press.
ISBN: 978-1-60750-730-7.
Fudickar, S. and Valentin, M. (2014a). Comparing Suit-
ability of Sub 1 GHz and WiFi Transceivers for RSS-
based Indoor Localisation. In 5th International Con-
ference on Indoor Positioning and Indoor Navigation
(IPIN), Busan, Korea.
Fudickar, S. and Valentin, M. (2014b). Most Accurate Al-
gorithms for RSS-based Wi-Fi Indoor Localisation. In
5th International Conference on Indoor Positioning
and Indoor Navigation (IPIN), Busan, Korea.
Gansemer, S., Pueschel, S., Frackowiak, R., Hakobyan, S.,
and Grossmann, U. (2010). Improved RSSI-based Eu-
clidean Dustance Positioning Algorithm for large and
Dynamic WLAN Environments. Computing, 9(1):37–
44.
Gimpel, T., Kiertscher, S., Lindemann, A., Schnor, B., and
Vogel, P. (2015). Evaluation of Threshold-based Fall
Detection on Android Smart Phones. In In Proceed-
ings of the 8th International Conference on Health In-
formatics (HEALTHINF), Lisbon, Portugal.
ITU (2012). Propagation data and prediction methods for
the planning of indoor radio communication systems
and the radio local area networks in the frequency
range 900 MHz to 100 GHz (ITU-T Recommendation
P.1238-7). International Telecommunications Union,
Geneva, Switzerland.
Jianyong, Z., Zili, C., Haiyong, L., and Zhaohui, L. (2014).
RSSI Based Bluetooth Low Energy Indoor Position-
ing. In Proceedings of the 5th International Con-
ference on Indoor Positioning and Indoor Navigation
2014 (IPIN 2014).
Kappel, M. (2014). Indoor-Lokalisierung mit Android
basierten Smartphones. Bachelor thesis, University of
Potsdam.
Scheffler, T., Schindler, S., and Schnor, B. (2013). Using
AOP-based Enforcement of Prioritized XACML Poli-
cies for Location Privacy. International Journal of In-
ternet Technology and Secured Transactions, 5(1):84–
104.
Schindler, S. (2011). Location Privacy. Diploma thesis,
University of Potsdam.
Indoor Positioning: A Comparison of WiFi and Bluetooth Low Energy for Region Monitoring
321
