
An Unobtrusive Wearable Device for Ambulatory Monitoring of
Pulse Transit Time to Estimate Central Blood Pressure
Hanne O. Austad, Jon Vedum, Morten H. Røed, Steffen Dalgard, Tomas Brødreskift,
Anders E. Liverud, Frode Strisland and Trine M. Seeberg
SINTEF Informatics and Communication Technology, NO-0314 Oslo, Norway
Keywords: Wearable Sensor, Blood Pressure, Pulse Transit Time, ICG, PPG.
Abstract: There is a clinical need for improved ambulatory, frequent and unobtrusive monitoring of blood pressure
and cardiac parameters like systolic time intervals. Truly unobtrusive wearable devices combining
impedance cardiography with other sensors may be one possible solution. The IsenseU-BP+ device
presented in this article measures single channel ECG, impedance cardiography and photo plethysmography
at the chest. The device also measures activity and posture, as well as skin temperature. In this study, we
report on the possibility to use these signals to measure pulse transit time for estimating blood pressure
changes. Six subjects has been tested. Four of them showed good correlation between PTT and mean
arterial pressure while two of the subjects had too low signal to noise ratio in the photoplethysmography
signal for good estimation of PTT. Thus these results show that the quality of the raw data is promising for
calculating a pulse transit time that shows good coherence with mean arterial pressure.
1 INTRODUCTION
High blood pressure, hypertension, is estimated to
cause about 13% of the total of all deaths world
wide. In 2008 40% of adults aged 25 and over
suffered from hypertension globally (World Health
Organization Global Health Observatory (GHO)
data on raised blood pressure, n.d). Raised blood
pressure levels represent a major risk factor for
coronary heart disease and stroke. The risk increases
with increasing blood pressure level. Treating
systolic blood pressure and diastolic blood pressure
to get below 140/90 mmHg, is associated with a
reduction in cardiovascular complications (Mancia
et al., 2013). Increasingly, the medical community is
also focusing on blood pressure variability
(Rothwell et al., 2010) and the night level blood
pressure in the assessment and treatment of
hypertension. For a person with high and poorly
controlled blood pressure, the pressure often varies
significantly throughout the day, as well as between
days. Point measurements taken in a doctor's office
therefore tend to be inadequate or even misleading.
For ambulatory monitoring to evaluate the variation
during day and night at home the state of the art is to
measure blood pressure over a 24-hour period with
cuff-based equipment. Typically, point
measurements are taken three times per hour during
daytime and once per hour during sleep. The
equipment is usually validated at rest only (O'Brian
et al., 2010). Patients are instructed to sit down when
the measurements are to be taken, thereby
interfering with daily living. A significant group of
the patients finds the cuff inflation stressful and
disturbing, and this is particularly a problem during
night. Thus, there is a need for better ambulatory
blood pressure measurement equipment.
One approach for a new cuff-less ambulatory
blood pressure system is to measure the pulse wave
velocity or the inversely proportional pulse transit
time (PTT). Assumed correlation between blood
pressure and PTT is based on the Moens-Korteweg
equation (Nichols and O'Rourke, 2005), which
describes how the pulse wave velocity of elastic
tubes are associated to structural arterial stiffness.
The average pressure of the arterial wall defines the
stiffness and therefor PTT should correlate better
with Mean Arterial Pressure (MAP) than systolic
and diastolic blood pressure. Different technical
solutions have been proposed and several studies
show correlation between PTT and blood pressure (a
good summary was given in Buxi et al., (2015)).
Austad, H., Vedum, J., Røed, M., Dalgard, S., Brødreskift, T., Liverud, A., Strisland, F. and Seeberg, T.
An Unobtrusive Wearable Device for Ambulatory Monitoring of Pulse Transit Time to Estimate Central Blood Pressure.
DOI: 10.5220/0005701401790186
In Proceedings of the 9th International Joint Conference on Biomedical Engineering Systems and Technologies (BIOSTEC 2016) - Volume 1: BIODEVICES, pages 179-186
ISBN: 978-989-758-170-0
Copyright
c
2016 by SCITEPRESS – Science and Technology Publications, Lda. All rights reserved
179
Several of the studies measured the time from ECG
R-peak to the pulse wave reached a peripheral
artery. This time measurement includes both PTT
and part of the pre-ejection period, which is the
period from start of the depolarization of the heart,
represented with the ECG-Q wave, to the aortic
valve opening. Both the pre-ejection period and the
PTT vary with blood pressure, and combining the
two makes extraction of blood pressure values
difficult (Muehlsteff, Aubert and Shuett, 2006).
Including part of the pre-ejection period also makes
the measurement dependent on posture (Muehlsteff,
Aubert and Morren, 2008). Impedance cardiography
(ICG) can be used to detect aortic valve opening and
therefore the pre-ejection period can be excluded
from the measurements. ICG is a diagnostic method
based on measurement of the electrical properties of
the biological tissues applied to the thorax region.
Changes in impedance on each heartbeat reflect
changes in blood volume in the great vessels, but the
origin of the signal is complicated and not well
understood (Patterson, 2010).
In most of the studies estimating blood pressure
based on PTT, as well as in commercially available
devices (ViSiMobile, n.d.), a peripheral point at the
finger or earlobe is used. Using e.g. the finger allows
vasoconstriction (narrowing of the blood vessels
resulting from contraction of the muscular wall of
the vessels), to affect the results (Budidha and
Kyriacou, 2014). Vasoconstriction can be caused by
e.g. exercise or temperature changes. Measuring the
peripheral pulse on the chest makes the system less
vulnerable to vasoconstriction. Sola et al. (2013)
have demonstrated a chest sensor system complying
with the British Hypertension Society requirements
of Grade A blood pressure monitors for MAP
readings. PTT in Solà et al.'s system is measured
from opening of the aortic valve to the internal
thoracic artery, just after it arise from the subclavian
artery. However, only a prototype setup, that is not
fully integrated, is shown and only results for
subjects at rest in supine position were presented.
This paper introduces a new, compact and
unobtrusive wearable sensor device intended for
long term continuous blood pressure estimations.
This device, IsenseU-BP+, is to our knowledge the
first fully integrated device aiming for estimating
blood pressure, with ECG, ICG and photo
plethysmography (PPG) sensors as well as all
necessary electronics and processing; everything
combined in one small unit strapped around the
chest which make it truly unobtrusive in daily life.
Results from tests that compares the individual
sensor signal quality to reference sensors are
presented, followed by PTT measurements and an
evaluation of how these correlates with changes in
blood pressure.
2 MATERIALS AND METHODS
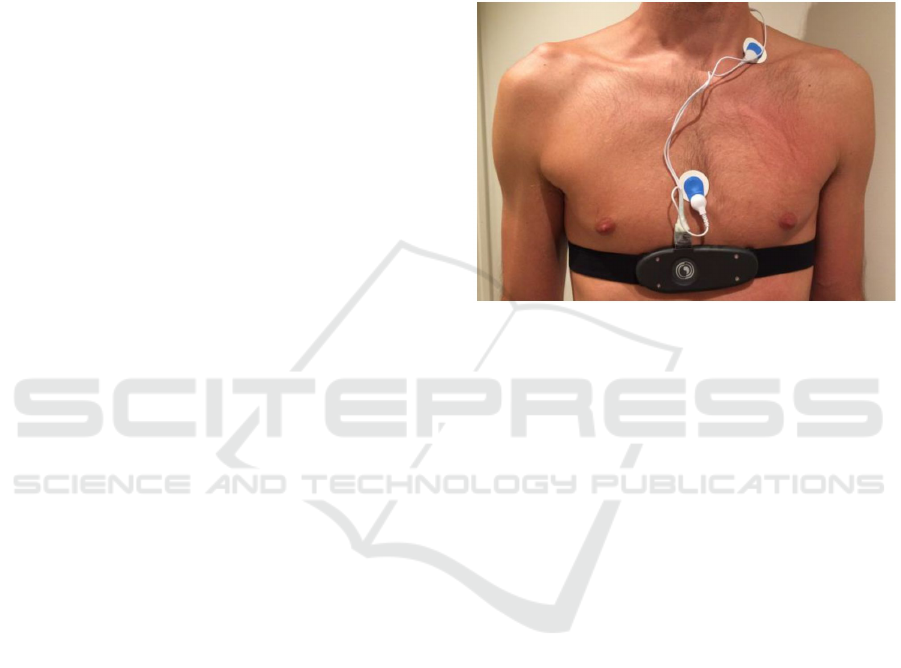
2.1 The IsenseU-BP+ Device
Figure 1: The IsenseU-BP+ wearable device with
electrodes.
Physically, the device resembles the heart rate
monitor commonly used during exercise, but with
the addition of three standard ECG electrodes. The
electronic compartment has an elliptic-like form
with a major axis 12.5 cm, and minor axis of 4.5 cm.
An image of a subject wearing the device is shown
in figure 1. The device is built around a 32-bit ARM
Cortex-M3 microcontroller (Cypress PSoC® 5LP),
and provides wireless Bluetooth communication.
The Bluetooth Serial Port Profile is implemented for
live transmission of all data, and a Continua Health
Alliance based Health Device Profile
implementation is made for exchange of a sub-set of
the data. An internal flash memory allows offline
data logging. The belt is a commercially available
off-the-shelf belt with rubber electrodes.
There are three primary sensors:
1) A single-channel (2-electrode) ECG circuit
detecting the electrical activity of the heart
2) ICG that monitors variations in the electrical
impedance of the heart region during the contraction
cycle. This is a four-point measurement, using two
electrode sets for sourcing a weak AC current (1mA
RMS, 60 kHz), and two sense electrodes.
3) A PPG sensor detecting changes in the blood
flow at the chest. A green LED (570nm) sends light
pulses into the skin, and the returned light is
measured by a photodetector. The LED and the
BIODEVICES 2016 - 9th International Conference on Biomedical Electronics and Devices
180
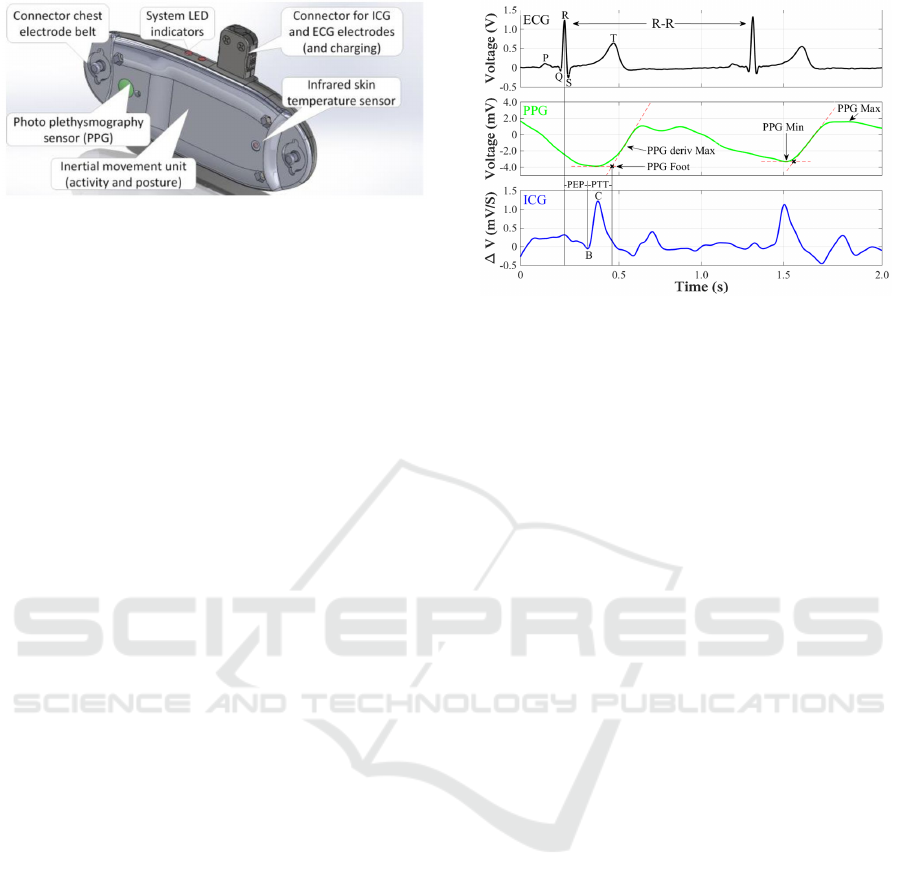
Figure 2: Drawing of the IsenseU-BP+ wearable device
with sensors.
detector are mounted approximately 6 mm apart on
the rear of the device. The PPG sensor location at
the chest, will make the measurements less affected
by vasoconstriction than when measuring at the
finger.
To reduce the number of electrodes, the same
electrodes are used for both ICG and ECG sensing.
One of these electrodes is located at or close to the
lower part of sternum and the other close to the left
collarbone. The ICG current source uses the two
chest-belt electrodes in parallel in addition to an
electrode behind the neck. Electrode locations
optimize the ICG signal rather than the ECG signal.
Locations are selected after in-house testing based
on work by Patterson (2010) and inspired by the
testing done by Tan, Lai and Hwang (2006) on
electrode placement with the Physio Flow®
impedance cardiograph device for cardiac output
(Physioflow, n.d.). The position of the sense
electrodes gives a non-standard ECG waveform, but
does not influence the detection of the R-peak of the
ECG signal or the R-to-R distance or variation.
Figure 2 shows a drawing of IsenseU-BP+ with
sensor locations. Mechanically, the device was
designed to be comfortable for both genders of all
weights, with rounded edges and smooth surfaces.
The prototype was made by rapid prototyping with
laser sintered plastic (PA2200).
PTT was measured from the ICG-B point (see
figure 3) to the point of pulse arrival seen in the PPG
signal. The ICG-B point indicates the opening of the
aortic valve. In this work a method for ICG-B point
estimation described by Van Lien et al. (2013) was
used. Even though this estimation method did not
estimate pre-ejection period with the accuracy
required by van Lien et al. (2013), the precision of
the ICG-B-point detection was judged sufficient for
this first evaluation of using IsenseU-BP+ to
estimate blood pressure changes. The RC interval
was first computed as the time between the R-peak
of the ECG and the C point of the ICG trace (RC in
ms) Thereafter, the time from R-peak to B (RB in
Figure 3: Detection of distal and proximal time from PPG
and ICG signals. (PEP – pre ejection period of the heart).
ms) was calculated according to van Lien et al
(2013), RB = -15 + (0.7*RC). Knowing the timing
of the R peak and the RB distance, the time of the B-
point is found. The distal time was found from the
PPG signal as the foot of the pressure wave. This
was defined for a heart cycle by the intersection of
the tangent through the minimum PPG and the
tangent through the maximum slope of the PPG.
Finally, PTT was calculated as the difference
between time of the PPG
Foot
and the B-point. The
characteristic points for the signals are shown in
figure 3.
2.2 Test Setup
According to the Norwegian Health Research Act,
no approval by committee for medical and health
research ethics was needed for these tests. For
storing personal data, an approval from the The Data
Protection Official for Research under the Personal
Data Act/Personal Health Data Filing System Act
was obtained.
The IsenseU-BP+ ICG and ECG sensors were
compared to a BioNomadix system (BioPac
Systems, Inc., Goleta, CA, USA). The fields of two
ICG sensors applied at the same time may affect the
result of the sensors, and therefore the testing with
the two systems was done sequentially. The
sampling rate for IsenseU-BP+ sensors was 250 Hz,
while for the BioNomadix system it was 1 kHz. The
Nonin finger signal was captured with a 100Hz low
pass filter, and BioNomadix ECG and ICG with a
20Hz filter. IsenseU-BP+ sensors were captured
ufiltered. Both IsenseU-BP+ and BioPac system was
attached before the test started. The subjects rested
for 5 minutes to minimize changes in heart rate. For
ICG the same electrodes were used for both systems.
For BioNomadix ECG the electrodes were in pulse
An Unobtrusive Wearable Device for Ambulatory Monitoring of Pulse Transit Time to Estimate Central Blood Pressure
181
belt position with ground on the right hip. ICG and
ECG with the BioNomadix system as well as PPG
signal from a Nonin 8000AA finger clip sensor
(Nonin Medical, Inc, Plymouth, MN, USA) were
recorded for 1 minute, while the IsenseU-BP+
device was turned off. When the BioNomadix units
were turned off, its wires for ICG was switched with
the IsenseU-BP+ electrode wires. IsenseU-BP+ were
turned on for recording of ICG, ECG and PPG for 1
minute.
IsenseU-BP+ was tested for correlation between
PTT and blood pressure on six healthy volunteers,
three men and three women, aged 25 to 45. The
persons were in supine position with upper body
slightly elevated (~10 degrees.). Blood pressure
changes were induced using an isometric handgrip
manoeuvre. The reference system used for
measuring blood pressure was the CNAP® Monitor
500 HD (CNSystems Medizintechnik AG; Graz,
Austria). This system is precise compared to arterial
blood pressure measurements for MAP and diastolic
blood pressure, but with some variation for systolic
blood pressure (Ilies et al., 2015; Wagner et al.,
2015). Jamar® Plus+ Digital Hand Dynamometer
(Patterson Medical /Samsons' Preston, Warrenville,
IL, USA) was used to define the maximum grip
force of the right hand and to monitor the grip force
during the handgrip tests. Target handgrip force
during test was 30% of maximum force. The
CNAP® system was calibrated according to the
instruction manual using the integrated upper arm
cuff immediately before the tests were started. The
test protocol started with a 5 minutes rest period in
supine position, followed by three periods of
handgrip exercise lasting for minimum 3 minutes
each, and with at least 1.5 minutes intermediate rest.
At the end, the subject rested until blood pressure
was stable before he/she raised and a final upright
measurements were done. The CNAP® system was
recalibrated when standing up.
2.3 Statistical Methods
To define the relationship between PTT and MAP a
linear correlation has been assumed, and the least
square regression method has been used to find the
best linear fit. To evaluate the fit of the line the R
values (based on R
2
calculations) and root mean
square values for each point to the regression line,
has been calculated.
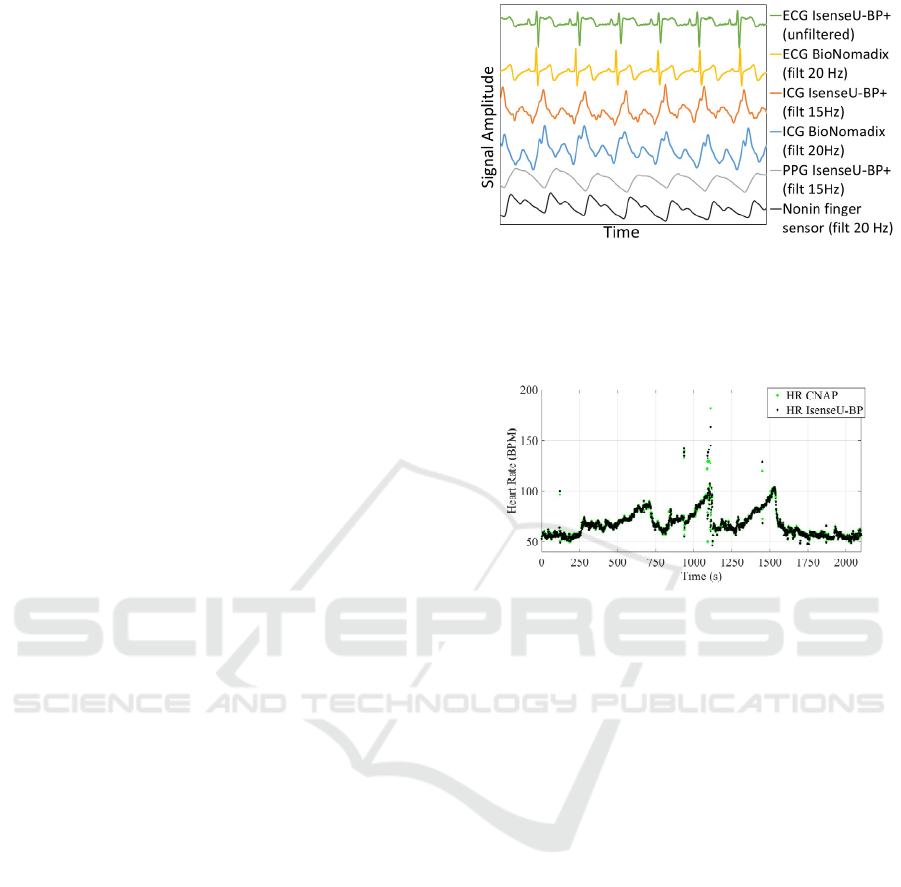
Figure 4: Comparing approximately six seconds ECG,
ICG and PPG from IsenseU-BP+ with ECG and ICG from
BioNomadix and PPG from Nonin finger sensors. The
BioNomadix signals and Nonin finger sensor signal was
recorded prior to the IsenseU-BP+ signal.
Figure 5: Comparing IsenseU-BP+ and CNAP® heart rate
(HR) for subject 5.
3 RESULTS
3.1 Verification against Reference
Sensors
As simultaneously recording of the ICG raw signals
with the two systems is not possible, raw data have
not been quantitatively compared, only a qualitative
comparison of signal form was done. Figure 4 show
data from subject 1. ECG, ICG and PPG data from
the middle of the recording with reference sensor
signals are compared to signals from IsenseU-BP+.
The signals were scaled to show approximately the
same amplitude. The figure shows IsenseU-BP+
ICG and PPG filtered using a 15Hz 4th-order
Butterworth filter.
IsenseU-BP+ calculates heart rate from the ECG
R-peak-to-R-peak interval. Figure 5 compares heart
rate from IsenseU-BP+ and heart rate detected by
the finger cuff in the CNAP® equipment for subject
5. The figure shows the test with three handgrip
manoeuvres that increase the heart rate and blood
pressure.
BIODEVICES 2016 - 9th International Conference on Biomedical Electronics and Devices
182
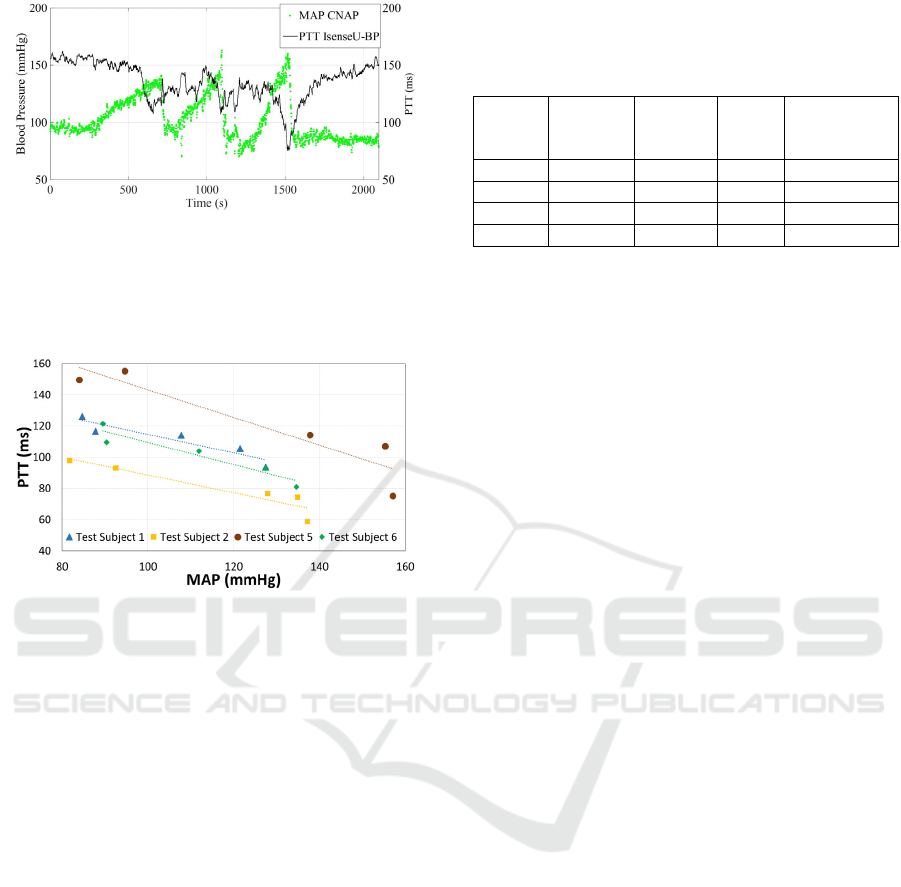
Figure 6: MAP (green) from CNAP® reference equipment
plotted together with PTT (black) from IsenseU-BP+
equipment. Plotted PTT is a moving average of 10
samples/heart cycles, while MAP shows every heart cycle.
Data is from subject 5.
Figure 7: Average PTT plotted versus the corresponding
MAP, for the start and end rest periods, and the elevated
blood pressure peaks for subject 1, 2, 5 and 6.
3.2 Correlation between PTT and
Blood Pressure
Six subjects completed the test protocol for
correlation study. In this first test it was however
only possible to estimate PTT with a reasonable low
level of noise in four of the six data sets, and only
results from these four data sets are further analyzed.
Possible reasons for the noise are discussed in
subsection 4.1.
Figure 6 shows the estimated PTT from IsenseU-
BP+ and MAP from the CNAP® reference
equipment through a complete test for subject 5. For
PTT the moving averages of 10 heart cycles was
plotted. MAP values was plotted for every heart
cycle. Figure 7 shows PTT versus MAP for five
different periods of the test: The rest period before
handgrip manoeuvre, the three blood pressure peaks
during the handgrip manoeuvres and the rest period
after the handgrip manoeuvre. During the handgrip
manoeuvre, the MAP values used was the maximum
moving average of 10 heart cycles and the PTT was
the, minimum moving average in the same peak
Table 1: R-values for linear fit of PTT as function of
MAP, RMS values for MAP to the fit line, and slope and
interception for the line. Subject 3 and 4 had too much
noise.
Subject
#
R-value
linear fit
Average
RMS
value
Slope Interception
1 0.93 4.2 -0,6 173,4
2 0.93 5.0 -0,6 145,4
5 0.93 11.0 -0,9 231,9
6 0.95 4.4 -0,7 180,4
(within ±15s from the detected MAP peak). For the
start and end rest periods, an average MAP of
approximately 30 seconds with stable blood pressure
and a corresponding average PTT value was used.
The figure shows a linear relation between MAP and
PTT. Table 1 summarize the R-values for linear fit
of the regression lines, as well as the average root
mean square values for the measured PTT value's
deviation from the line.
4 DISCUSSION
4.1 Detection of the Characteristic
Points and Heart Rate
In figure 4 a representative part of the signals from
IsenseU-BP+ is compared to signals from reference
systems. The ECG R-peak is less prominent with the
IsenseU-BP+ location of electrodes. For all subjects
ECG R-peaks were easily detectable, both for using
as a guide for detection of the ICG-C-peak, and for
calculating of heart rate based on R-R interval.
Figure 5 compares the heart rate detected by the
IsenseU-BP+ device and the CNAP® system. There
are some divergent heart rate measurements for both
systems, but the periods with divergent
measurements were similarly detected by both
systems and was probably realistic. These results
shows that the use of combined ECG and ICG sense
electrodes are acceptable. ICG signals in figure 4
were recorded with the same electrodes and have
similar shape. The IsenseU-BP+ ICG signal had
some noise, even though IsenseU-BP+ had a lower
filter frequency in this plot. The subject had a double
ICG-C peak and this is more clearly seen in the
BioNomadix recording and may be due to the lower
filter frequency and lower sampling rate used for
IsenseU-BP+ in this study. For the detection of the
ICG-C peak, the quality of the ICG signal from
IsenseU-BP+ was similar to BioNomadix, but the
lower sampling rate decreased the resolution. The
An Unobtrusive Wearable Device for Ambulatory Monitoring of Pulse Transit Time to Estimate Central Blood Pressure
183

IsenseU-BP+ ICG signal quality was not evaluated
for direct detection of B-point.
van Lien et al (2013) did not find the estimation
of ICG-B point through RC distance to be precise
enough for pre-ejection period estimation. They
were looking for changes in order of 3.5 ms in
individual heart cycles. In the laboratory/
ambulatory study they had a mean difference
between the actual pre-ejection period and estimated
pre-ejection period of +8ms/-4ms. Approximately
half of the error was due to using a fixed value for
the period from onset of depolarization of the heart
till ECG-R. The error in the individual heart cycle
RB period in their study was then +4ms/-2ms. We
have looked at an averaged PPT value and assuming
the error in B detection had a random component,
the averaging decreased the error. A change in mean
blood pressure of 10 mmHg is expected to give a
change in PTT about 8ms-16ms (Proenca et al.,
2010). Their calculations was based on PTT values
in the range 100ms to 200ms. Thus, the error caused
by this method for ICG-B point detection will
influence the possibility to detect small changes in
blood pressure, and the beat-to-beat variation. For
changes in the range evaluated in this study (>20
mmHg and averaged over 10 heart cycles) the error
of the ICG-B point detection was judged acceptable.
Figure 4 shows that during supine rest the quality
of the PPG signal is good. The PPG-foot is as
sharply defined when measured at the chest as at the
finger. It was observed that quality of the chest PPG
signal vary with small changes in location of the
sensor as well as with the pressure towards the skin.
Breathing will cause changes in the level of the PPG
signal. In this study, 2 out of the 6 subjects had high
noise in their PPG foot detection. Initial studies of
these data indicates that this is caused by low signal
quality due to none-optimal placement of the PPG
sensor, and filtering of the PPG signal to reduce
breathing artefacts. Filtering to remove the breathing
artefacts without influencing the PPG foot detection
must be further improved. In this device, the PPG
sensor has only one LED, while others have
suggested advanced arrays of LEDs and detectors
(Solà et al., 2011). For a more robust PPG foot
detection during movement an improvement in the
PPG sensor and better algorithms for motion artefact
suppression are required.
4.2 IsenseU-BP+ as a Device for
Estimating Blood Pressure
To evaluate blood pressure, physicians usually
relates to all the three blood pressure values;
systolic, diastolic and mean. According to the
Moens-Kortweg equation (Nichols and O'Rourke,
2005) estimation techniques based on pulse wave
velocity, and its inversely proportional pulse transit
time, provides estimates of MAP and not systolic or
diastolic pressure, since the average pressure of the
arterial wall defines the structural arterial stiffness.
Based on this, this study focus on MAP. Others have
however reported good correlation with systolic
blood pressure.
Measured PTT and MAP versus time are plotted
for subject 5 in figure 6. These data indicates that the
measured PTT response is delayed compared to the
pressure measured with the finger cuff. This may be
due to measurements at different locations. Central
blood pressure changes may differ from peripheral
blood pressure changes. Further work is needed to
investigate this delay, whether it shows a real
physiological difference or if it is caused by a
weakness in the algorithms that detects the
characteristics point in the raw signal. MAP during
rest before the test is higher than after the test. This
decrease was observed for several subjects and may
be due to a drift in the CNAP® reference equipment.
The first part of the test lasted 35 minutes with no
recalibration of the CNAP® reference system during
the test. The default recalibration, with arm cuff,
interval of the CNAP® equipment is 15 minutes.
This possible small drift has not been judged critical
for these initial tests to verify the design of the
IsenseU-BP+ device.
The PPT values in range 80ms-180ms are
reasonable compared to the overall value of 95ms
presented by Solà et al. (2013). IsenseU-BP+ detects
the PPG signal further away from the heart than the
system made by Solà et al. (2013).
Muehlsteff, Aubert and Morren (2008) have
found that when the person changed posture form
lying to sitting the pre-ejection period increased
significantly (25-45 ms) while blood pressure was
stable or slightly increased. We found a slight
decrease in PTT when subject rose corresponding to
an expected slight increase in blood pressure, thus
the PTT measurements was not dependent on
posture (results not shown).
Figure 7 and table 1 show good correlation
between PTT and MAP for the four subjects
evaluated (two excluded due to noise in PPG
measurements as discussed in section 4.1). The
number of points in the regression analysis was
however low, and there were also an uncertainty in
the MAP measurements. To increase the confidence
in the regression parameters, a test set-up that gives
more points per person is needed.
BIODEVICES 2016 - 9th International Conference on Biomedical Electronics and Devices
184

The maximum of the moving average CNAP®
MAP and the minimum the moving average
IsenseU-BP+ PTT, within ±15s of the time for
maximum MAP, are used in the plot. The maximum
MAP and minimum PTT do not match exactly in
time (as seen also in figure 6); this may be related to
the different location of the sensors but has to be
further investigated. The current version of the
equipment was not intended for beat to beat
comparison of values and hence this approach is
judged acceptable. With more stable changes in
blood pressure, a longer averaging period could be
used. The slope of the PTT – MAP linear regression
line differs between persons and individual
calibration functions will be needed. This is the
same as reported by others (Solà et al., 2013).
As seen from the RMS values in table 1 subject 5
has significantly higher RMS values. This is mainly
caused by eight subsequent high values of individual
heart cycle MAPs in the middle blood pressure peak.
These values, which differ from the shape of the
curve, can be seen in figure 6. During the same
blood pressure peak, also divergent heart rate
measurements were observed with both systems
(figure 5). Excluding these eight MAP values lowers
the RMS values to the level of the other subjects
(not shown).
According to the British Hypertension Society
standard, a blood pressure device falls into the
category Grade A if it complies with a cumulative
percentage (CP) of the readings within ±5mmHg >
60%, CP at ±10 mmHg > 85% and CP at ±15 mmHg
> 95%. This standard is defined for systolic and
diastolic blood pressure, and is mostly used for cuff
based equipment measuring slow changes in blood
pressure (measurement time is 20s-60s). The hand
grip manoeuvre test induced pronounced changes for
a short period of time and therefore it was only
possible to average about ten heart beats (5s-10s).
The subjects in this test was only tested once,
therefor there are not enough data to calculate the
calibration curve, and subsequently see how a new
dataset fits into this. Calculating the error for the
points used to make the calibration curve 85% of the
measurements are within 10 mmHg, 90% of the
measurements are within ±15mmHg, but only 25%
within 5 mmHg. Max deviation are 20 mmHg. The
MAP estimations diverging most from the estimated
relationship are caused by the high MAP readings
for test subject 5 described in the former section.
The test setup with short periods of induced high
blood pressure and test equipment measuring on
different locations of the body, makes the result
vulnerable for short time deviations and anomalies.
This must be taken into account when planning a
more thorough verification test.
These results are very promising taking into
account the demanding tests and the known
weaknesses in the current version of test equipment.
The raw signal sampling rate used in this study are
too low and more work has to be done to improve
the signal filtering (adaptive filtering) and
algorithms for B-point detection. These changes may
be implemented in the embedded software in the
device. It may also be necessary to improve the PPG
sensor through hardware improvements, the
IsenseU-BP+ is prepared for a second LED. In
addition, there are some uncertainties in the
reference measurements when it comes to
calibration and differences between central and
finger blood pressure.
Based on this it is reasonable to assume that the
estimation of PTT and correlation with MAP can be
further improved, and that a grade A classification is
possible with the current design. These
improvements may also make the equipment
suitable for studying beat-to-beat variations.
5 CONCLUSIONS
We have presented IsenseU-BP+, a new compact
wearable device suitable for both female and male
users. The first testing shows that it is feasible to
make an easy to use device to monitor blood
pressure changes and possibly additional heart
parameters. More effort has to be put into the PPG
sensor design and the signal processing algorithms
for characteristic point's detection to get stable and
reliable results for a wide variety of persons. Testing
during activity is also needed. The device has to be
tested on a wide range of persons (different gender,
age and BMI) to show that a manageable calibration
regime for PTT to blood pressure calculation is
feasible.
ACKNOWLEDGEMENTS
The research leading to these results has been
carried out within the d-LIVER integrated project,
which has received funding from the European
Union's Seventh Framework Programme (FP7/2007-
2013) under grant agreement no. 287596.
An Unobtrusive Wearable Device for Ambulatory Monitoring of Pulse Transit Time to Estimate Central Blood Pressure
185

REFERENCES
Budidha, K. and Kyriacou, P. A. (2014) 'Investigation of
Pulse Transit Times utilizing multisite reflectance
photoplethysmography under conditions of artificially
induced peripheral vasoconstriction' (2014)
Engineering in Medicine and Biology Society
(EMBC), 2014 36th Annual International Conference
of the IEEE, Chicago, IL, USA, 26-30 Aug. 2014,
IEEE, pp.1965-1968.
Buxi, D., Redouté, J-M. and Yuce, M. R. (2015) 'A survey
on signals and systems in ambulatory blood pressure
monitoring using pulse transit time' Physiological
Measurement, 36(3), Available at:
http://iopscience.iop.org/article/10.1088/0967-
3334/36/3/R1/pdf;jsessionid=E37F6D1B13B8EA4CD
978D45CE2CAE5FC.c1.iopscience.cld.iop.org
(Accessed: 4. Nov. 2015).
Ilies, C., Grudev, G., Hedderich, J., Renner, J., Steinfath,
M., Bein, B., Haake, N., Hanss, R. (2015),
'Comparison of a continuous noninvasive arterial
pressure device with invasive measurements in
cardiovascular postsurgical intensive care patients: a
prospective observational study', European Journal of
Anaesthesiologie, 32(1), pp20-28.
Mancia, G., Fagard, R., Narkiewicz, K., Red´on, J.,
Zanchetti, A., Böhm, M., Christiaens, T., Cifkova, R.,
De Backer, G., Dominiczak, A., Galderisi, M.,
Grobbee, D. E., Jaarsma, T., Kirchhof, P., Kjeldsen, S.
E., Laurent, S., Manolis, A. J., Nilsson, P. M.,
Ruilope, L. M., Schmieder, R. E., Sirnes, P. A.,
Sleight, P., Viigimaa, M., Waeber, B., and Zannad, F.
(2013) '2013 ESH/ESC Guidelines for the
management of arterial hypertension: The Task Force
for the management of arterial hypertension of the
European Society of Hypertension (ESH) and of the
European Society of Cardiology (ESC),' J.
Hypertension, 31(7), pp. 1281–1357.
Muehlsteff, J., Aubert, X. L. and Schuett, M. (2006),
'Cuffless estimation of systolic blood pressure for
short effort bicycle tests: The prominent role of the
pre-ejection period', Engineering in Medicine and
Biology Society, 2006. EMBS '06. 28th Annual
International Conference of the IEEE, New York, NY,
USA, 30 Aug.-3 Sept. 2006, IEEE, pp. 5088–5092.
Muehlsteff, J., Aubert, X.L. and Morren, G. (2008)
'Continous Cuff-less Blood Pressure Monitoring based
on the Pulse Arrival Time Apporch: The Impact of
Posture' Engineering in Medicine and Biology Society,
2008. EMBS 2008. 30th Annual International
Conference of the IEEE, Vancouver, BC, Canada, 20-
25 Aug. 2008, IEEE, pp. 1691–1694.
Nichols, W. W. and O’Rourke, M. F. (2005) McDonald’s
Blood Flow in Arteries. London, U.K.: Oxford Univ.
Press.
O'Brien, E., Atkins, N., Stergiou, G., Karpettas, N., Parati,
G., Asmar, R., Imai, Y, Wang, J., Mengden, T. and
Shennan, A. (2010) 'European Society of
Hypertension International Protocol revision 2010 for
the validation of blood pressure measuring devices in
adults', Blood Pressure Monitoring, 15(1), pp 23-38.
Patterson, R. P. (2010) 'Impedance cardiography: What is
the source of the signal? 'Journal of Physics:
Conference Series', 224(1), available at :
http://iopscience.iop.org/article/10.1088/1742-
6596/224/1/012118/pdf (Accessed: 4. Nov. 2015).
PhysioFlow Hemodynamics Redefined, Available at:
http://www.physioflow.com/ (Accessed: 26 Aug.
2015).
Proença, J., Muehlsteff, J., Aubert, X. L. and Caravalho, P.
(2010) 'Is Pulse Transit Time a good indicator of
Blood Pressure changes during short physical exercise
in a young population?' Engineering in Medicine and
Biology Society (EMBC), 2010 Annual International
Conference of the IEEE, Buenos Aires, Argentinga, 31
Aug.-4 sept. 2010, IEEE, pp. 598-601.
Rothwell, P. M., Howard, S. C., Dolan, E., O'Brien, E.,
Dobson, J. E., Dahlöf, B., Sever, P.S. and Poulter,
N.R. (2010) 'Prognostic significance of visit-to-visit
variability, maximum systolic blood pressure, and
episodic hypertension', Lancet, 375(9718), pp 895–
905.
Solà, J., Proença, M., Ferrario, D., Porchet, J.-A., Falhi,
A., Grossenbacher, O., Allemann, Y., Rimoldi, S. F.
and Sartori, C. (2013) 'Noninvasive and Nonocclusive
Blood Pressure Estimation Via a Chest Sensor',
Biomedical Engineering, IEEE Transactions on,
60(12), pp 3505-3513.
Solà, J., Chételat, O., Sartori, C., Allemann, Y. and
Rimoldi, S. F. (2011) 'Chest Pulse-Wave Velocity: A
Novel Approach to Assess Arterial Stiffness',
Biomedical Engineering, IEEE Transactions on,
58(1), pp 215-223.
Tan, K. H., Lai, F. O., Hwang, N. C. (2006) 'Measurement
of cardiac output using Physio Flow with different
positions of electrode placement', Singapore Med.
Journal', 47(11), pp967-70.
van Lien R., Schutte, N. M., Meijer, J.H. and de Geus, E.
J. (2013) 'Estimated preejection period (PEP) based on
the detection of the R-wave and dZ/dt-min peaks does
not adequately reflect the actual PEP across a wide
range of laboratory and ambulatory conditions', Int. J.
Psychophysiol, 87(1), pp 60–69.
ViSiMobile, Available at: http://www.visimobile.com/
(Accessed: 26 Aug. 2015).
Wagner, J. Y., Negulescu, I., Schöfthaler, M.,
Hapfelmeier, A., Meidert, A. S., Huber, W., Schmid,
R. M. and Saugel, B. (2015) 'Continuous noninvasive
arterial pressure measurement using the volume clamp
method: an evaluation of the CNAP device in
intensive care unit patients', Journal of Clinical
Monitoring and Computing , 29(6), pp 807-813.
World Health Organization Global Health Observatory
(GHO) data on raised blood pressure, Available at:
http://www.who.int/gho/ncd/risk_factors/blood_pressu
re_prevalence_text/en/ (Accessed: 26 Aug. 2015).
BIODEVICES 2016 - 9th International Conference on Biomedical Electronics and Devices
186
