
Detection of P300 based on Artficial Bee Colony
Süleyman Abdullah Aytekin
1
and Tuba Kıyan
2
1
Department of Biomedical Engineering, Namik Kemal University, Tekirdag, Turkey
2
Department of Electronics and Communication Engineering, Yildiz Technical University, Istanbul, Turkey
Keywords: P300, Artificial Bee Colony, Brain-Computer Interface.
Abstract: A Brain-Computer Interface (BCI) is a system that allows users to communicate with their environment
through cerebral activity. P300 signal, which is used widely in BCI applications, is produced as a response
to a stimulus and can be measured in the parietal lobe of the brain. In this paper, an approach which is a
swarm intelligence technique, called Artificial Bee Colony (ABC) together with Multilayer Perceptron
(MLP) is used for the detection of P300 signals to achieve high accuracy. The system is based on the P300
evoked potential and is tested on four healthy subjects. It has two main blocks, feature extraction and
classification. In the feature extraction block, Power Spectrum Density (PSD) is used whereas ABC was
employed to train Multi Layer Perceptron (MLP) in the classification part. This method is compared to other
methods such as Linear Discriminant Analysis (LDA) and Support Vector Machine (SVM). The best result
that is achieved in this work is 99.8%.
1 INTRODUCTION
A BCI is a system that allows a person to control or
communicate with a computer by using brain
signals. In various BCI systems,
electroencephalography (EEG) is still the most
common method because of being non-invasive. By
analyzing the EEG activities recorded from the
scalp, a computer can recognize the signal and
translate it to specific commands for output devices
such as a computer application or neuroprothesis in
order to accomplish user’s desired activity (Wolpaw
et al., 2002).
Infrequent or particularly significant visual
stimuli, when interspersed with frequent or routine
stimuli, evoke a positive peak at about 300 ms in the
EEG over parietal cortex. Donchin and et all have
used this ‘p300’ or ‘oddball’ response in a BCI
(Farwell and Donchin, 1988). Oddball paradigm
states that: “Rare expected stimuli produce a positive
deflection in the EEG after about 300 ms”. This
P300 component is present in nearly every human
(Rakotomamonjy and Guigue, 2008). P300 signal
can be seen in Figure 1. (Wolpaw et al., 2002).
They proposed a speller system based on P300,
which subjects were able to spell words by
sequentially choosing letters from the alphabet
(Serby et al., 2005). A 6x6 matrix containing the
letters of the alphabet and other symbols was
displayed on a computer screen. Rows and columns
of the matrix were flashed in random order. In order
to select a symbol, subjects count how often it was
flashed. Flashes of the row or column containing the
desired symbol evoked P300-like EEG signals,
while flashes of other rows and columns
corresponded to neutral EEG signals.
The target symbol could be inferred with a
simple algorithm that searched for the row and
column which evoked the largest P300 amplitude.
Since the work of Farwell and Donchin, many
researchers in the area of P300 based BCI systems
has concentrated on developing new application
scenarios (Polikof et al., 1995, Bayliss, 2003) and on
developing new algorithms for the detection of the
Figure 1: P300 signal (Wolpaw et al., 2002).
Aytekin, S. and Kiyan, T.
Detection of P300 based on Artficial Bee Colony.
DOI: 10.5220/0005696001830189
In Proceedings of the 9th International Joint Conference on Biomedical Engineering Systems and Technologies (BIOSTEC 2016) - Volume 4: BIOSIGNALS, pages 183-189
ISBN: 978-989-758-170-0
Copyright
c
2016 by SCITEPRESS – Science and Technology Publications, Lda. All rights reserved
183

P300 signal from noisy data (Hoffmann et al., 2005,
Kaper et al.,, 2004, Rakotomamonjy et al., 2005;
Thulasidas et al., 2006, Xu et al., 2004).
In this paper, a pattern recognition system is used
for the detection of P300 signals. A five-choice P300
paradigm is tested. Five different images were
flashed in random order with a stimulus interval of
400 ms.
The MLP – ABC model is proposed for the
detection of P300 signals and compared to MLP,
Linear Discriminant Analysis (LDA) and Support
Vector Machine (SVM). Classification accuracies
were obtained for four healthy subjects. MLP trained
with the standard BP algorithm normally utilizes
computationally intensive training algorithms.
2 MATERIALS AND METHODS
A BCI takes EEG signal as input and delivers device
commands as output like any typical communication
system. Between input and output, there are
components that translate input into output.
Proposed BCI system with its elements and their
principal interactions is shown in Fig. 2 and each
element is described in this section in detail. Signal
processing and classification algorithms were
implemented by using MATLAB.
2.1 Data Acquisition
Four subjects are utilized in this study and they are
healthy college students whose ages are between 20
and 26. Three of them are male and the fourth
subject is female. Subjects were facing a screen on
which five images were displayed. The images are a
window shutter, a telephone, a lamp, a door, and a
television (see Fig. 3). The images were selected
according to an application scenario in which users
can control electrical appliances via a BCI system.
The images were flashed in random sequences, one
image at a time. Each flash of an image lasted for
100 ms and no images were shown during the
following 300 ms. One stimulus time is 400 ms.
Figure 2: Design and operation of the BCI system.
Figure 3: The display used for evoking the p300.
Total record time for each subject is five minutes. So
total flashes are 150 times and each image flashed
30 times in total record.
The EEG was recorded at 250 Hz sampling rate
from 64 electrodes which are placed at the standard
positions of the 10-20 international system. EGI
Geodesic EEG System 300 was used for
amplification and analog to digital conversion of the
EEG signals.
2.2 Preprocessing
In this step, in order to eliminate high and low
frequency noise, the signal is passed through a high
pass filter which has a cut off frequency of 0.1 Hz
and a low pass filter which has a cut off frequency of
40 Hz.
Another critical issue is to choose appropriate
channels. In order to avoid large number of channels
used for data recording and to avoid complicated
calculations, eight channels were used including
CFz, CP1, CP2, Fz, Pz, POz, P7 and P8 in this work
(Figure 4).
2.3 Feature Extraction
Before the classification, suitable features are
extracted from the raw signal. The goal of the
feature extraction is to remove noise and other
unnecessary information from the input signals. In
this paper, Power Spectral Density (PSD) method is
utilized which is generally used for characterizing
random processes. It can be calculated with the help
of Fourier Transform (Howard, 2002).
Discrete Fourier Transforms (DFTs) of filtered EEG
are calculated using Equation 1.
X(k) = x(n).e
-j2πkn/N
k=0,1,…N-1 (1)
In Equation 1, x(n) represents the discrete samples
of EEG data and N is the length of the EEG data.
After calculation of DFT (X(k)) of EEG samples,
periodogram of EEG is calculated by using Equation
2. Periodogram may express as a basic of PSD.
P(k) = |X(k)|
2
k=0,1,…,N-1 (2)
BIOSIGNALS 2016 - 9th International Conference on Bio-inspired Systems and Signal Processing
184

For each subject, the EEG signals are recorded for
five minutes. So, there are 75000 samples in five
minutes. We observed P300 signal presence between
200-400 ms after a stimulus is incident on the
computer screen. This interval expresses 50 data
instances. Data separated 1500 segments and each
segment have 50 data instances. Each segment of
PSD is average of own instances of periodograms
and it is calculated Equation 3.
’
(
)
=
∑
(
)
k=0,1,..,N-1 K=50 (3)
As a result, data sample size is reduced from 75000
to 1500 by PSD method. PSD of target samples and
non-target samples for eight channels are shown in
Fig. 4.
2.4 Classification
MLP-ABC scheme was proposed in this study for
classifying P300 and non-P300 signals. The optimal
weights of MLP were obtained by ABC algorithm
which is an optimization algorithm.
(ANN) model that maps sets of input data onto a set
of appropriate outputs. It was first introduced for the
non-linear XOR, and was then successfully applied
to different combinatorial problems.
In classification, we used MLP which has an input
layer, an output layer, and a hidden layer.
Input layer represents EEG channels which are
defined according to international 10-20 system.
The most commonly used three brain regions
(frontal, vertex and parietal) in the literature is
considered for selecting channels. There are eight
neurons (CFz, CP1, CP2, Fz, Pz, Poz, P7 and P8
channels) in the input layer of MLP which are
shown in Fig. 5 in the order of 4, 21, 41,6, 34, 36, 30
a)
b)
Figure 4: a) PSD of target b) PSD of non – target samples.
Figure 5: Electrode placement.
and 44. Each channel represent The output layer
represents presence of P300.
So, there are two possible outputs: P300 or non-
P300 (see Fig. 6). In this study, activation function
is defined as a log-sigmoid function and it is
calculated by using Equation 4.
1
()
1
a
x
fx
e
−
=
+
(4)
where x represents the sum of input and weights
multiplication.
MLP is generally trained by back-propagation (BP)
algorithm. The training of a BP neural network is
carried out by the minimization of an error function.
The error function is defined as the difference
between the actual output and the desired output of
the ANN over a set of training patterns. The weights
assigned to the connections between the neurons
within the ANN are updated at each cycle to
minimize the error function. Training an ANN is an
optimization task since the objective is to find the
optimal set of weights of a neural network which
minimizes the error function.
On the other hand, there are some drawbacks of
using BP algorithm. If the multidimensional search
space has many local optima, BP may not reach the
global minimum successfully. Since, ABC algorithm
has the capability of searching the different
unidentified sections in the solution space to find out
the global minimum, it is used in this study to train
MLP (Shah and Gazali, 2011).
The main idea of using ABC algorithm is to
employ bees to search the best combination of
weights of the MLP network. The optimization task
Detection of P300 based on Artficial Bee Colony
185
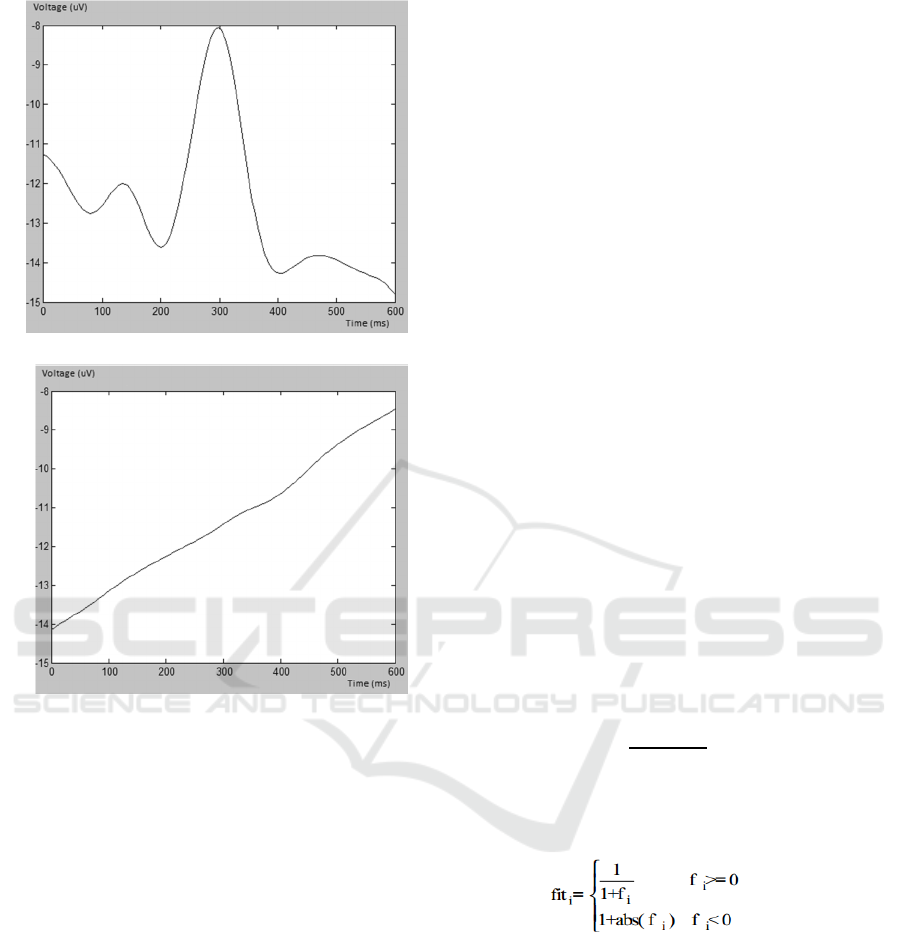
(a)
(b)
Figure 6: Voltage versus time graphs for a) Target (P300)
and b) Non – target (non – P300) signals.
by the ABC algorithm will involve the “bees”
searching for the optimal values of the weights.
Weights of the MLP structure are expressed as food
sources in ABC algorithm. The detailed pseudocode
of ABC algorithm is given in Section III.
3 ARTIFICIAL BEE COLONY
ALGORİTHM
Artificial Bee Colony algorithm (ABC) is an
optimization algorithm and it simulates the
intelligent foraging behaviour of honey bee colonies.
ABC is more successful and most robust on
multimodal functions included in the set with respect
to Differential Evolution (DE) algorithm (Yu and
He, 2006) and Particle Swarm Optimization (PSO)
(Eberhart et al., 2001).
In ABC algorithm (Karaboga and Akay, 2007,
Karaboga, 2005, Basturk and Karaboga, 2006,
Karaboga and Akay, 2009), the colony of artificial
bees consists of three groups: employed bees,
onlookers and scouts. The number of employed bees
is equal to the number of food sources.
The possible solution of the optimization problem in
ABC corresponds to the position of a food source
and the nectar amount of it is related to the quality of
the possible solution. At the first step, the ABC
generates a randomly distributed initial population
of SN solutions (food source positions), where SN
denotes the size of population. Each solution xi (i =
1, 2, ..., SN) is a D-dimensional vector where D is
the number of optimization parameters. After that,
the employed bees, the onlooker bees and scout bees
search the space for solutions in repeated cycles C =
1, 2, ..., MCN During the search process, an
employed bee finds a new food source (new
solution) and checks its nectar amount (fitness
value). If it has a higher nectar amount than that of
the previous one, the bee memorizes the new
position and erases the old one. If not, the position
of the previous one is retained in her memory. After
all employed bees complete the search process; they
share the information of the solution positions with
the onlooker bees. An onlooker bee evaluates the
nectar information taken from all employed bees and
selects a food source with a probability related to its
fitness value. Each onlooker bee chooses a food
source with the probability as given in (5).
=
∑
(5)
where SN is the population size and fit
i
is the fitness
value of the solution x
ij
(6).
(6)
A new food source is produced by an employed bee
as given in (7).
=
+
(
−
) (7)
where
is a random number within [-1,1]. After v
ij
is produced, it is compared to x
ij
solution. As can be
seen from (5), as the difference between the
parameters of the x
i,j
and x
k,j
gets smaller, the
perturbation on the position x
i,j
gets decrease, too.
Thus, as the search approaches to the optima in the
search space, the step length is adaptively reduced.
If the solutions can not be improved by employed
bees, they abandon the food source and it is replaced
BIOSIGNALS 2016 - 9th International Conference on Bio-inspired Systems and Signal Processing
186

with a new food source. Employed bees become
scouts. Scouts make random search in search space
by (8 )
=
+
(
0,1
)
(
−
) (8)
After each candidate source position v
i,j
is produced
and evaluated by the artificial bee, it is compared
with the old one. If the new food has equal or better
nectar than the old source, it is replaced with the old
one in the memory.
Detailed pseudo-code of the ABC algorithm is given
below:
1: Initialize the population of solutions xi,j , i = 1
...SN,j = 1 ...D
2: Evaluate the population
3: cycle=1
4: repeat
5: Produce new solutions υi,j for the employed bees
by using (2) and evaluate them
6: Apply the greedy selection process
7: Calculate the probability values Pi,j for the
solutions xi,j by (1)
8: Produce the new solutions υi,j for the onlookers
from the solutions xi,j selected depending on Pi,j
and evaluate them
9: Apply the greedy selection process
10: Determine the abandoned solution for the scout,
if exists, and replace it with a new randomly
produced solution xi,jby (3)
11: Memorize the best solution achieved so far
12: cycle=cycle+1
13: until cycle=MCN
The aim of the bees is to discover the places of food
sources with high nectar amount and finally the one
with the highest nectar. Artificial bees explore the
multidimensional space for food sources depending
on each bee’s experience and adjust their positions.
Every bee produces new solution area for the
network and the Greedy Selection decides the best
food source position. The food area is limited in the
range of [-20, 20]. If the new food source has equal
or better nectar than the old food source, it is
replaced with the new food source. Otherwise, the
old food source is kept in the memory. Employed
bees and onlooker bees continue searching until the
last cycle to find optimum weights. SN parameter is
selected 50 and MCN parameter is selected 100 in
this work.
4 ABC – MLP COMBINATION
The proposed ABC – MLP algorithm used to
optimize weights for training NN. The bees
(employee, onlooker) search until the last cycle for
finding best weights values for network training.
The food source of which the nectar is neglected by
the bees is replacaed by the scout bees. Every bee
(employee, onlooker) produce new solution for the
network and the greedy selection decide the best
foods source position. The food area is limited in
range apply the randomly and is initialized for
evaluation. This operation is defined by the equation
(7). Every bee produce new evaluated solution area
for the network training. The food contains three
parameters such as range, foods number and
dimension which shown in equation 9, 10 and 11
(Shah and Gazali, 2011).
Foods Area = rand(FN,D).* Range + Lower (9)
(10)
(11)
where a
m*n
shows the range of colony which is equal
to upper bound minus lower bound, FN shows the
number of food source equals the half of the colony
size, L shows the lower bound for the foods area.
The upper and lower bounds are optional while the
most commonly used range is [10, -10], D shows
dimension of foods. The agent of ABC select the
value from foods and is assigned to network. The
bees select the weight from the foods area and
evaluate for fitting to input (Shah and Gazali, 2011).
We hope you find the information in this template
useful in the preparation of your submission.
5 RESULTS
In this study, data instances are reduced from 75000
to 1500 using PSD as mentioned in Section II. Then,
samples are separated as target (150x8) and non-
target (1350x8). Before classification, training
(1000x8) and test (500x8) datasets are created.
Training dataset includes 100 target and 900 non-
target instances whereas test dataset include 50
Detection of P300 based on Artficial Bee Colony
187

target 450 non-target instances. The learning and
momentum rate for MLP are chosen to be 0.5. There
are five neurons in the hidden layer. Some
parameters of the MLP network are shown in Table
I. The performance of the proposed BCI system is
demonstrated in Table II. MLP-ABC method is
compared with other classification algorithms such
as MLP-BP, LDA and SVM in order to demonstrate
its performance. Discriminant type of LDA is
Table 1: Architecture of the MLP Network.
Parameters
Neurons in the input layer
8
Neurons in the hidden layer
5
Neurons in the output layer
1
Transfer function in the hidden layers
Logsig
Table 2: Classification results.
Methods Subjects
Subject
1
Subject
2
Subject
3
Subject
4
ABC + MLP 99.85 99.06 99.59 99.84
MLP 92.75 92.83 92.83 92.83
LDA 93.19 91.27 91.58 91.74
SVM 92.6 92.83 92.83 92.83
‘linear’ which estimates one covariance matrix for
all classes. Kernel function of SVM is ‘polynominal’
which default order is 3.
For all subjects, ABC+MLP approach gives a better
result than other methods.
6 CONCLUSION
The aim of this study is to detect P300 signals by
employing PSD for feature extraction and MLP-
ABC scheme as a classifier. BP is a common
approach for training MLP. The ABC algorithm
combines the exploration and exploitation processes
successfully, which proves the high performance of
training MLP for P300 classification. It has the
powerful ability of searching global optimal
solution. The simulation results show that the
proposed MLP-ABC algorithm can successfully
classify P300 data comparing with the traditional BP
algorithm and some classification algorithms that
include LDA and SVM. It was shown that MLP-
ABC approach shows significantly higher accuracy
in classification than the other methods.
ACKNOWLEDGEMENTS
This research has been supported by Yildiz
Technical University Scientific Research Projects
Coordination Department. Project Number is 2014-
04-03-KAP01.
REFERENCES
Wolpaw, J. R., Birbaumer, N., McFarland, D. J.,
Pfurtscheller, G., Vaughan, T. M., 2002. Brain-
computer interfaces for communication and control,
Clin. Neurophysiol. Vol. 113, Issue 6, pp. 767-791.
Farwell L.A., Donchin E., 1988. Talking of top of your
head: Toward a mental prosthesis utilizing event-
related brain potentials, Journal of Electroensephalogr.
Clin. Neurophy,, Vol. 70, pp. 510–523.
Rakotomamonjy, A., Guigue, V., 2008. BCI competition
III: dataset II-ensemble of SVMsfor BCI P300 speller,
IEEE Trans. Biomed. Eng., vol. 55, no. 3, pp. 1147 –
1154.
Serby H., Yom-Tov, E., Inbar G.F., 2005. An improved
P300-based brain-computer interface, IEEE Trans. on
Neural Systems and Rehabilitation Eng., Vol. 13,
Issue 1, pp. 89–98.
Polikoff, J., Bunnell, H., Borkowski, W., 1995. Toward a
P300-based computer interface, Proceedings of the
RESNA '95 Annual Conference.
Bayliss, J. D., 2003. Use of the evoked P3 component for
control in a virtual apartment, IEEE Trans. Neural
Syst. Rehab. Eng., Vol. 11, Issue 2, pp. 113-116.
Hoffmann, U., Garcia, G. N., Diserens, K., Vesin,J.-M.,
Ebrahimi, T., 2005. A boosting approach to P300
detection with application to brain-computer
interfaces, Proceedings of the IEEE EMBS Neural
Engineering Conference, pp. 97-100.
Kaper, M., Meinicke, P., Grosskathoefer, U.,Lingner, T.,
Ritter, H., 2004. Support vector machines for the P300
speller paradigm, IEEE Trans. Biomed. Eng. Vol. 51,
Issue 6, pp. 1073-1076.
Rakotomamonjy, A., Guigue, V., Mallet, G., Alvarado, V.,
2005. Ensemble of SVMs for improving brain-
computer interface P300 speller performances,
Proceedings of International Conference on Neural
Networks (ICANN), pp.45-50.
Thulasidas, M., Guan, C.,Wu, J., 2006. Robust
classification of EEG signal for brain-computer
interface, IEEE Trans. Neural Syst. Rehab. Eng. Vol.
14, Issue 1, pp. 24-29.
Xu, N., Gao, X., Hong, B., Miao, X., Gao, S., Yang, F.,
2004. BCI competition 2003 Data Set IIb: Enhancing
P300 wave detection using ICA-based subspace
projections for BCI applications, IEEE Trans. Biomed.
Eng., Vol. 51 Issue 6, pp. 1067-1072.
Howard, R. M., 2002. Principles of Random Signal
Analysis and Low Noise Design: The Power Spectral
BIOSIGNALS 2016 - 9th International Conference on Bio-inspired Systems and Signal Processing
188

Density and its Application, Wiley-IEEE Press, pp.
59-60.
Shah, H., Gazali R., 2011. Prediction of Earthquake
Magnitude by an Improved ABC-MLP, Developments
in E-systems Engineering (DeSE), pp. 312-317.
Yu, B., He, X., 2006. Training Radial Basis Function
Networks with Differential Evolution, IEEE
International Conference, pp. 369–372.
Eberhart, R.C., Shi, Y., Kennedy, J., 2001. Swarm
Intelligence, Morgan Kaufmann.
Karaboga, D., Akay B., 2007. Artificial Bee Colony
(ABC) Algorithm on Training Artificial Neural
Networks, Signals Processing and Communications
Applications.
Karaboga, D., 2005. An Idea Based On Honey Bee Swarm
For Numerical Optimization, Technical Report-TR06,
Erciyes University, Engineering Faculty, Computer
Engineering Department.
Basturk, B., Karaboga, D., 2006. An Artificial Bee Colony
(ABC) Algorithm for Numeric function Optimization,
IEEE Swarm Intelligence Symposium.
Karaboga, D., Akay, B., 2009. A comparative study of
Artificial Bee Colony algorithm, Applied Mathematics
and Computation, Vol. 214, Issue 1, pp.108–132.
Detection of P300 based on Artficial Bee Colony
189
