
Trusting Different Information Sources in a Weather Scenario:
A Platform for Computational Simulation
Rino Falcone, Alessandro Sapienza and Cristiano Castelfranchi
Institute for Cognitive Sciences and Technologies, ISTC – CNR, Rome, Italy
Keywords: Trust Evaluation, Information Sources, Social Simulation.
Abstract: Thinking about a scenario with possible risk of flooding and landslides caused by weather conditions, it
results really interesting to investigate the way in which citizens take decisions on the basis of different
information sources they can access. In this work we start describing a platform we realized in order to
study this social phenomenon. Then we present some simulative experiments showing how a population of
cognitive agents trusting in a different way their information sources can make decisions more or less suited
to the several weather patterns. The complexity of decisions is based on the fact that the agents differently
trust the various sources of information, which in turn may be differently trustworthy. In our simulations we
analyse some interesting case studies, with particular reference to social agents that need to wait others in
order to make decision.
1 INTRODUCTION
Dealing with information, there is not just the
problem of finding information, but it also necessary
to select the most reliable information sources
(Falcone et al, 2015), with respect to the scope of
information. In case of the weather forecast we can
consider different sources: official bulletin of
authorities, the direct evaluation of some agents
during the meteorological event, our own evaluation,
and so on. Some of these sources are not correlated
among them (a forecast is referred to mathematical
model of the weather linked to its previous data,
while a direct evaluation can be based on a current
perception of the phenomenon). Then it is necessary
to integrate these sources and at the same time to
define their trustworthiness. For trusting an
information source (S) we used a cognitive model
(Castelfranchi and Falcone, 2010) based on the
dimensions of competence and reliability/motivation
of this source. These competence and reliability
evaluations can derive from different reasons,
basically:
Previous direct experience with S on that
specific information content;
Recommendations (other individuals Z
reporting their direct experience and
evaluation about S) or Reputation (the
shared general opinion of others about S)
on that specific information content (Conte
and Paolucci, 2002) (Jiang, 2013) (Sabater-
Mir, 2003) (Sabater-Mir and Sierra, 2001)
(Yolum and Singh, 2003);
Categorizations of S (it is assumed that a
source can be categorized and that it is
known this category), exploiting inference
and reasoning (analogy, inheritance, etc.):
on this basis it is possible to establish the
competence/reliability of S on that specific
information content (Burnett et al, 2010)
(Burnett et al, 2013) (Falcone and
Castelfranchi, 2008) (Falcone et al, 2013).
However, as the trust model is not the main part of
this paper, we simplified it, omitting the complex
analysis that defines trust in the different sources.
Our focus is on the integration of the information
sources also based on their trustworthiness. In
particular, we are interested in analysing how
different populations of cognitive agents (composed
by different percentage of agents who rely on
various sources) react to the various weather
situations and how many of them take the right
decision (given the real weather).
Following we present the platform we realized in its
entirely, to show all its capability. However in the
simulation scenarios we use a simplified version of
it.
Falcone, R., Sapienza, A. and Castelfranchi, C.
Trusting Different Information Sources in a Weather Scenario: A Platform for Computational Simulation.
DOI: 10.5220/0005695501650172
In Proceedings of the 8th International Conference on Agents and Artificial Intelligence (ICAART 2016) - Volume 1, pages 165-172
ISBN: 978-989-758-172-4
Copyright
c
2016 by SCITEPRESS – Science and Technology Publications, Lda. All rights reserved
165

2 TRUST FOR SOURCE
EVALUATION
Given the complexity of simulations, we chose to
use a relatively simple trust model, letting many
parameters being unified in just one.
Trust decision in presence of uncertainty can be
handle using uncertainty theory (Liu, 2014) or
probability theory. We decided to use the second
approach, as in this platform agents know a priori all
the possible events that can happen and they are able
to estimate how much it is plausible that they occur.
In particular we exploit Bayesian theory, one of the
most used approach in trust evaluation (Quercia et
al, 2006) (Melaye and Demazeau, 2005) (Wang and
Vassileva, 2003).
In this model each information source S is
represented by a trust degree called
, with 0≤ 1,
plus a Bayesian probability distribution PDF
1
(Probability Distribution Function) that represents
the information reported by S.
The trust model allows the possibility of many
events: it just split the domain in the corresponding
number of interval. In this work we use three
different events (described below), then the PDF
will be divided into three parts.
The parameter is used to
smooth the information referred by S. This is the
formula used for transforming the reported PDF:
11∗
The output of this step is called Smoothed PDF
(SPDF). We will have that:
The greater
is, the more
similar the SPDF will be to the PDF; in
particular if
=1=>
SPDF=PDF;
The lesser it is, the more the SPDF will be
flatten; in particular if
=0 => SPDF is a uniform distribution with
value 1.
The idea is that we trust on what S says
proportionally to how much we trust it. In words, the
more we trust S, the more we tend to take into
consideration what it says; the less we trust S, the
more we tend to ignore its informative contribution.
We define GPDF (Global PDF) the evidence that an
agent owns concerning a belief P. Once estimated
the SPDFs for each information source, there will be
a process of aggregation between the GPDF and the
1
It is modeled as a distribution continuous in each interval
SPDFs. Each source actually represents a new
evidence E about a belief P. Then to the purpose of
the aggregation process it is possible to use the
classical Bayesian logic, recursively on each source:
|
|
∗
where:
f(P|E) = GPDF (the new one)
f(E|P) = SPDF;
f(P) = GPDF (the old one)
In this case f(E) is a normalization factor, given
by the formula:
|
∗
In words the new GPDF (the global evidence
that an agent has about P) is computed as the
product of the old GPDF and the SPDF, that is the
new contribute reported by S. As we need to ensure
that GPDF is still a probability distribution function,
it is necessary to scale it down
2
, using the
normalization factor f(E).
3 THE PLATFORM
Exploiting NetLogo (Wilensky, 1999), we created a
very complex and complete platform, where a lot of
parameters are taken into account to model a variety
of situations. However we didn’t use it in its
fullness, but we made some simplifications to shape
our scenarios.
3.1 The Context
Given a population distributed over a wide area,
some weather phenomena happen in the world with
a variable level of criticality. The world is populated
by a number of cognitive agents (citizens) that react
to these situations, deciding how to behave, on the
basis of the information sources they have and of the
trustworthiness they attribute to these different
sources: they can escape, take measures or evaluate
absence of danger.
In addition to citizens, there is another agent
called authority. Its aim is to inform promptly
citizens about the weather phenomena. Moreover the
authority will be characterized by an uncertainty,
expressed in terms of standard deviation.
2
To be a PDF, it is necessary that the area subtended by it
is equal to 1.
ICAART 2016 - 8th International Conference on Agents and Artificial Intelligence
166

3.2 Information Sources
To make a decision, each agent consults a set of
information sources, reporting to it some evidence
about the incoming meteorological phenomena.
There are three kinds of information sources
(whether active or passive) available to agents:
1. Their personal judgment, based on the
direct observation of the phenomena.
Although this is a direct and always true (at
least in that moment) source, it has the
drawback that waiting to see what happens
could lead into a situation in which it is no
more possible to react in the best way (for
example there is no more time to escape if
one realizes too late the worsening
weather).
2. Notification from authority: the authority
distributes into the world weather forecast
with associated different alarm signals,
preparing citizens to the events. This is the
first informative source that agents have.
3. Others’ behavior: agents are in some way
influenced by community logics, tending to
partially or totally emulate their neighbors
behavior.
The personal judgment and the notification from the
authority are provided as clear signals: all the
probability is focused on a single event. Conversely,
for others’ behavior estimation the probability of
each event is directly proportional to the number of
neighbors making each kind of decision. If no
decision is available, the PDF is a uniform
distribution with value 1.
3.3 Costs and Damages
Agents’ performances are measured in terms of costs
and damages, both at an individual/personal level
and at a community/public level. We define cost
whatever an agent has to pay if it takes a given
decision. For instance, escaping could have the cost
of moving from a place to another and possibly to
lose the value of its own home; taking measures to
avoid possible damages could result in home quick
repairs etc. Then we define damage whatever an
agent has to pay if it takes a wrong decision: if an
agents didn’t make home quick repairs, it’s home
could have been damaged; if it is not escaped, it
could have been injured and then end up in hospital.
3.4 Agents Description
At the beginning of the simulation, the world is
populated by a number of agents belonging to four
categories. The main difference between them lays
in how much trust they have in their information
sources:
1. Self-trusting agents prefer to rely on their
own capabilities and direct experience,
having a high level of trust in their self;
they need to see the phenomena to make a
decision, but as a consequence they need
more time to take a decision. For this kind
of agents the trust values are: self trust 0.9;
authority trust 0.3; community trust 0.3.
2. Authority-trusting agents put trust mainly
on what the authority says, so they are the
first to make a decision (weather forecast
are distributed in advance with respect to
phenomena): self trust 0.3; authority trust
0.9; community trust 0.3;
3. Social-trusting agents model agents that are
influenced by social dynamics; they need to
see what other agents choose and then they
follow the majority: self trust 0.3; authority
trust 0.3; community trust 0.9;
4. Equal-trusting agents are just naïve agents
that tend to believe to anything: self trust
0.9; authority trust 0.9; community trust
0.9;
These trust degrees are then used to apply the trust
model above described.
3.5 World Description
The world is made by 32x32 patches that wraps both
horizontally and vertically. It is geographically
divided in 4 quadrants of equal dimension, where
agents are distributed in a random way. The
quadrants differs in the possible weather phenomena
that happens, modeled through the presence of
clouds:
1. No event: there is just a light rain, from 1 to
29 clouds;
2. Medium event: there is heavy rain, that can
make damages to agents or their properties;
form 30 to 89 clouds;
3. Critical event: a tremendous event due to
too high level of rain, with possible risks
for the agents’ sake; from 90 clouds on.
These phenomena are not instantaneous, but they
happen progressively in time. In particular, in each
quadrant it will be added a cloud on each tick until
the phenomena is completed.
The four quadrants are independent from each
other but there can be an indirect influence as agents
can have neighbors in other quadrants.
Trusting Different Information Sources in a Weather Scenario: A Platform for Computational Simulation
167
These events are also correlated to the alarms
that the authority raises through its standard
deviation. We use it to produce the alarm generated
by the authority and from it depends the correctness
of the prediction.
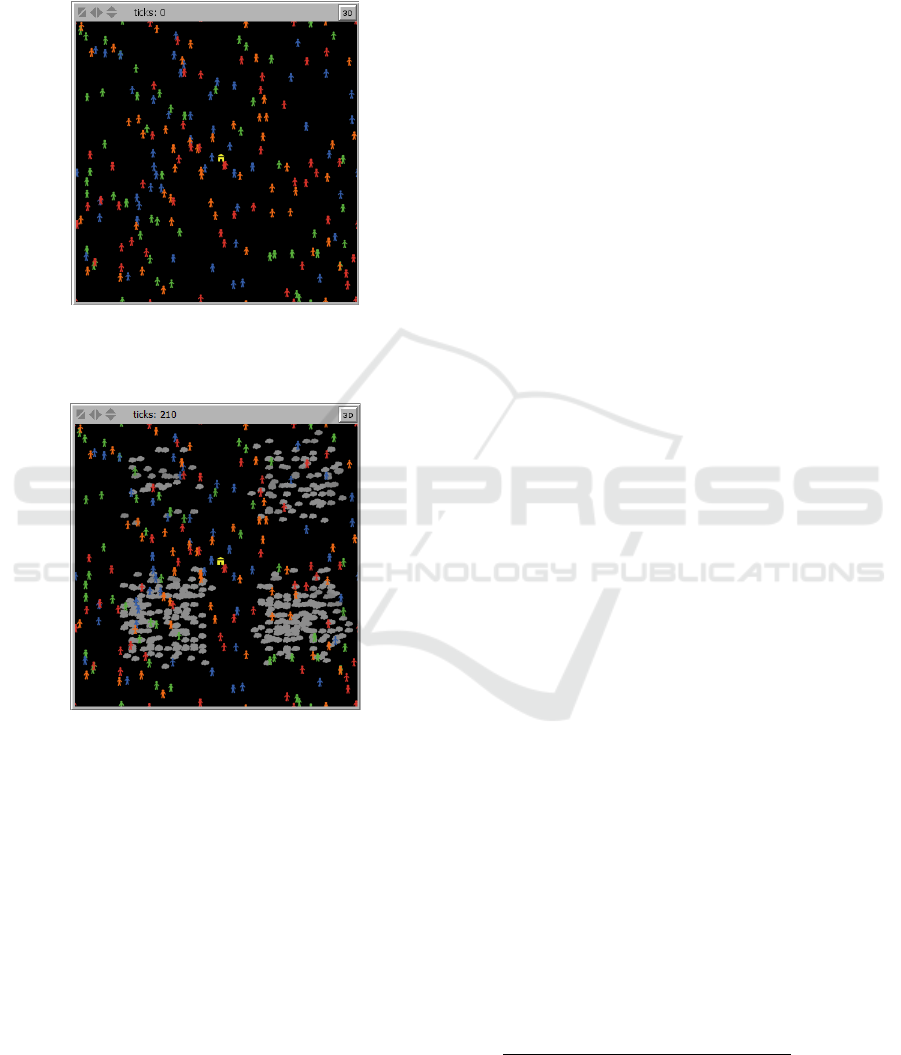
Figure 1: a world example. There are 200 agents (50 per
category) plus the authority that is represented by the
yellow house.
Figure 2: An example of world after an event. Starting
from the quadrants in the upper left and proceeding
clockwise, we can see events 1, 2, 3 and 3.
3.6 Workflow
We start generating a world containing an authority
and a given number of agents belonging to different
categories. At the time t
0
the authority raises an
alarm, reporting the level of criticality of the event
that is going to happen in each quadrant (critic = 3,
mean = 2, none =1). Being just a forecast, it is not
sure that it is really going to happen. However, as a
forecast, it allows agents to evaluate the situation in
advance, before the possible event, that starts
randomly from t
20
to t
31
3
.
During the decision making phase, agents check
their own information sources, aggregating the
single contributes according to the corresponding
trust values. They estimate the possibility that each
event happens and take the choice that minimizes
the risk. Then they choose how to behave.
While agents collect information they are
considered as “thinking”, meaning that they have not
decided yet. When this phase reaches the deadline,
agents have to make a decision, that cannot be
changed anymore. This information is then available
for the other agents (neighborhood), that can in turn
exploit it for their decisions.
Then agents pay the cost of their decisions and
maybe even some damages. In the end costs and
damages for agents and authority both are computed
to estimate the result.
3.7 The Decision-Making Phase
Once consulted all the three sources of information,
agents subjectively estimate the probability that each
single event happens.
The designed platform offers two way to proceed in
the decision-making phase:
1. The cost-damage mode: agents know costs
and damages relative to the possible
choices and they take into account some
considerations concerning that. In this case
agents choose trying to minimize the sum
of costs and damages
2. The probability mode: in this second mode,
agents just take into account probabilities;
then they aim to react according to the
event that is consider more likely to
happen.
In both cases there are three possible choices:
1. Escape: agents abandon their homes.
2. Take measures: agents take some measure
(quick repairs) to avoid possible damages
due to weather event;
3. Ignore the problem: agents continue doing
their activities, regardless of possible risks.
Concerning the cost-damage mode, we define then:
1.
_
= probability that there is a
critical event;
2.
_
= probability that there is a
medium event;
3
This has been made in order to ensure that self-trusting
agents cannot always see the whole critical event.
ICAART 2016 - 8th International Conference on Agents and Artificial Intelligence
168

3.
_
= probability that there is no
event;
4.
= costs due to the decision to
escape;
5.
_
= costs due to the decision
to take measures;
6.
= costs, if any, due to the decision
to ignore the possible risk;
7.
= damages that an agent could have
if it should have escaped, but it did not;
8.
_
= damages that an agent
could have if it should have took measures,
but it did not;
9.
= damages that an agent could have
if it should have ignored the problem, but
it did not;
Agents estimate the decisional effort as follow:
_
∗
_
_
∗
_
_
_
∗
_
∗
_
∗
_
∗
_
In words, each decision has a cost that agents have
to pay in any case. If their choice was right, they will
not have penalties, otherwise they will pay a damage
that depends on the events that happens. While
estimating which decision is more convenient, the
possible damages are weighted considering the
probability that the event happens. The agent will
reason about what is the best choice and it will take
the decision that minimizes the decisional effort,
namely the one that probabilistically carries less
risks. It is worth noting that while costs and damages
are equal for all the agents, probabilities are
subjectively estimated.
Each decision has also an effect on the whole
community/administration. In fact even authority
owns, like the agents, costs and damages that
however are indirectly due to decisions took by each
single agents.
As identifying weights properly could be a really
challenging operation, one could be just interested
simplifying this process, using then the probability
mode. Here agents will take into account:
1.
_
= probability that there is a
critical event;
2.
_
= probability that there is a
medium event;
3.
_
= probability that there is no
event;
Once identified the highest probability, agents will
perform accordingly.
It is worth noting that these two methods are
equal in the case in which:
1.
=
_
=
;
2.
=
_
=
.
3.8 Platform Input
The first thing that can be customized is the agents'
population. It is possible to put any number of
agents belonging to the 4 categories previously
described. Also one can set agents’ decision-
making deadline, customizing their behavior. It is
possible to change the authority reliability,
modifying its standard deviation. Then it is possible
to determine the events that are going to happen on
each quadrant configuring what we call the event
map: it is the set of the four events relative to the
four quadrants, starting from the one top left and
proceeding clockwise.
The last sets of parameters that one can
customize are agents and authority decision cost
and damages. A setting rather than another can
completely change agents’ behavior.
A setting rather than another can completely change
agents’ behavior.
3.9 Results Estimation
For each quadrant, it is possible to exploit a series of
data to understand simulations’ results (actually their
average on 500 runs):
1. Kind of event that actually happens, kind of
alarm raised by the authority and the
corresponding absolute error: example
3(2.92/0.08);
2. Percentage of agents taking each kind of
decision: this data is also available for each
agent category;
3.
Accuracy: how much the decisions taken
by each agents' category are right.
4. Surplus on cost: difference between the
right choice cost (without damages) and
that of the taken choice.
5. Surplus on the authority cost: this
dimension describes how much the single
decisions cost in average from the authority
point of view. There could be situations in
which what is better for the
authority/community is not good for the
individual citizens.
Trusting Different Information Sources in a Weather Scenario: A Platform for Computational Simulation
169
4 SIMULATIONS
We decided to use the realized platform in order to
understand how the decisions of agents preferring
direct experience (self-trusting) or using trusted
sources (authority-trusting) affect, positively or
negatively agents that need others to decide (social-
trusting).
We investigated a series of scenarios, populated
by different percentages of agents belonging to those
three categories, in order to verify the community
behavior.
We tried influencing social-agents with authority
trusting and self trusting agents. In fact, it is
particularly interesting to observe what happen in
presence of divergent sources.
4.1 Scenario: Authority, Self and Social
Simulation setting:
1. Agents population: we tried 7 different
configurations of authority-trusting agents
(AT), self-trusting agents (SeT) and social-
trusting agents (SoT); (100,100, 0), (80,80,
40), (60,60,80), (40,40,120), (20,20,160),
(10,10,180) and (0, 200).
2. Authority reliability: we used the value 0.3
to shape a very reliable authority and 0.9 to
shape an incompetent one.
3. Event map: [1 3 3 2].
4. Cost and damages: we choose to use the
probability mode, so that we didn’t care
about these parameters.
5. Decision making deadline (since the
simulation starts): 30 ticks for AT; a
randomly generated value in the interval
[105,125] ticks for SeT; 115 for SoT.
For sake of simplicity, we report just result of
quadrants 1, 2 and 4, as quadrants 2 and 3 are quite
the same. The following graphs represent the
accuracy of the two populations in each quadrant.
This is a really interesting scenario, as SoT
agents sometime have to deal with discording
sources. In order to better understand the
experiment, let’s analyze what happens when agents
decide.
AT agents decide at time 30. Their decisions are
influenced just by the authority, then they don’t need
extra time to see what is going to happen neither are
interested in what other agents do. Their
performance strictly depends on the authority
accuracy. Plus the whole category will always take
the same decision: there won’t be an AT agent that
decide differently from the others.
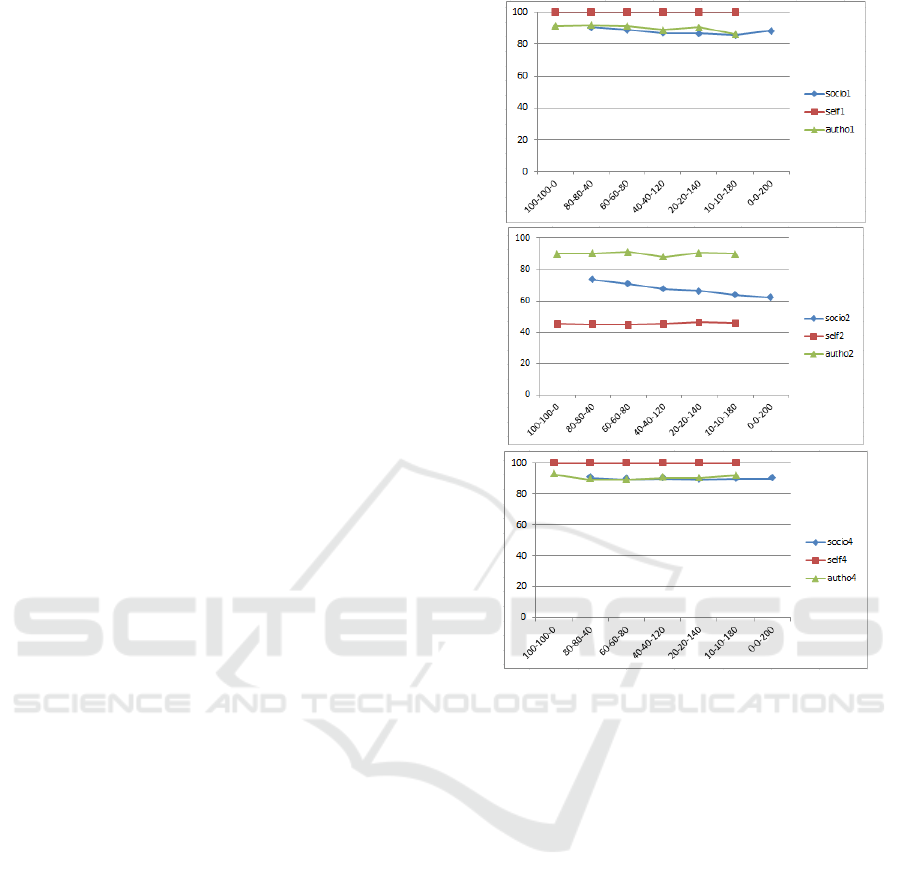
Figure 3: Accuracy in quadrants 1, 2 and 4 when the
authority standard deviation is 0.3.
Concerning SeT agents, they are designed as the
experts inside the population. They are able to
understand the phenomena and decide accordingly.
We assume that the last moment to make a decision
is 125 ticks, but not all of them will take all this time
to decide. Their deadline is randomly generated
inside the interval [105, 125].
Their decision will always be true in case of no
event or medium event, but just a few of them will
be able to see completely a critical event. From the
graph we can see it is about 45% of them.
Finally, SoT agents need to see what others do,
but this means that they will be slower. Supposing
that they will need 10 ticks from the moment in
which they decide to the moment in which they
actually put into practice their decision, we decided
to set their deadline to 115 ticks. This means that at
the moment they decide just half of SeT agents has
decided, moreover it is the part that take the worst
decision as it has the higher probability to do not see
the whole phenomena. Conversely, all AT agents
decided. This means that SoT agents will be mainly
ICAART 2016 - 8th International Conference on Agents and Artificial Intelligence
170
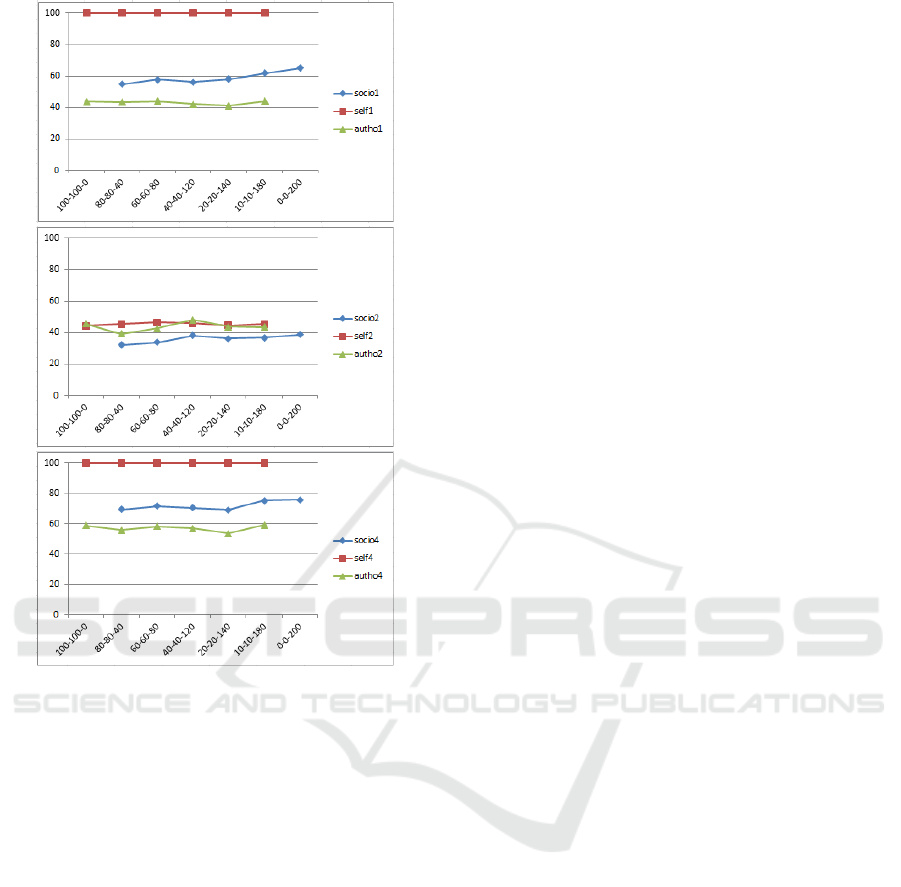
Figure 4: Accuracy in quadrants 1, 2 and 4 when the
authority standard deviation is 0.9.
influenced by AT agents. This is clearly visible in all
the graph: the SoT curve is nearer to AT curve than
SeT curve.
Globally, SoT agents are able to perform well
but they never get the best performance. Actually in
case of case of critical event and high authority
standard deviation they are the worst, but this is
reasonable as they just use wrong information.
In case of medium or no event and low authority
standard deviation, when both SeT and AT agents
perform well and represent good sources, we notice
that SoT agents perform a little worse than them.
This is due to the fact that SoT agents are also
socially influenced by agents in other quadrants,
using information that is correct but in another
context.
5 CONCLUSIONS
In the first part of this work we presented the
platform we realized in order to study citizen
behavior in case of different levels’ weather
phenomena. It is in fact interesting to study how
different citizens react to different stimuli derived by
their information sources. The platform is endowed
with a Bayesian trust evaluation model that allows
citizens to deduce information from their own
information sources. This very complex platform
can be populated by a number of agents/citizens
belonging to a set of predefined categories. In this
case categories are useful to differentiate the
behavior of each agents, specifying how much trust
they have in their information source. In addition to
agents, a lot of parameters can be customized, giving
the possibility to recreate a lot of different
simulation scenarios.
After that, we used the proposed platform with
the aim of studying how agents that need to follow
others behave. We put into the world three kind of
agents weighing information sources differently
(social trusting, authority trusting and self trusting)
and we tried to understand the influence of these last
two on social trusting agents.
Results clearly show that social agents are able
to get good performance, following their information
sources, but they never get optimal results. We also
showed that they are negatively influenced by the
behavior of agents in other quadrants. Although not
well studied, this phenomenon results to be quite
interesting and it could become object of interest
following this research line.
ACKNOWLEDGEMENTS
This work is partially supported by the Project
PRISMA (PiattafoRme cloud Interoperabili per
SMArt-government; Cod. PON04a2 A) funded by the
Italian Program for Research and Innovation
(Programma Operativo Nazionale Ricerca e
Competitività 2007-2013) and the project CLARA—
CLoud plAtform and smart underground imaging for
natural Risk Assessment, funded by the Italian Ministry
of Education, University and Research (MIUR-PON).
REFERENCES
Burnett, C., Norman, T., and Sycara, K. 2010.
Bootstrapping trust evaluations through stereotypes. In
Proceedings of the 9th International Conference on
Autonomous Agents and Multiagent Systems
(AAMAS'10). 241-248.
Trusting Different Information Sources in a Weather Scenario: A Platform for Computational Simulation
171

Burnett, C., Norman, T., and Sycara, K. (2013) Stereotypical
trust and bias in dynamic multiagent systems. ACM
Transactions on Intelligent Systems and Technology
(TIST), 4(2):26, 2013.
Castelfranchi C., Falcone R., Trust Theory: A Socio-Cognitive
and Computational Model, John Wiley and Sons, April
2010.
Conte R., and Paolucci M., 2002, Reputation in artificial
societies. Social beliefs for social order. Boston: Kluwer
Academic Publishers.
Falcone R, Castelfranchi C, (2008) Generalizing Trust:
Inferencing Trustworthiness from Categories. In
Proceedings, pp. 65 - 80. R. Falcone, S. K. Barber, J.
Sabater-Mir, M. P. Singh (eds.). Lecture Notes in Artificial
Intelligence, vol. 5396. Springer, 2008.
Falcone R., Piunti, M., Venanzi, M., Castelfranchi C., (2013),
From Manifesta to Krypta: The Relevance of Categories
for Trusting Others, in R. Falcone and M. Singh (Eds.)
Trust in Multiagent Systems, ACM Transaction on
Intelligent Systems and Technology, Volume 4 Issue 2,
March 2013.
Falcone, R., Sapienza, A., & Castelfranchi, C. (2015).
Trusting Information Sources Through Their
Categories. In Advances in Practical Applications of
Agents, Multi-Agent Systems, and Sustainability: The
PAAMS Collection (pp. 80-92). Springer International
Publishing.
S. Jiang, J. Zhang, and Y.S. Ong. An evolutionary model for
constructing robust trust networks. In Proceedings of the
12th International Conference on Autonomous Agents and
Multiagent Systems (AAMAS), 2013.
B. Liu, Uncertainty theory 5
th
Edition, Springer 2014.
Quercia, D., Hailes, S., & Capra, L. (2006). B-trust: Bayesian
trust framework for pervasive computing. In Trust
management (pp. 298-312). Springer Berlin Heidelberg.
Melaye, D., & Demazeau, Y. (2005). Bayesian dynamic trust
model. In Multi-agent systems and applications IV (pp.
480-489). Springer Berlin Heidelberg.
Sabater-Mir, J. 2003. Trust and reputation for agent societies.
Ph.D. thesis, Universitat Autonoma de Barcelona.
Sabater-Mir J., Sierra C., (2001), Regret: a reputation model for
gregarious societies. In 4th Workshop on Deception and
Fraud in Agent Societies (pp. 61-70). Montreal, Canada.
Wang, Y., & Vassileva, J. (2003, October). Bayesian network-
based trust model. In Web Intelligence, 2003. WI 2003.
Proceedings. IEEE/WIC International Conference on (pp.
372-378). IEEE.
Wilensky, U. (1999). NetLogo.
http://ccl.northwestern.edu/netlogo/. Center for Connected
Learning and Computer-Based Modeling, Northwestern
University, Evanston, IL.
Yolum, P. and Singh, M. P. 2003. Emergent properties of
referral systems. In Proceedings of the 2nd International
Joint Conference on Autonomous Agents and MultiAgent
Systems (AAMAS'03).
ICAART 2016 - 8th International Conference on Agents and Artificial Intelligence
172
