
Smart Monitoring of User’s Health at Home: Performance
Evaluation and Signal Processing of a Wearable Sensor for the
Measurement of Heart Rate and Breathing Rate
Sara Casaccia, Filippo Pietroni, Andrea Calvaresi, Gian Marco Revel and Lorenzo Scalise
Dipartimento di Ingegneria Industriale e Scienze Matematiche, Università Politecnica delle Marche, Ancona, Italy
Keywords: Physiological Parameters, Heart Rate, Breathing Rate, Wearable Sensor, Signal Processing.
Abstract: Nowadays, the monitoring of users’ health status is possible by means of smart sensing devices at low-cost
and with high measuring capabilities. Wearable devices are able to acquire multiple physiological and
physical waveforms and are equipped with on-board algorithms to process these signals and extract the
required quantities. However, the performance of such processing techniques should be evaluated and
compared to different approaches, e.g. processing of the raw waveforms acquired. In this paper, the authors
have performed a metrological characterization of a commercial wearable monitoring device for the
continuous acquisition of physiological quantities (e.g. Heart Rate - HR and Breathing Rate - BR) and raw
waveforms (e.g. Electrocardiogram - ECG). The aim of this work is to compare the performance of the on-
board processing algorithms for the calculation of HR and BR with a novel approach applied to the raw
signals. Results show that the HR values provided by the device are accurate enough (±2.1 and ±2.8 bpm in
static and dynamic tests), without the need of additional processing. On the contrary, the implementation of
the dedicated processing technique for breathing waveform allows to compute accurate BR values (±2.1 bpm
with respect to standard equipment).
1 INTRODUCTION
The improvement of people’s safety and the control
of their health conditions represent the primary
challenges about Smart Home (Sixsmith A. and
Sixsmith J., 2000) and Smart Cities (Revel et al.,
2014). The Italian project Health@Home: Smart
Communities for citizens’ wellness (H@H) aims to
reach such goal through the integration of domotic
and biomedical devices in Smart residential
environments (Abascal, 2004), (Demiris et al., 2006).
Nowadays, acquiring physical (Catal et al., 2015),
(Bayat et al., 2014), (Abdallah et al., 2015) and
physiological (Pantelopoulos and Bourbakis, 2010),
(Parvaneh et al., 2014), (van Andel et al., 2015)
signals from a person is a quite easy task, thanks to
the rapid growth of low-cost Information and
Communications Technologies (ICT). Wearable
sensors are able to measure even more physiological
waveforms (e.g. ECG) in real-time and are equipped
with on-board algorithms, in order to extract the most
interesting values (e.g. HR, BR, etc.), without the
need of additional processing. However, it is
fundamental to provide a metrological
characterization of such devices, especially if they
will be adopted for health care assistance, e.g. the
remote monitoring of chronic patients in outpatients
settings (Appelboom et al., 2014), (Lowe and
Olaighin, 2014).
Several commercially available systems are
described in literature, with details about their
performances and accuracy estimation through
dedicated tests (Kristiansen et al., 2011), (Parak et al.,
2015), (Vanderlei et al., 2008). One example is the
BioHarness
TM
3.0 (BH3) sensing device, which
allows the user to simultaneously measure five
physiological and physical quantities (HR, BR,
Acceleration, Activity level and Posture). Specific
information about validity and reliability of the
proposed device are discussed in (Johnstone et al.,
2012a), (Johnstone et al., 2012b), through dedicated
laboratory tests. Results from field-based tests, i.e.
discontinuous incremental walk-jog-run protocol as
described in (Johnstone et al., 2012c), suggest that the
accuracy of the collected data decreases with the
entity of movement (high uncertainty for treadmill
Casaccia, S., Pietroni, F., Calvaresi, A., Revel, G. and Scalise, L.
Smart Monitoring of User’s Health at Home: Performance Evaluation and Signal Processing of a Wearable Sensor for the Measurement of Heart Rate and Breathing Rate.
DOI: 10.5220/0005694901750182
In Proceedings of the 9th International Joint Conference on Biomedical Engineering Systems and Technologies (BIOSTEC 2016) - Volume 4: BIOSIGNALS, pages 175-182
ISBN: 978-989-758-170-0
Copyright
c
2016 by SCITEPRESS – Science and Technology Publications, Lda. All rights reserved
175
speed > 6 m/s). The good performance of such
equipment makes possible to apply it in several field
of applications, e.g. the continuous monitoring of
sportsmen’s functional state in the conditions of
natural activity (Runova et al., 2012). Other recent
researches underlines the potentials of using this tool
in outpatient settings (Deepika et al., 2015), (Angarita
et al., 2015), (Bakhchina et al., 2014), emergency
department triage (Bianchi et al., 2013), or as a
support tool in the prevention of abnormal events, e.g.
fall detection (Hemalatha and Vaidehi, 2013),
(Sannino et al., 2015). Differently from other
wearable devices, BH3 is able to acquire and store
both raw physiological waveforms (e.g. ECG and
Breathing) and the computed quantities after a
dedicated processing (HR, BR).
The aim of this work is to improve the accuracy
assessment of the BH3, by comparing its
performances in the measure of physiological
quantities (HR, BR) with gold standard techniques
(ECG and respiration belt). In particular, the focus
has been not only in the comparison of the values
computed on-board by the device, but also the ones to
be derived through a dedicated processing of the raw
signals acquired. So, this analysis would allow to
better understand if the values computed by BH3 are
accurate enough without the need of additional
processing or, if needed, to identify the best algorithm
to apply to raw signals.
2 MATERIALS AND METHODS
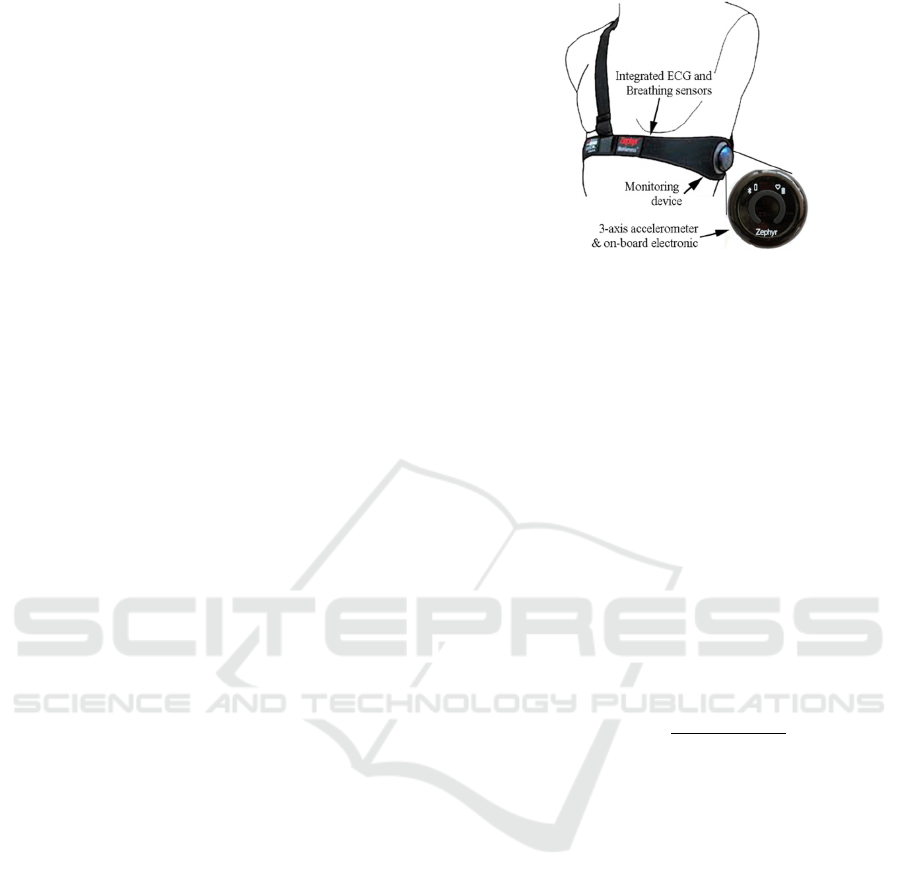
BH3 is a compact physiological monitoring module,
attached to a lightweight Smart Fabric strap or
garment which incorporates ECG and Breathing
detection sensors. This version has been tuned up
with respect to the previous models, in order to
improve its usability and acceptance, e.g. by older
people (Ehmen et al., 2012). The device is directly
worn on the skin (Figure 1) of the participant via an
elasticated strap positioned around the chest (50g,
50mm width). The monitoring device (weight 18g,
28x7mm), which attaches to the left of the chest strap,
can act as both transmitter and data logger. The
internal memory makes it possible to store up to 500
hours of acquisition and the battery life has been
improved respect to previous versions, up to 35 hours
in logging mode. Five quantities are measured
simultaneously, time stamped and exportable to
Excel.
Electrocardiographic raw signal is acquired
through electrode sensors, housed within the chest
strap and sampled at 250 Hz.
Figure 1: BH3 multi-parametric device.
Breathing waveform is collected using a
capacitive pressure sensor (25 Hz) that detects the
circumference expansion and contraction of the torso.
An embedded algorithm uses the pressure change to
create a sinusoidal waveform. Aberrant pressure
changes are filtered to remove unwanted noise, and
the gain for the waveform is automatically centred at
zero (Bianchi et al., 2013). Tri-axial accelerometer
signal is acquired by using piezoelectric technology
(i.e. cantilever beam set up, sampled at 100 Hz). It is
based on a micro electro-mechanical accelerometer
sensor with a capacitive measurement scheme and is
sensitive along the three orthogonal axes (vertical (x),
sagittal (z) and lateral (y)) (Johnstone et al., 2012a).
Acceleration data is measured in gravitational force
(g) in a range of -3 to +3 g on each single axis, or as
Vector Magnitude Units (VMU), which is an
integrated value over the previous one second epoch:
Finally, the posture of the subject is monitored by
using similar piezoelectric technology. Acting as an
inclinometer, data is reported in angular degrees,
ranges between -180° and +180°, monitoring how far
the device is “off the vertical” (Johnstone et al.,
2012a). In addition to the acquisition of the raw
waveforms, the device is able to perform embedded
processing to compute the instantaneous values, e.g.
HR, BR, posture, with an output frequency of 1Hz.
These data are stored in a formatted Excel file and can
also be transmitted by BH3 through wireless
communication protocol (i.e. Bluetooth SPP 2.1).
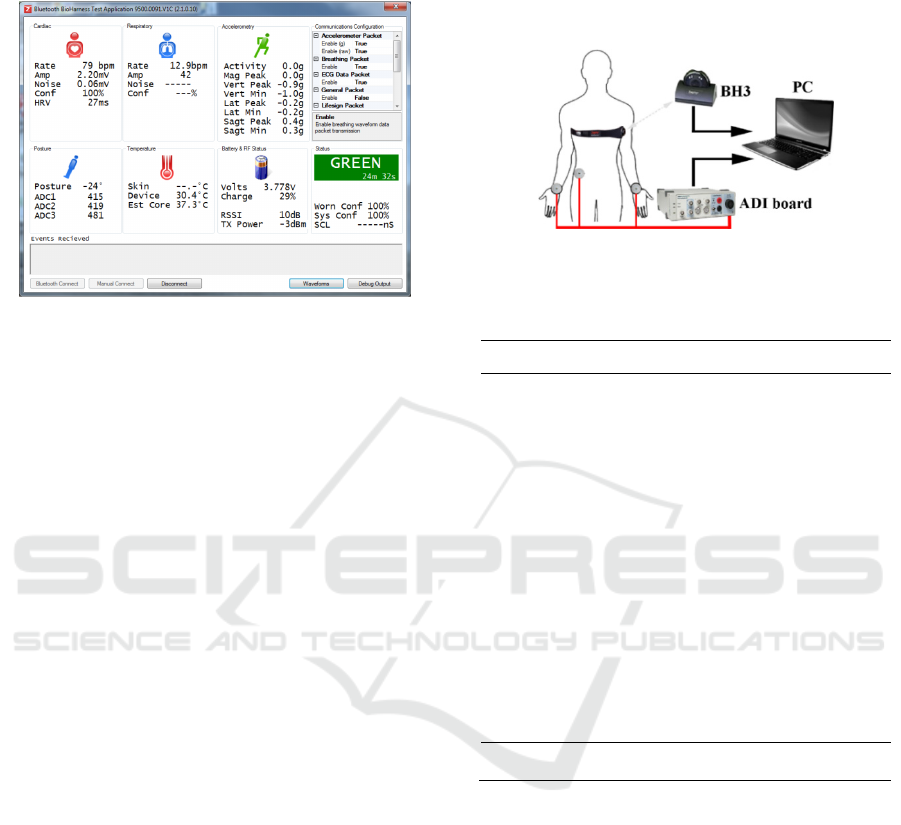
Figure 2 shows a dedicated GUI for Windows to
monitor in real-time the subject’s physiological
quantities. In this work, the BH3 has been analysed to
provide the accuracy estimation for the physiological
quantities. In particular, a novel processing technique
has been applied to the raw waveforms to extract
Heart and Breathing Rate (Section 2.3) and the
computed values have been compared to the ones
BIOSIGNALS 2016 - 9th International Conference on Bio-inspired Systems and Signal Processing
176
obtained by signals acquired from standard
instrumentation.
Figure 2: Zephyr GUI to monitor real-time subject health
status.
In addition, a similar analysis has been conducted
for the values provided by the system through on-
board processing. The measurement campaign has
been conducted for both HR and BR during rest
conditions. Moreover, given the importance of Heart
Rate, a dynamic test has also been performed, in order
to quantify the loss of accuracy of the device due to
the movement of the subject (e.g. while the user is
performing daily life routines). This aspect is
extremely important because traditional
instrumentation (i.e. ECG) are not suitable for these
kind of applications (e.g. continuous monitoring of
HR and Heart Rate variability within daily activities,
indoor and outdoor) because of the need of a
continuous power supply and the discomfort for the
user caused by the cables.
2.1 Heart Rate Test Procedure
The HR test procedure has consisted of two trials. The
first part of the work has interested the accuracy
evaluation of the quantities computed from BH3 (i.e.
instantaneous values and HR from the raw
waveforms) during rest condition. As for gold
standard measurement, a 3-lead ECG has been
acquired simultaneously by means of an
ADInstruments board (model ML865 PowerLab
4/25T), with a sampling frequency of 1 kHz and an
uncertainty of ±1 bpm.
Figure 3 shows the setup for the test performed. In
particular, it has consisted of:
• Personal computer to collect and process the data
offline;
• Acquisition board from ADInsruments for the
ECG acquisition (reference system);
• Electrode sensors for the ECG signal acquisition;
• BioHarness 3.0, placed on the chest of the subject
and then connected to PC with a proprietary
cradle (data upload for post-processing).
Figure 3: Measurement setup for Heart Rate test procedure
(rest condition).
Table 1: Participants for the HR rest tests procedure.
Subject M/F
Age
[years]
Weight
[kg]
Height
[m]
BMI
[kg/m
2
]
1 F 20 55 1.62 21.0
2 F 23 47 1.66 17.1
3 M 23 92 1.81 28.1
4 F 23 48 1.55 20.0
5 M 26 72 1.83 21.5
6 F 23 63 1.64 23.4
7 F 23 47 1.66 17.1
8 F 26 53 1.66 19.2
9 F 21 52 1.64 19.3
10 F 22 70 1.70 24.2
11 F 23 58 1.72 19.6
12 F 23 59 1.62 22.5
13 M 23 74 1.73 24.7
14 F 23 55 1.65 20.2
15 M 24 71 1.72 24.0
16 M 24 71 1.82 21.4
17 M 28 80 1.80 24.7
18 M 23 63 1.72 21.3
19 F 28 64 1.78 20.2
20 F 21 42 1.50 18.7
Mean
23 61.8 1.69 21.4
STD
3.1 12.4 0.09 2.7
Twenty healthy participants (Table 1) have been
recruited for this trial. They have been asked to sit
quietly and breathe normally, while their ECG has
been acquired. Five records of one minute each have
been recorded from both the BH3 and standard ECG.
During the second trial, the subjects have performed
a motion test, which has been implemented to
quantify how motion alters the performance of the
sensors. In this case, four healthy participants (2
males and 2 females, age 25.5±2.5 years, weight
63.5±11.7 kg, height 1.74±0.06 m, BMI 20.77±2.74
kg/m
2
) have performed a continuous walking exercise
in laboratory using a commercial treadmill. In detail,
the HR motion test procedure has consisted of:
- 5 minutes of initial rest;
- 5 minutes of a gradual speed increasing from 4
Smart Monitoring of User’s Health at Home: Performance Evaluation and Signal Processing of a Wearable Sensor for the Measurement of
Heart Rate and Breathing Rate
177
km/h to 6 km/h
- 5 minutes of a walking period with a speed of 6
km/h;
- 5 minutes of a gradual speed decreasing from 6
km/h to 4 km/h;
- 5 minutes of final rest.
The measurement setup for the motion tests has been
the same for the rest condition, with the only
difference related to the position of the electrode
sensors of the standard ECG (placed in the chest of
the subject). In this case, it has been possible to reduce
the motion artefacts of the gold standard during the
walking experiment.
2.2 Breathing Rate Test Procedure
A preliminary Breathing Rate test procedure has been
implemented with the use of a metronome application
for Android devices (available online at
https://play.google.com/store/apps/details?id=com.gi
smart.metronomefree&hl=it), in order to force the
participants to produce a standardized breathing
waveform. The BH3 has been applied to the subject
in order to acquire both its breathing waveform,
sampled at 25 Hz, and the instantaneous BR values,
(1 Hz). Five healthy participants (3 males and 2
females, age 26.2±1.5 years, weight 66.4±10.7 kg,
height 1.80±0.1 m, BMI 21.2±2.4 kg/m
2
) have been
recruited for the breathing test. A standard respiratory
belt from ADInstruments (model MLT1132), based
on the extensometer principle, has been used as gold
standard.
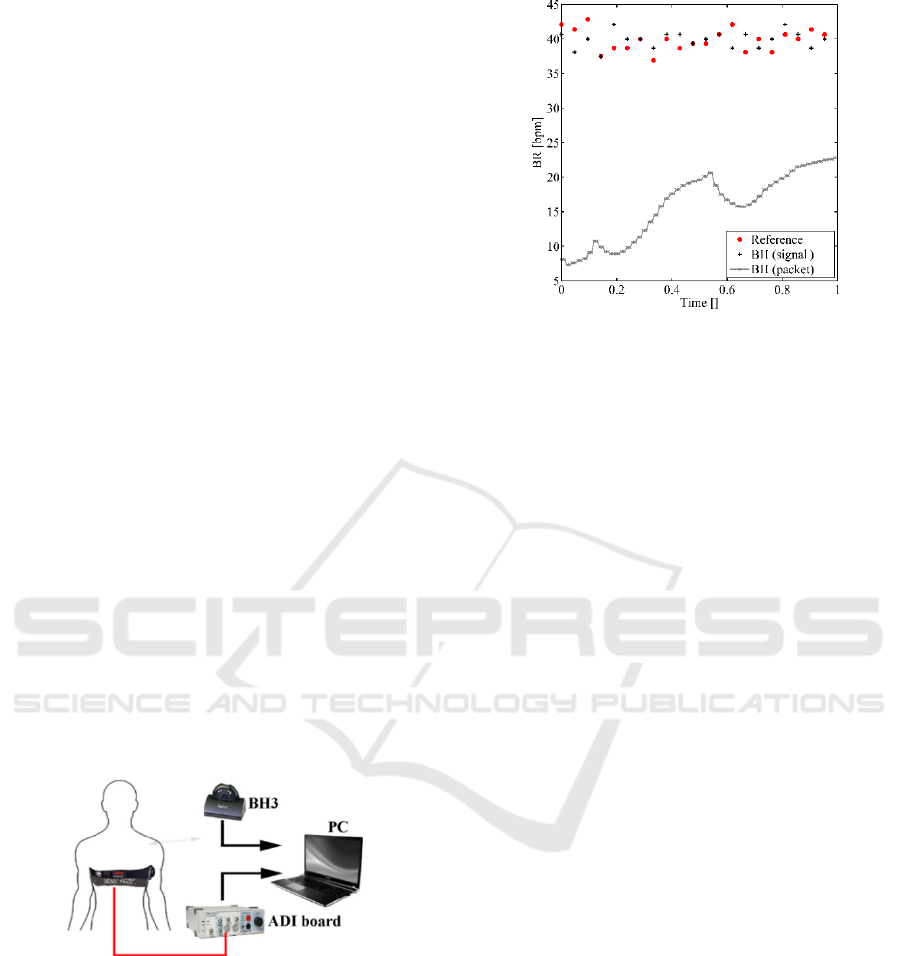
Figure 4: Measurement setup for the breathing tests.
As shown in Figure 4, both the belts have been placed
on the subject chest and acquired simultaneously.
Two different timings for the metronome have been
defined, following the frequency of a medium (25
bpm) and a high breathing (40 bpm), and two records
of 90s for each timing have been acquired.
Differently from the HR tests, the instantaneous
BR value provided by BH3 has not been compared to
the reference value, because the length of the test has
been too short to make the stabilization of the value
Figure 5: BR values computed within a trial (truncated 90 s
of signal). The short period of the trial does not allow to
have a stable value for the instantaneous BR computed by
BH3, even if it is possible to obtain the correct BR from the
raw signal.
provided possible. In fact, the instantaneous values
computed by BH3 (referred in Figure 5 as BH -
packet) have not become stable yet (a decreasing
offset is observed within the short time of the trials).
This is because the value provided by the sensor is
calculated after the application of a moving average
window, so several minutes are needed before
performing such test in order to reach a stable value.
Basing on this observation, the performance analysis
has been conducted only between the BR computed
by post-processing BH3 raw waveforms (referred in
Figure 6 as BH - signal) and the quantities computed
from the reference breathing signals. The next section
illustrates the signal processing techniques performed
for all the tests conducted.
2.3 Signals Processing
The application of a processing algorithm is needed
to compute the physiological parameters from the raw
waveforms (ECG, Breathing) of both gold standard
and BH3. In literature there are several approaches to
gather HR values from ECG signals (Pan and
Tompkins, 1985), (Josko, 2007).
In this work, the approach described previously by
authors in (Cosoli et al., 2015) has been applied for
both rest and motion tests, in order to compute the HR
values for both the gold standard and the BH3 raw
signals. The algorithm is based on the computation of
the slope of the signal, which makes the extraction of
relevant features possible, according to the
morphology of the signal (Hu et al., 2014). In
particular, the approach has been used to identify the
R peaks in the ECG waveforms and so calculate the
HR, according to the equation:
BIOSIGNALS 2016 - 9th International Conference on Bio-inspired Systems and Signal Processing
178
60
Before applying the cited procedure, the following
pre-processing steps have been applied, in order to
reduce the noise and issues related to movement
artefacts from the raw signals (Figure 6):
1) Synchronization of both signals (reference ECG,
BH3 waveform) and resampling (250 Hz);
2) Mean removal;
3) Filtering (Butterworth 3
rd
order band pass filter –
0.5÷30 Hz);
4) Normalization with the maximum absolute value
of the waveform.
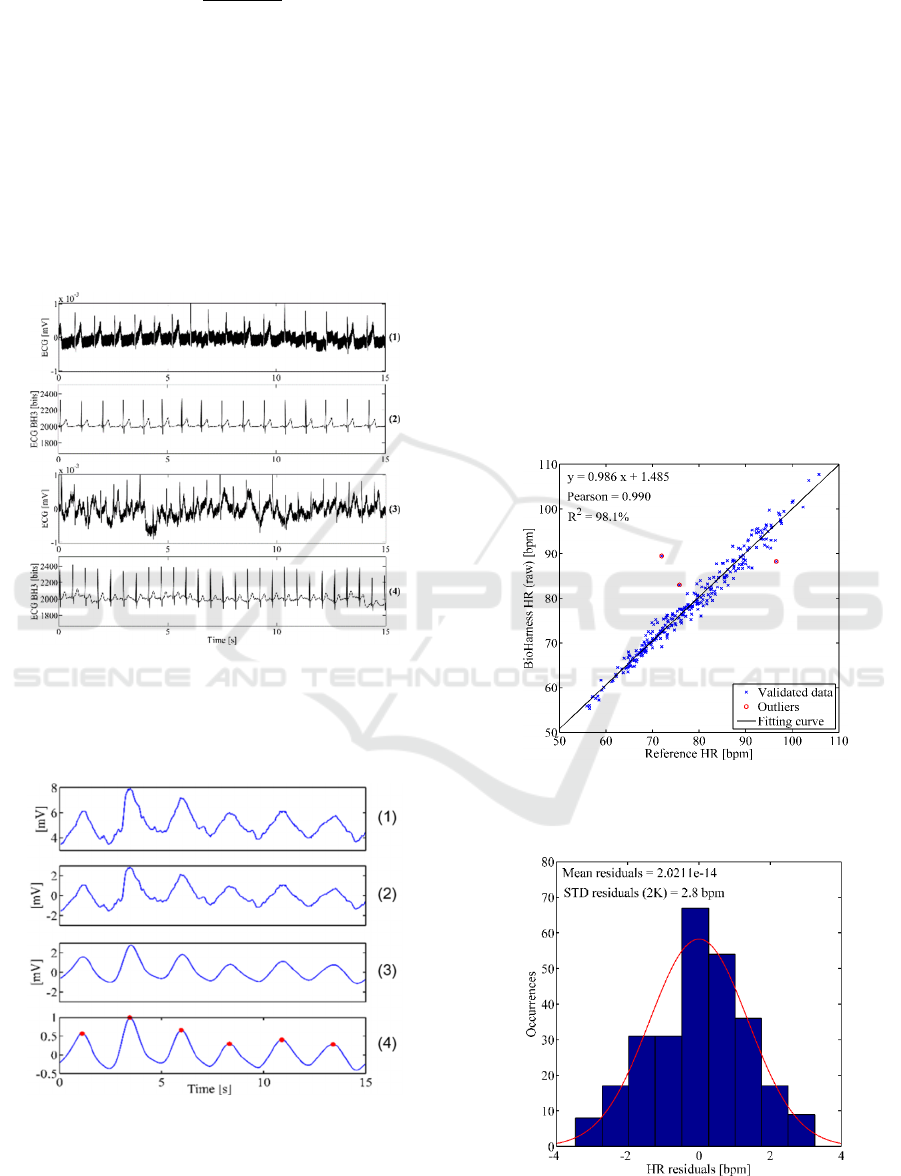
Figure 6: ECG signals acquired during the dynamic trial for
both sensing devices. (1, 2): raw ECG waveform from gold
standard technique and wearable sensor during rest
condition; (3, 4): raw signals acquired during a walking
condition (6 km/h) with treadmill.
Figure 7: Processing steps for breathing waveform within a
test (25 bpm). 1) Synchronization and resampling (25Hz);
2) Mean removal; 3) Filtering; 4) Normalization and peaks
identification.
The conditioned signal has then been divided in
windows of 30 s, where an average HR value has been
computed. As for the Breathing waveform, the signal
pre-processing procedure has been the same (the steps
are summarized in Figure 7), except for the
application of a different filter (Butterworth 3
rd
order
band-pass filter, 0.5÷1 Hz). In addition, the algorithm
for the feature identification (Hu et al., 2014) has been
tuned, in order to locate the maximum of each
sinusoidal waveform and calculate BR consequently.
3 RESULTS
Figure 8 shows the correlation between the HR values
computed from BH3 raw signals (y-axis) and the ones
from the gold standard (x-axis). A Matlab routine
based on Minimum Volume Ellipsoid (MVE) has
been implemented to remove the outliers (red points)
(Riani et al., 2012).
Figure 8: Linear correlation between the HR values of the
BH3 raw ECG and the HR values of the standard ECG for
the rest condition of 20 participants.
Figure 9: Uncertainty estimation for the HR values of the
BH3 raw ECG for the rest condition.
Smart Monitoring of User’s Health at Home: Performance Evaluation and Signal Processing of a Wearable Sensor for the Measurement of
Heart Rate and Breathing Rate
179
Then, a residual analysis has been performed to
verify the Gaussian distribution and to calculate the
final accuracy of the measurement. For example,
Figure 9 shows a deviation of ±2.8 bpm (coverage
factor k=2). If combining this result with the
uncertainty of the gold standard (±1.0 bpm) a final
accuracy of ±3.0 bpm is obtained.
The same analysis has been conducted for all the
tests performed. In particular, the four cases reported
in Table 2 are related to:
1) the HR computed from the BH3 raw signal
during the rest condition;
2) the HR values provided (on-board processing)
for the rest condition;
3) the HR computed from the BH3 raw signal
during the motion test;
4) the HR values provided (on-board processing)
for the motion test.
Table 2: Results of the tests conducted. R
2
= coefficient of
determination. STD = standard deviation of residuals.
Case
Sensitivity
[]
Bias
[bpm]
R
2
[]
STD (2σ)
[bpm]
Combined
STD [bpm]
1 0.986 1.485 98.1 ±2.8 ±3.0
2 1.008
-
0.247
99.1 ±1.9 ±2.1
3 0.820 15.05 81.7 ±5.4 ±5.5
4 0.992 1.044 99.0 ±2.6 ±2.8
If looking at Table 2, it can be observed that the
uncertainty of HR measurement increases with the
level of activity performed and similar results have
been found in the state of the art (STD = ±6 bpm from
0 to 12km/h in (Johnstone et al., 2012a)).
Besides, it can also be noted that the HR values
computed from BH3 with a proper internal processing
(case 2 and 4) are more accurate than the ones
obtained by processing the raw ECG and Breathing
signals (case 1 and 3). This suggests that the on-board
algorithms are robust enough to provide a good
measurement, even in presence of motion artefacts
(improvement of accuracy from ±5.5 to ±2.8 bpm).
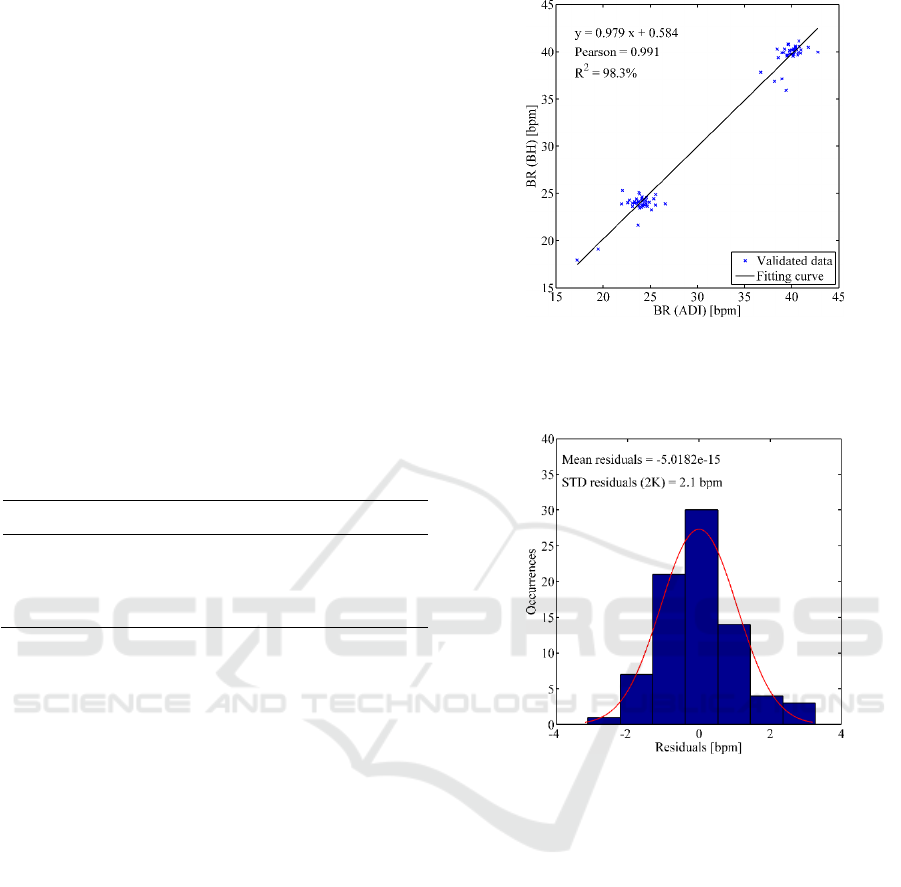
As concerning Breathing Rate, the computed BR
values are highly correlated (R
2
= 98.3%) to the ones
of gold standard instrumentation (Figure 10), with a
deviation of ±2.1 bpm (Figure 11).
These results are in agreement with the ones
discussed in (Johnstone et al., 2012a), where an
accuracy < ±3.0 bpm has been found. Within these
trials, it hasn’t been possible to assess the accuracy
for the instantaneous BR values due to short time of
the acquisition. This suggests that future experiments
are needed to quantify clearly the time needed to the
measurement to become stable and reliable.
Figure 10: Linear correlation between the BR values of the
BH3 raw signal and the BR values of the respiratory belt
for the frequency of a slow breathing (25 bpm) and a high
breathing (40 bpm) of five participants.
Figure 11: Uncertainty estimation for the BR values of the
BH3 raw signal within the tests performed.
4 CONCLUSIONS
Wearable devices are even low at low-cost and with
high computing capabilities, allowing them to
measure different physiological signals and extract
useful quantities (e.g. HR, BR). However, it is
fundamental to provide metrological characterization
of such measurements and, if needed, to identify the
best processing technique to get reliable values.
The aim of this work is to evaluate the accuracy
of the BioHarness 3.0 commercial device in the
monitoring of physiological parameters.
The experiments conducted for Heart Rate have
demonstrated that the values computed on-board by
the device are accurate (deviation of ±2.1 bpm for the
static condition and ±2.8 bpm concerning the test with
BIOSIGNALS 2016 - 9th International Conference on Bio-inspired Systems and Signal Processing
180

the treadmill) and no further processing of the raw
signals is required.
On the contrary, during the tests conducted for the
Breathing Rate, it has been observed that the BR
values computed require several minutes to become
stable. However, the proposed signal processing of
the breathing waveform allows to compute BR
values, which are strongly correlated (R
2
= 98.3%) to
the gold standard and with a deviation of ±2.1 bpm.
Future works will be focused on a deeper analysis
of the breathing signal coming from the BH3.
Particular attention will be paid on the identification
of the time interval needed for the instantaneous BR
value to become stable.
ACKNOWLEDGEMENTS
The research work has been developed within the
framework of the Health@Home Italian project,
financed by MIUR (Italian Ministry of Research).
The authors would like to thank Mr. Fabio Padiglione
(ADItech srl) and Mr. Marco Domizio (Eidos srl) for
their technical support.
REFERENCES
Abascal, J. Ambient intelligence for people with disabilities
and elderly people. ACM's Special Interest Group on
Computer-Human Interaction (SIGCHI), Ambient
Intelligence for Scientific Discovery (AISD)
Workshop, Vienna, 2004.
Abdallah, Z. S., Gaber, M. M., Srinivasan, B. &
Krishnaswamy, S. 2015. Adaptive mobile activity
recognition system with evolving data streams.
Neurocomputing, 150, 304-317.
Angarita, G. A., Natarajan, A., Gaiser, E. C., Parate, A.,
Marlin, B., Gueorguieva, R., Ganesan, D., Malison, R.
T., 2015. A remote wireless sensor
network/electrocardiographic approach to
discriminating cocaine use. Drug and Alcohol
Dependence in press.
Appelboom, G., Camacho, E., Abraham, M. E., Bruce, S.
S., Dumont, E. LP., Zacharia, B. E., D’amico, R.,
Slomian, J., Reginster, J. Y., Bruyère, O., 2014. Smart
wearable body sensors for patient self-assessment and
monitoring. Archives of Public Health, 72, 28.
Bakhchina, A. V., Shishalov, I. S., Parin, S. B., Polevaya,
S. A., 2014. The dynamic cardiovascular markers of
acute stress. International Journal of
Psychophysiology, 2, 230.
Bayat, A., Pomplun, M. & Tran, D. A. 2014. A study on
human activity recognition using accelerometer data
from smartphones. Procedia Computer Science, 34,
450-457.
Bianchi, W., Dugas, A. F., Hsieh, Y., Saheed, M., Hill, P.,
Lindauer, C., Terzis, A., Rothman, R. E., 2013.
Revitalizing a vital sign: improving detection of
tachypnea at primary triage. Annals of emergency
medicine, 61, 37-43.
Catal, C., Tufekci, S., Pirmit, E. & Kocabag, G. 2015. On
the use of ensemble of classifiers for accelerometer-
based activity recognition. Applied Soft Computing.
Cosoli, G., Casacanditella, L., Pietroni, F., Calvaresi, A.,
Revel, G. M., Scalise, L., A novel approach for features
extraction in physiological signals. In: IEEE, ed.
Memea - Medical Measurements and Applications,
2015 Turin. 380-385.
Deepika, A., Baruah, S., Shukla, D. P., Sathyaprabha, T. N.,
Devi, B. I., 2015. Demonstration of subclinical
autonomic dysfunction following severe traumatic
brain injury using serial heart rate variability
monitoring. Autonomic Neuroscience: Basic and
Clinical in press.
Demiris, G., Skubic, M., Rantz, M., Keller, J., Aud, M.,
Hensel, B., He, Z., 2006. Smart home sensors for the
elderly: a model for participatory formative evaluation.
human-computer interaction, 6, 7.
Ehmen, H., Haesner, M., Steinke, I., Dorn, M., Gövercin,
M., Steinhagen-Thiessen, E., 2012. Comparison of four
different mobile devices for measuring heart rate and
ECG with respect to aspects of usability and acceptance
by older people. Applied ergonomics, 43,
582-587.
Hemalatha, C. S., Vaidehi, V., 2013. Frequent bit pattern
mining over tri-axial accelerometer data streams for
recognizing human activities and detecting fall.
Procedia Computer Science, 19, 56-63.
Hu, X., Liu, J., Wang, J., Xiao, Z., Yao, J., 2014. Automatic
detection of onset and offset of QRS complexes
independent of isoelectric segments. Measurement, 51,
53-62.
Johnstone, J. A., Ford, P. A., HugheS, G., Watson, T.,
Garrett, A. T., 2012a. BioHarness™ multivariable
monitoring device: part. I: validity. Journal of sports
science & medicine, 11, 400.
Johnstone, J. A., Ford, P. A., Hughes, G., Watson, T.,
Garrett, A. T., 2012b. BioHarness™ Multivariable
Monitoring Device: Part. II: Reliability. Journal of
sports science & medicine, 11, 409.
Johnstone, J. A., Ford, P. A., Hughes, G., Watson, T.,
Garrett, A. T., 2012c. Field based reliability and
validity of the BioHarness™ multivariable monitoring
device. Journal of sports science & medicine, 11, 643.
Josko, A. Discrete wavelet transform in automatic ECG
signal analysis. Instrumentation and Measurement
Technology Conference Proceedings, 2007. IMTC
2007. IEEE, 2007. IEEE, 1-3.
Kristiansen, J., Korshøj, M., Skotte, J. H., Jespersen, T.,
Søgaard, K., Mortensen, O. S. & Holtermann, A. 2011.
Comparison of two systems for long-term heart rate
variability monitoring in free-living conditions-a pilot
study. Biomedical engineering online, 10, 27.
Lowe, S. A., Ólaighin, G., 2014. Monitoring human health
behaviour in one's living environment: a technological
review. Medical engineering & physics, 36, 147-168.
Smart Monitoring of User’s Health at Home: Performance Evaluation and Signal Processing of a Wearable Sensor for the Measurement of
Heart Rate and Breathing Rate
181

Pan, J. & Tompkins, W. J. 1985. A real-time QRS detection
algorithm. Biomedical Engineering, IEEE Transactions
on, 230-236.
Pantelopoulos, A. & Bourbakis, N. G. 2010. A survey on
wearable sensor-based systems for health monitoring
and prognosis. Systems, Man, and Cybernetics, Part C:
Applications and Reviews, IEEE Transactions on, 40,
1-12.
Parak, J., Tarniceriu, A., Renevey, P., Bertschi, M.,
Delgado-Gonzalo, R. & Korhonen, I. Evaluation of the
beat-to-beat detection accuracy of PulseOn wearable
optical heart rate monitor. Engineering in Medicine and
Biology Society (EMBC), 2015 37th Annual
International Conference of the IEEE, 2015. IEEE,
8099-8102.
Parvaneh, S., Grewal, G. S., Grewal, E., Menzies, R. A.,
Talal, T. K., Armstrong, D. G., Sternberg, E. & Najafi,
B. 2014. Stressing the dressing: Assessing stress during
wound care in real-time using wearable sensors. Wound
Medicine, 4, 21-26.
Revel, G. M., Pietroni, F., Zarli, A., Anfosso, A.,.
Enhancing the built environment for ageing at home
through ICTs and advanced sensing. . The Cities of
Tomorrow: the Challenges of Horizon 2020, 2014
Torino, Italy.
Riani, M., Perrotta, D., Torti, F., 2012. FSDA: A MATLAB
toolbox for robust analysis and interactive data
exploration. Chemometrics and Intelligent Laboratory
Systems, 116, 17-32.
Runova, E. V., Parin, S. B., Nekrasova, M. M., Bakhchina,
A. V., Kovalchuk, A. V., Shyshalov, I. S., Polevaya, S.
A., 2012. Monitoring and distant diagnostics of
sportsmen's functional state based on information
technologies and telemetry in the conditions of natural
activity. International Journal of Psychophysiology,
85, 420-421.
Sannino, G., De Falco, I., De Pietro, G., 2015. A supervised
approach to automatically extract a set of rules to
support fall detection in an mHealth system. Applied
Soft Computing.
Sixsmith, A., Sixsmith, J., 2000. Smart care technologies:
meeting whose needs? Journal of telemedicine and
telecare, 6, 190-192.
Van andel, J., Ungureanu, C., Aarts, R., Leijten, F. &
Arends, J. 2015. Using photoplethysmography in heart
rate monitoring of patients with epilepsy. Epilepsy &
Behavior, 45, 142-145.
Vanderlei, L., Silva, R., Pastre, C., Azevedo, F. M. D. &
Godoy, M. 2008. Comparison of the Polar S810i
monitor and the ECG for the analysis of heart rate
variability in the time and frequency domains. Brazilian
Journal of Medical and Biological Research, 41, 854-
859.
BIOSIGNALS 2016 - 9th International Conference on Bio-inspired Systems and Signal Processing
182
