
Schematization of Clutter Reduction Techniques in Geographic
Node-link Diagrams using Task-based Criteria
Alberto Debiasi, Bruno Sim
˜
oes and Raffaele De Amicis
Fondazione Graphitech, Trento, Italy
Keywords:
Visual Clutter, Geographic Node-link Diagram, Edge Congestion, Geo-referenced Networks.
Abstract:
Visual clutter is a hot topic in the domain of node-link diagrams as it negatively affects usability, aesthetics
and data interpretation. The organization of items, i.e. the way nodes and links are positioned in the display,
is one problem among many that leads to visual clutter. In previous work, different techniques were proposed
to reduce the clutter that depends on the organization of nodes and links. However, a schematization of such
techniques by task was never considered. Approaching the problem by task would be more efficient since
visual clutter, by definition, depends on the task to be performed. In this paper, we propose a solution to
visual clutter driven by the type of task. In particular, the aim of our work is to provide an answer to the
following question: Given a task and a geographic node-link diagram, which are the appropriated techniques
to reduce the visual clutter that depends on the spatial organization of nodes and links. In our solution, we have
classified tasks into a limited number of task groups. For each tasks group, we have identified and analyzed
issues leading to a performance degradation. The final outcome consists on a list of good candidate techniques
for each task group. The selected techniques are the results of a survey that selects only approaches that act
on the position of nodes and links.
1 INTRODUCTION
The node-link diagram is a powerful tool for the visu-
alization of relationships between entities. However,
such visualization often suffer from visual clutter (Liu
et al., 2014; Sun et al., 2013; Ellis and Dix, 2007) af-
fecting usability, aesthetics and data interpretation.
In previous studies visual clutter is defined as:
“the state in which excess items, or their represen-
tation or organization, lead to a degradation of per-
formance at some task” (Rosenholtz et al., 2005).
Hence, visual clutter depends on the task, as shown
in Figure 1. If the task is “find a node”, only the
diagram in Figure 1(a) should be considered clut-
tered (Holten and Van Wijk, 2009; Ersoy et al., 2011;
Hurter et al., 2012) because many nodes are occluded.
If the task is “given a node, find the connected nodes”,
also the diagram in Figure 1(b) should be considered
cluttered (Wong et al., 2003; Wong and Carpendale,
2007; Schmidt et al., 2010) because ambiguities are
present. If the task is considered of high-level, such
as “understand the story described by the data”, then
the diagram in Figure 1(c) should also be considered
cluttered (Phan et al., 2005; Verbeek et al., 2011; De-
biasi et al., 2014) as it is not aesthetically pleasing.
In this work we focus on the problem of organiza-
tion of items, i.e. the way nodes and links are posi-
tioned in the display, for which we propose a solution
that is driven by task group. In geographic node-link
diagrams, this aspect is critical because the position
of nodes is fixed accordingly to geographical infor-
mation. As opposite, we do not examine clutter that
depends on the graphical representation of items, for
example when the color of the nodes is the same of the
background map, or when size of nodes is too small
or too large taking into account the display size and
the number of items.
Our work answers to the following research ques-
tion: Given a task and a geographic node-link dia-
gram, which are the appropriated techniques to reduce
the visual clutter that depends on the spatial organiza-
tion of nodes and links.
We start identifying and analyzing the main prob-
lems that lead to a degradation of tasks performance,
i.e. uninterpretable representation, occlusion, ambi-
guity, and unaesthetic representation. Then, we di-
vide the tasks into task groups, and for each group we
associate the problems that characterize it. We use
the task taxonomy for graph visualization (Lee et al.,
2006) that covers exploratory and analytical tasks. We
include a tasks group related to the aesthetic of the
visualization, i.e. explanatory tasks. Finally, we pro-
Debiasi, A., Simões, B. and Amicis, R.
Schematization of Clutter Reduction Techniques in Geographic Node-link Diagrams using Task-based Criteria.
DOI: 10.5220/0005674801070114
In Proceedings of the 11th Joint Conference on Computer Vision, Imaging and Computer Graphics Theory and Applications (VISIGRAPP 2016) - Volume 2: IVAPP, pages 109-116
ISBN: 978-989-758-175-5
Copyright
c
2016 by SCITEPRESS – Science and Technology Publications, Lda. All rights reserved
109

(a)
(b) (c)
Figure 1: Examples of different visual clutter in geographic
node-link diagrams.
vide a list of good candidate techniques for each prob-
lem.
The selected techniques are the results of a survey
that selects only approaches that act on the position of
nodes and links. We restrict the analysis to this sub-
set mainly because the position is the most used vari-
able in the context of geographical node-link diagram
to reduce clutter. We do not consider force-directed
techniques on nodes because they do not preserve spa-
tial information.
This paper is structured as follows. First we sum-
marize, in Section 2, previous works on visual clut-
ter in geographic node-link diagrams. In Section 3,
we identify the visual clutter problems. Then we de-
fine in Section 4 our classification of tasks by groups.
Lastly, in Section 5 we itemize the main clutter reduc-
tion techniques according to the defined criteria. An
overview of the results obtained and of future work is
presented in Section 6.
2 EXISTING SURVEYS
In literature different surveys on clutter reduction
techniques are presented. However, they do not con-
sider the different problems related to visual clutter
(e.g. occlusion and ambiguity), nor they take into ac-
count the task.
In (Sun et al., 2013; Liu et al., 2014) visual analyt-
ics techniques were presented and a section was ded-
icated to the clutter reduction methods in large graph
layouts. However, no hints are made with respect to
the aforementioned aspects. The clutter problem and
the related solutions are also mentioned in different
categorizations of node-link diagrams (Hadlak et al.,
2015; Debiasi et al., 2015a), but not as main chal-
lenge.
Zhou et al. (Zhou et al., 2013) provide a survey
on edge bundling techniques. They described the al-
gorithms accordingly with the way they generate the
final graph layout, i.e. they distinguished cost-based,
geometry based and image-based techniques. As op-
posite, we classify the different approaches accord-
ingly with the criteria they fulfill, by looking at the
final layout they generate. In the survey (Tominski
et al., 2014), lens techniques in the context of visu-
alization are categorized according to data types and
tasks. Although many clutter reduction techniques are
included, they are classified according with the pro-
prieties of the solutions.
A previous survey (Ellis and Dix, 2007) focused
on cluttered visualizations caused by huge amounts
of data. The authors classified clutter reduction meth-
ods defining eight criteria based on their experience
and on the study of the related literature. The main
difference between our work and theirs is that their
criteria focus on the techniques. We provide crite-
ria derived from an analysis of cluttered layouts and
tasks. Moreover, our work focus specifically on inap-
propriate organization of nodes and links in node-link
diagrams and not on clutter caused by huge data.
3 VISUAL CLUTTER PROBLEMS
Focusing on the organization of items, clutter is
mainly the result of the overlapping (overplotting or
overdrawing) of those items, i.e. items rendered on
top (on near) of each other. In this work, the consid-
ered items are nodes, links (straight lines or curves),
and the geographical surface (background map). We
define the symbology (element1, element2) to indi-
cate that “element1 is rendered on top of element2”.
We describe four problems associated to clutter: unin-
terpretable representation, occlusion, ambiguity, and
unaesthetic representation.
3.1 Problem of Uninterpretability
The readability of node-link diagrams deteriorates
when items are badly located or when the size of the
graph and its link density increase (Ghoniem et al.,
2004). The problem of uninterpretable representa-
tion occurs when items become impossible to iden-
tify, making the visualization useless.
IVAPP 2016 - International Conference on Information Visualization Theory and Applications
110
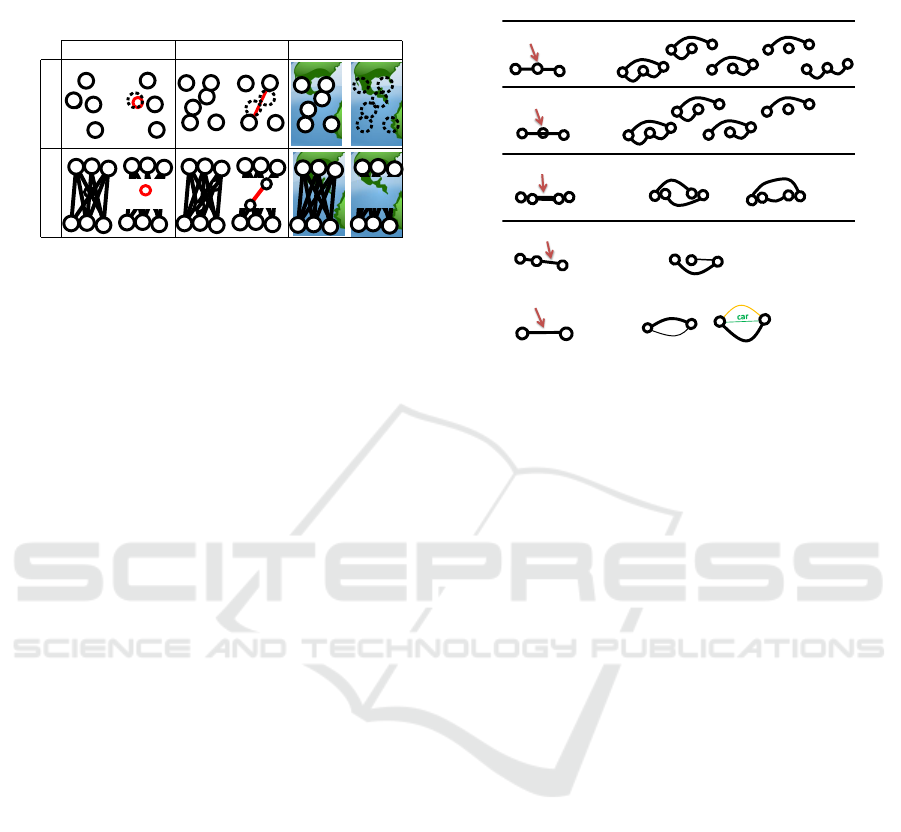
Table 1: Occlusion of elements (in red) results in loss of
information. For each scenario, we apply an approach that
acts on elements opacity to solve the problem.
Element on back
Node Link Geo-Surface
Element on top
Node Link
3.2 Problem of Occlusion
Table 1 shows information loss of geographic node-
link diagram taking into account all possible combi-
nations between elements.
Here some elements are hidden behind other ele-
ments:
• (node,node);(node,link);(node,geo-surface):
Nodes located is the same spatial location or near
with each other may cause their occlusion. In
the same way, nodes can occlude also links or
background map.
• (link,node);(link,link);(link,geo-surface): Links
obscure nodes, links, information in the back-
ground, map labels or map features. This prob-
lem is accentuated with thick links, or with a large
number of links.
3.3 Problem of Ambiguity
Table 2 shows the ambiguity problem of node-link di-
agram taking into account different cases of ambigu-
ity:
• (node,link);(link,node): It can be difficult to as-
sess, when a link crosses a node, or vice-versa,
whether this link is incident to this node or it is
merely crossing it. This makes it difficult to iden-
tify the actual sources and destinations of links. If
nodes are rendered on bottom of links, links may
obscure the content of the nodes. In the opposite
case, the unambiguous layout candidates are more
in numbers.
• (link,link): Link crossings are an important fac-
tor in readability (Purchase et al., 2004). We con-
sider colliding links also when they are very close
to each other and are almost parallel. When eyes
try to follow a link to its destination, small cross-
ing angles between this link and other links cre-
ate multiple paths along the direction of the eye
Table 2: Ambiguity cases and their possible unambiguous
configurations.
Ambiguous Layout
Unambiguous Configurations
(
node,link): node crosses link
(
link,node): link crosses node
(
link,link): link crosses link
(
𝑙𝑖𝑛𝑘, 𝑙𝑖𝑛𝑘)
2
: link overlaps link
(
𝑙𝑖𝑛𝑘, 𝑙𝑖𝑛𝑘)
2
: link overlaps link - limit case
….
in
out
plane
train
….
movement, either taking eyes to the wrong path,
or slowing down the eye movement. However, if
two links share one node, this ambiguity does not
occur.
• (link,link)
2
: In this case links overlap each other.
Hence, it can be considered an occlusion crite-
ria. This happen if they have one or both incident
nodes in common. For example if links repre-
sent path segments, two or more links completely
overlaps if they have same origin and destination
but different time period.
3.4 Problem of Unaesthetic
The problem of unaesthetic representation differs
from the occlusion problem, because we do not neces-
sarily have loss of information. As shown in Table 3,
partial overlapping causes a decrement in visual qual-
ity of the layout. Thus, for the aesthetic of the repre-
sentation, the following cases are relevant to describe
the effect of clutter:
• (node,node): Nodes located is the same spatial lo-
cation or near with each other may cause partial
overlapping of nodes.
• (link,node);(node,link): Links can cut directly
across a node (or vice-versa) interfering with the
visual quality of the layout.
• (link,link): It is possible to have links that are
close to or actually overlapping each other.
• (link,geo-surface);(node,geo-surface): When
links or nodes overlap a region, they may
decrease the layout aesthetic.
Schematization of Clutter Reduction Techniques in Geographic Node-link Diagrams using Task-based Criteria
111
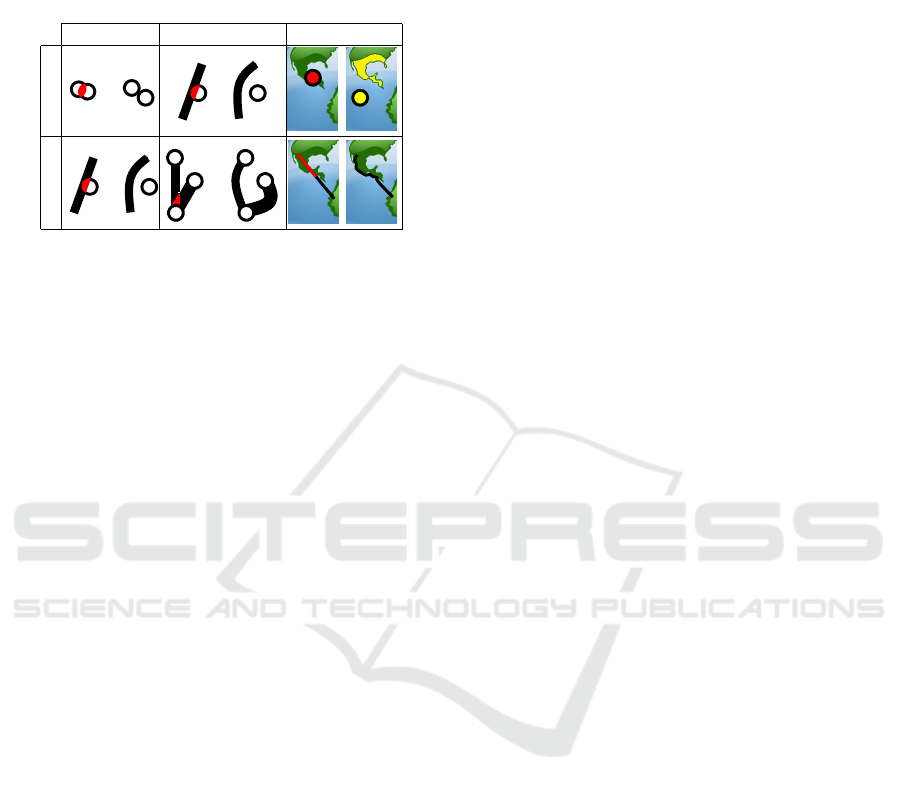
Table 3: Partial overlapping of elements (colored in red)
causes a decrement of layout aesthetic. For each case an
approach acting on elements position is applied to solve the
problem.
Element on back
Node Link Geo-Surface
Element on top
Node Link
3.5 Criteria Fulfillment
We use the criteria mentioned below, to valuate the
candidate solutions for the identified problems.
The problems of uninterpretable representation
and occlusion, are analyzed by applying each tech-
nique to example in Figure 1(a). Although such dia-
gram does not present a background image, we enrich
the visualization with the appropriate map. For ambi-
guity problems in Table 2, each technique is applied
to example in Figure 1(b). For the problem in Table 3,
each technique is applied to example in Figure 1(c).
Although such diagram does not present overlapping
nodes, we enrich the visualization increasing the size
of the nodes.
For each problem, a technique is marked as:
• 3: if the technique removes the problem.
• 3
∗
: if the technique may removes the problem,
however, this condition is not guaranteed for all
the cases.
• -: if the technique does not provide any evidence
that it reduces or removes the problem.
• 7: if the technique increase the problem. In such
cases, the goal of the technique is another.
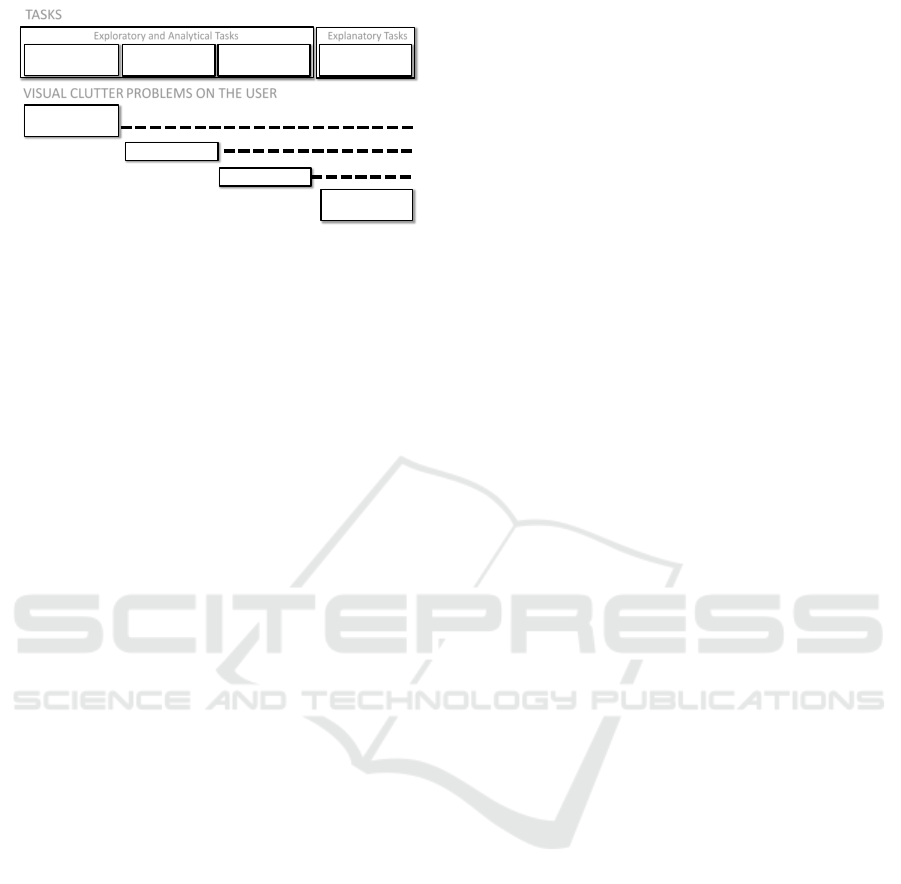
4 TASKS GROUPS FOR
GEOGRAPHIC NODE-LINK
DIAGRAMS
We distinguish different tasks groups in the context
of geo-referenced networks, to better understand vi-
sual clutter. At high level of abstraction, we ap-
ply the general division for information visualization
tasks (Keim et al., 2006):
• Exploratory and Analytical tasks: Visual explo-
ration allows the possibility to get new insight. In
case of analytical scenario, the user knows always
the task, being it implicit or explicit. We classify
the tasks identified in (Lee et al., 2006) as follows:
– Graph-specific tasks: The tasks are related to
the topology of the graph, i.e. “given a node,
find adjacent nodes” and “given a link, find in-
cident nodes”.
– General low-level tasks: The user examines
each item of the network to make new discover-
ies. The tasks are: “find item”, “retrieve value”,
“filter item”, etc.
– Overview tasks: Some high-level tasks require
only an overview of the graph such as finding
clusters of related nodes, finding patterns and
outliers.
• Explanatory tasks: The main goal is to make sense
(i.e. associative thinking) of a story visually de-
scribed by the data. In literature, common ex-
amples of node-link diagram for such tasks are
flow maps: geographical maps where straight or
curved lines represent the movement of groups of
objects from one location to another. The thick-
ness of the line identifies the number of moving
objects, see Figure 1(c).
4.1 Analysis of Tasks Groups and
Clutter Problems
In this section we identify the problems that charac-
terize each tasks group, as shown in Figure 2.
In the task group “Overview Tasks”, visual clutter
is interconnected to the interpretation of the represen-
tation. In these tasks it is not essential to solve the
problem of occlusion, ambiguity and unaesthetic.
In the task group “General low-level tasks”, visual
clutter involve also the occlusion of items. It becomes
difficult to understand information encoded in visual
variables of occluded elements.
In the task group “Graph specific tasks” ambiguity
is an important aspect to take care of. In this task
group, we are not only searching for hidden elements,
but also we are trying to have a clearer (unambiguous)
layout.
In the task group “Associative Visualization
Tasks” there is the problem of unaesthetic representa-
tion. Due to the layout, some partial overlap between
elements may occurs, which cause a decrement in vi-
sual quality of the layout. The aesthetic is not a prior-
ity in exploratory and analytical tasks.
IVAPP 2016 - International Conference on Information Visualization Theory and Applications
112
Graph-specific
Tasks
TASKS
General low-level
Tasks
Overview
Tasks
Ambiguity
Occlusion
VISUAL CLUTTER PROBLEMS ON THE USER
Uninterpretable
representation
Unaesthetic
representation
Associative
Visualization Tasks
Explanatory Tasks Exploratory and Analytical Tasks
Figure 2: Task groups are affected by different types of vi-
sual clutter.
5 APPLIED SCHEMATIZATION
Each technique surveyed in this work is compared
with respect to our criteria, see Table 4. For each task
group, analyzing the table, we propose the following
candidate solutions.
5.1 Overview Tasks
Edge bundling is one of the main techniques that
makes a layout more easy to interpret. In edge
bundling, links of a graph are bundled together ac-
cording to defined conditions. In the first generation
of such algorithms (Qu et al., 2007; Zhou et al., 2008;
Telea and Ersoy, 2010; Holten, 2006; Cui et al., 2008;
Holten and Van Wijk, 2009; Gansner et al., 2011;
Lambert et al., 2010a), without considering the com-
bination with other techniques, the main benefit is the
reduction of the number of visible items.
5.2 General Low-level Tasks
Winding Roads (Lambert et al., 2010b),
KDEEB (Hurter et al., 2012), and
ADEB (Peysakhovich et al., 2015), when com-
pared to previous Edge Bundling approaches, are
able to avoid overlapping of links with nodes and map
portions. Edge Bundling techniques are also designed
to manage multivariate networks. DEB (Selassie
et al., 2011) is able to separate opposite-direction
bundles, emphasizing the graph structure. SBEB (Er-
soy et al., 2011) bundled similar links according to
directions and also further variables associated to
links.
MoleView (Hurter et al., 2011) is a semantic lens
that selects a set of data elements located within the
lens’ radius and having an attribute value defined by
the user. In case of graph layout the lens moves the
control points that compose links around the lens.
EdgeAnalyzer (Panagiotidis et al., 2011) is able to
select specific sub-groups of links on dense areas.
Those techniques are able to reveal nodes, links and
map occluded by the links.
5.3 Graph-specific Tasks
Edge bundling techniques can be designed to reduce
ambiguities. SideKnot (Peng et al., 2012) focused
on (link,link) ambiguity. Although it does not re-
duce the ambiguity, with respect to the aforemen-
tioned bundling techniques, it does not even increase
that problem. Stub Bundling (Nocaj and Brandes,
2013) made a step forward. It uses parallel routing
of links to facilitate the display of additional data at-
tributes by varying width or color. Hence, it solves
the (link,link)
2
ambiguity problem. Ambiguity-Free
Edge-Bundling (Luo et al., 2012) is an approach that
bundles only links which share a common node. In
this way the (link,link) ambiguity in not increased dur-
ing the bundling procedure. Moreover, this method
reroutes links that pass over nodes reducing the
(node,link) ambiguity. Finally, Edge Routing with Or-
dered Bundles (Pupyrev et al., 2012) is able to fulfill
most of our criteria. Here, links are placed in parallel
channels to avoid overlaps. This approach could the-
oretically be used to create flow maps, however, the
result has to be evaluated in terms of aesthetic.
Links can be drawn as curves in a 3D space to
reduce (link,link) and (node,link) ambiguities, and
nodes are snapped over a geographical surface to pre-
serve the spatial context (Cox et al., 1996; Munzner
et al., 1996). Curved links allow more display space
compared to their straight counterparts and poten-
tially reduce visual clutter (Xu et al., 2012).
Interactive Bundling (Riche et al., 2012) is an in-
teractive technique that generates crossing-minimal
bundles that are routed to distinguish them. Wong et
al. (Wong et al., 2003) proposed EdgeLens; a tech-
nique that iteratively curves graph links away from
the point of focus. This consents to disambiguate the
relationship between nodes and links without losing
information. An analogous multi-touch technique is
PushLens (Schmidt et al., 2010). 3DArcLens (Debi-
asi et al., 2015b) extends the functionalities of Edge-
Lens, distinguishing the distorted links around the
lens. As drawback, the distorted links may cross with
the surrounding lines causing further ambiguity. With
Edge Plucking the user can drag groups of links away
to clarify cluttered zones and specify links or nodes
to be left unmoved (Wong and Carpendale, 2007).
However, Edge Plucking requires a certain amount
of manual effort. Bearing this in mind, Schmidt et
al. (Schmidt et al., 2010) designed (but not imple-
mented) multi-touch interaction techniques based on
Schematization of Clutter Reduction Techniques in Geographic Node-link Diagrams using Task-based Criteria
113
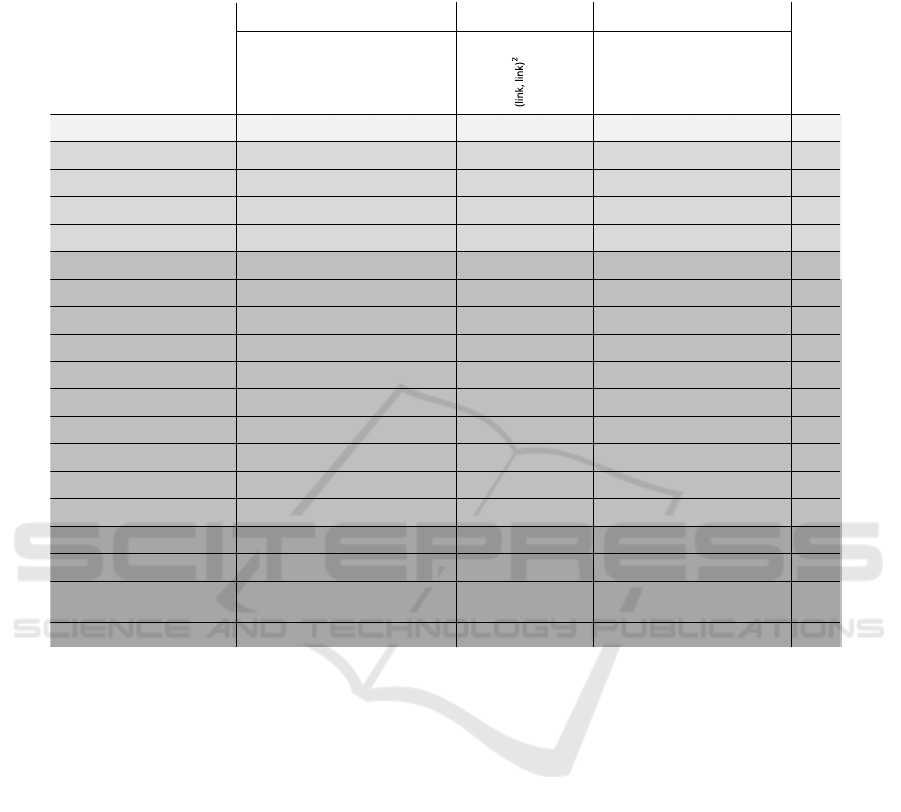
Table 4: Techniques to reduce unaesthetic representation/ambiguity/occlusion/uninterpretable in geographic node-link dia-
gram. From top to bottom, the color identifies the task group: Overview Tasks, General Low-level Tasks, Graph-specific
Tasks, and Associative Visualization Tasks.
Clutter Reduction
Techniques
Unaesthetic Representation Ambiguity Occlusion
Uninterpretable
Representation
(link, link)
(node, link)
(link, node)
(link, map)
(node, node)
(node, map)
(link, link)
(node, link)
(link, node)
(link, link)
(node, link)
(link, node)
(link, map)
(node, node)
(node, map)
Edge Bundlings (1° Generation)
- - - - - * * -
SBEB, DEB
- - - - - * - * * -
Winding Road, KDEEB, ADEB
- - - - -
SideKnot
- - - - - - - * * -
MoleView, EdgeAnalyzer
- * - - -
3DArcLens
* * - -
3D curving edges
* - * * * - -
Interactive Bundling
- - - - -
Interactive Link Fanning
- - - - - - -
Link Magnet, Interactive Link Legend
- * - - - - - -
EdgeLens, PushLens
- - - -
MultiTouch Techniques
- - -
Stub Bundling
* - - - - - - * * - -
Ambiguity-Free Edge-Bundling
- - - - - - - * - -
Edge Routing with Ordered Bundles
- - - - -
Flow Map Layout
* * - - - - - - - - - - -
Supervised Flow Map Layout
- - - - - - - - - - -
Conuent Spiral Drawings,
Flow Map Layout via Spiral Trees
- - - - - - - - - -
Necklace Maps
- * - * - - - - - - -
link displacement.
Other interactive lenses were designed to reduce
clutter accordingly to the multivariate encoding of
links (Riche et al., 2012). For example, Interactive
Link Fanning creates space between links incident
to a selected node, to show labels or arrowheads for
individual links. With Link Magnet, when a visual
object representing a data attribute is dragged, data
items are attracted by an amount depending on the
attribute value of the item. Finally, with Interactive
Link Legends, link curvature encodes semantic infor-
mation such as different types of links in heteroge-
neous graphs.
5.4 Associative Visualization Tasks
In Necklace Map (Speckmann and Verbeek, 2010),
nodes are rearranged in circular layouts to remove the
overlapping between them. However, the spatial con-
text of nodes is preserved for two reasons: the nodes
are moved not too far from their original position and
the color of nodes is used to associate them with their
original location on the background map.
Phan, et al. (Phan et al., 2005) developed a method
to generate a flow map layout in a recursive and sim-
ple manner. The overlapping between links and nodes
is only partially solved because undesired crossings
may occur. However, in a post processing phase, user
has the possibility to modify flow lines by moving
their control points. Debiasi et al. (Debiasi et al.,
2014) presented a method to generate flow map lay-
outs using a force directed approach to remove the
(link-node),(node-node) overlapping.
A second generation of flow map algorithms was
developed to satisfy all the criteria related to the par-
tial overlapping of links. Verbeek, et al. (Verbeek
et al., 2011) introduced a method using spiral trees,
i.e. links are logarithmic spirals, implemented as cu-
bic Hermite splines. A different approach called Con-
fluent Spirals (Nocaj and Brandes, 2013) consists of
smooth drawings in which link direction are repre-
sented by increasing curvature.
IVAPP 2016 - International Conference on Information Visualization Theory and Applications
114

6 CONCLUSIONS
This work provides a list of criteria to classify the
effects of the visual clutter on geographic node-link
diagrams on different scenarios. The scope of this
work is not the creation of a rank of techniques, but
a classification that helps the reader to decide, given
a task, on the list of candidate solutions that help to
reduce the clutter in a geographical node-link dia-
gram. Moreover, it provides guidelines to the design
of novel techniques, helping the researchers to focus
on a well-defined list of criteria to fulfill. As shown in
Table 4, among the techniques we surveyed there are
no solution that are capable of satisfying all criteria.
Regarding edge bundling techniques, the fulfill-
ment of criteria depends on the information used.
Starting from unambiguous layout, aggregating links
with no information about nodes increase all the
ambiguity cases. Information about their incident
nodes is needed to solve the ambiguity of overlapping
links. As opposite, information about crossing links
is needed to avoid completely the link-link ambiguity.
Finally, information about nodes positions is needed
to avoid crossing among links and nodes.
It is possible that some techniques that remove or
reduce the occlusion of items affect negatively the
graph-based tasks. The combined use of techniques
that act on position of nodes and links with tech-
niques that act on other visual variables can further
improve the final result. From the proposed classifi-
cation only one approach (Necklace Map) satisfies the
partial overlapping criteria related to occluding nodes.
The reason is the difficulties in rearranging the nodes
without losing their geographic information.
As future work we plan to extend this schema-
tization into a classification of techniques, based on
their intent, e.g. “put in parallel”, “aggregate”, “push
away”. Furthermore, we could include techniques
that act on other visual variables such as color, final
image rendering, etc. Finally, the task classification
has to be improved. No group takes into account the
background map in their tasks.
ACKNOWLEDGEMENTS
This research has been supported by the Euro-
pean Commission under the c-Space (G.A. 611040)
and the LIFE+IMAGINE (LIFE12/ENV/IT/001054)
projects. It has been carried on in the context of the
National Geoportal project for the Italian Ministry of
Environment.The authors are solely responsible this
work.
REFERENCES
Cox, K. C., Eick, S. G., and He, T. (1996). 3d geographic
network displays. ACM Sigmod Record, 25(4):50–54.
Cui, W., Zhou, H., Qu, H., Wong, P. C., and Li, X. (2008).
Geometry-based edge clustering for graph visualiza-
tion. Visualization and Computer Graphics, IEEE
Transactions on, 14(6):1277–1284.
Debiasi, A., Sim
˜
oes, B., and De Amicis, R. (2014). Super-
vised force directed algorithm for the generation of
flow maps. In Proceedings of the WSCG 2014 - 22nd
International Conference on Computer Graphics.
Debiasi, A., Sim
˜
oes, B., and De Amicis, R. (2015a).
Schematization of node-link diagrams and drawing
techniques for geo-referenced networks. In Cy-
berworlds (CW), 2015 International Conference on.
IEEE.
Debiasi, A., Simes, B., and Amicis, R. D. (2015b). 3dar-
clens: Interactive network analysis on geographic sur-
faces. In Proceedings of the 6th International Confer-
ence on Information Visualization Theory and Appli-
cations, pages 291–299.
Ellis, G. and Dix, A. (2007). A taxonomy of clutter
reduction for information visualisation. Visualiza-
tion and Computer Graphics, IEEE Transactions on,
13(6):1216–1223.
Ersoy, O., Hurter, C., Paulovich, F. V., Cantareiro, G.,
and Telea, A. (2011). Skeleton-based edge bundling
for graph visualization. Visualization and Computer
Graphics, IEEE Transactions on, 17(12):2364–2373.
Gansner, E. R., Hu, Y., North, S., and Scheidegger, C.
(2011). Multilevel agglomerative edge bundling for
visualizing large graphs. In Pacific Visualization
Symposium (PacificVis), 2011 IEEE, pages 187–194.
IEEE.
Ghoniem, M., Fekete, J.-D., and Castagliola, P. (2004). A
comparison of the readability of graphs using node-
link and matrix-based representations. In Information
Visualization, 2004. INFOVIS 2004. IEEE Symposium
on, pages 17–24. Ieee.
Hadlak, S., Schumann, H., and Schulz, H.-J. (2015). A
survey of multi-faceted graph visualization. In Borgo,
R., Ganovelli, F., and Viola, I., editors, Eurographics
Conference on Visualization (EuroVis) - STARs. The
Eurographics Association.
Holten, D. (2006). Hierarchical edge bundles: Visualization
of adjacency relations in hierarchical data. Visualiza-
tion and Computer Graphics, IEEE Transactions on,
12(5):741–748.
Holten, D. and Van Wijk, J. J. (2009). Force-directed edge
bundling for graph visualization. In Computer Graph-
ics Forum, volume 28, pages 983–990. Wiley Online
Library.
Hurter, C., Ersoy, O., and Telea, A. (2012). Graph bundling
by kernel density estimation. In Computer Graphics
Forum, volume 31, pages 865–874. Wiley Online Li-
brary.
Hurter, C., Telea, A., and Ersoy, O. (2011). Moleview:
An attribute and structure-based semantic lens for
Schematization of Clutter Reduction Techniques in Geographic Node-link Diagrams using Task-based Criteria
115

large element-based plots. Visualization and Com-
puter Graphics, IEEE Transactions on, 17(12):2600–
2609.
Keim, D. A., Mansmann, F., Schneidewind, J., and Ziegler,
H. (2006). Challenges in visual data analysis. In In-
formation Visualization, 2006. IV 2006. Tenth Inter-
national Conference on, pages 9–16. IEEE.
Lambert, A., Bourqui, R., and Auber, D. (2010a). 3d edge
bundling for geographical data visualization. In In-
formation Visualisation (IV), 2010 14th International
Conference, pages 329–335. IEEE.
Lambert, A., Bourqui, R., and Auber, D. (2010b). Wind-
ing roads: Routing edges into bundles. In Computer
Graphics Forum, volume 29, pages 853–862. Wiley
Online Library.
Lee, B., Plaisant, C., Parr, C. S., Fekete, J.-D., and Henry,
N. (2006). Task taxonomy for graph visualization.
In Proceedings of the 2006 AVI workshop on BEyond
time and errors: novel evaluation methods for infor-
mation visualization, pages 1–5. ACM.
Liu, S., Cui, W., Wu, Y., and Liu, M. (2014). A survey on
information visualization: recent advances and chal-
lenges. The Visual Computer, 30(12):1373–1393.
Luo, S.-J., Liu, C.-L., Chen, B.-Y., and Ma, K.-L. (2012).
Ambiguity-free edge-bundling for interactive graph
visualization. Visualization and Computer Graphics,
IEEE Transactions on, 18(5):810–821.
Munzner, T., Hoffman, E., Claffy, K., and Fenner, B. G.
N. D. (1996). Visualizing the global topology of the
mbone. In Information Visualization’96, Proceedings
IEEE Symposium on, pages 85–92. IEEE.
Nocaj, A. and Brandes, U. (2013). Stub bundling and
confluent spirals for geographic networks. In Graph
Drawing, pages 388–399. Springer.
Panagiotidis, A., Bosch, H., Koch, S., and Ertl, T. (2011).
Edgeanalyzer: Exploratory analysis through advanced
edge interaction. In System Sciences (HICSS), 2011
44th Hawaii International Conference on, pages 1–
10. IEEE.
Peng, D., Lu, N., Chen, W., and Peng, Q. (2012). Side-
knot: Revealing relation patterns for graph visualiza-
tion. In Pacific Visualization Symposium (PacificVis),
2012 IEEE, pages 65–72. IEEE.
Peysakhovich, V., Hurter, C., and Telea, A. (2015).
Attribute-driven edge bundling for general graphs
with applications in trail analysis. In 2015 IEEE
Pacific Visualization Symposium, PacificVis 2015,
Hangzhou, China, April 14-17, 2015, pages 39–46.
Phan, D., Xiao, L., Yeh, R., and Hanrahan, P. (2005). Flow
map layout. In Information Visualization, 2005. IN-
FOVIS 2005. IEEE Symposium on, pages 219–224.
IEEE.
Pupyrev, S., Nachmanson, L., Bereg, S., and Holroyd, A. E.
(2012). Edge routing with ordered bundles. In Graph
Drawing, pages 136–147. Springer.
Purchase, H. C., Carrington, D., and Allder, J. (2004). Eval-
uating graph drawing aesthetics: defining and explor-
ing a new empirical research area. Computer Graphics
and Multimedia, pages 145–178.
Qu, H., Zhou, H., and Wu, Y. (2007). Controllable and pro-
gressive edge clustering for large networks. In Graph
Drawing, pages 399–404. Springer.
Riche, N. H., Dwyer, T., Lee, B., and Carpendale, S. (2012).
Exploring the design space of interactive link curva-
ture in network diagrams. In Proceedings of the In-
ternational Working Conference on Advanced Visual
Interfaces, pages 506–513. ACM.
Rosenholtz, R., Li, Y., Mansfield, J., and Jin, Z. (2005).
Feature congestion: a measure of display clutter. In
Proceedings of the SIGCHI conference on Human fac-
tors in computing systems, pages 761–770. ACM.
Schmidt, S., Nacenta, M. A., Dachselt, R., and Carpendale,
S. (2010). A set of multi-touch graph interaction tech-
niques. In ACM International Conference on Interac-
tive Tabletops and Surfaces, pages 113–116. ACM.
Selassie, D., Heller, B., and Heer, J. (2011). Divided
edge bundling for directional network data. Visualiza-
tion and Computer Graphics, IEEE Transactions on,
17(12):2354–2363.
Speckmann, B. and Verbeek, K. (2010). Necklace maps.
IEEE Trans. Vis. Comput. Graph., 16(6):881–889.
Sun, G.-D., Wu, Y.-C., Liang, R.-H., and Liu, S.-X. (2013).
A survey of visual analytics techniques and appli-
cations: State-of-the-art research and future chal-
lenges. Journal of Computer Science and Technology,
28(5):852–867.
Telea, A. and Ersoy, O. (2010). Image-based edge bundles:
Simplified visualization of large graphs. In Computer
Graphics Forum, volume 29, pages 843–852. Wiley
Online Library.
Tominski, C., Gladisch, S., Kister, U., Dachselt, R., and
Schumann, H. (2014). A survey on interactive lenses
in visualization. EuroVis State-of-the-Art Reports,
pages 43–62.
Verbeek, K., Buchin, K., and Speckmann, B. (2011). Flow
map layout via spiral trees. Visualization and Com-
puter Graphics, IEEE Transactions on, 17(12):2536.
Wong, N. and Carpendale, S. (2007). Supporting interactive
graph exploration with edge plucking. Proc. VDA’07.
Wong, N., Carpendale, S., and Greenberg, S. (2003). Edge-
lens: An interactive method for managing edge con-
gestion in graphs. In Information Visualization, 2003.
INFOVIS 2003. IEEE Symposium on, pages 51–58.
IEEE.
Xu, K., Rooney, C., Passmore, P., Ham, D.-H., and Nguyen,
P. H. (2012). A user study on curved edges in graph
visualization. Visualization and Computer Graphics,
IEEE Transactions on, 18(12):2449–2456.
Zhou, H., Xu, P., Yuan, X., and Qu, H. (2013). Edge
bundling in information visualization. Tsinghua Sci-
ence and Technology, 18(2):145–156.
Zhou, H., Yuan, X., Cui, W., Qu, H., and Chen, B.
(2008). Energy-based hierarchical edge clustering
of graphs. In Visualization Symposium, 2008. Paci-
ficVIS’08. IEEE Pacific, pages 55–61. IEEE.
IVAPP 2016 - International Conference on Information Visualization Theory and Applications
116
