
Non-linear Distance-based Semi-supervised Multi-class Gesture
Recognition
Husam Al-Behadili
1,2
, Arne Grumpe
2
and Christian W
¨
ohler
2
1
Electrical Engineering, University of Mustansiriyah, Al-Mustansiriyah, Box 46007, Baghdad, Iraq
2
Image Analysis Group, TU Dortmund University, Otto-Hahn-Str. 4, D–44227, Dortmund, Germany
Keywords:
Data Stream, Nearest Class Mean, Incremental Learning, Semi-supervised Learning, Kernel.
Abstract:
The automatic recognition of gestures is important in a variety of applications, e.g. human-machine-
interaction. Commonly, different individuals execute gestures in a slightly different manner and thus a fully
labelled dataset is not available while unlabelled data may be acquired from an on-line stream. Consequently,
gesture recognition systems should be able to be trained in a semi-supervised learning scenario. Additionally,
real-time systems and large-scale data require a dimensionality reduction of the data to reduce the processing
time. This is commonly achieved by linear subspace projections. Most of the gesture data sets, however, are
non-linearly distributed. Hence, linear sub-space projection fails to separate the classes. We propose an ex-
tension to linear subspace projection by applying a non-linear transformation to a space of higher dimensional
after the linear subspace projection. This mapping, however, is not explicitly evaluated but implicitly used by
a kernel function. The kernel nearest class mean (KNCM) classifier is shown to handle the non-linearity as
well as the semi-supervised learning scenario. The computational expense of the non-linear kernel function
is compensated by the dimensionality reduction of the previous linear subspace projection. The method is
applied to a gesture dataset comprised of 3D trajectories. The trajectories were acquired using the Kinect
sensor. The results of the semi-supervised learning show high accuracies that approach the accuracy of a fully
supervised scenario already for small dimensions of the subspace and small training sets. The accuracy of the
semi-supervised KNCM exceeds the accuracy of the original nearest class mean classifier in all cases.
1 INTRODUCTION
The recognition of gestures has become an impor-
tant element of human-machine interaction. Since the
amount of available gesture data is small and does
not cover all possible manners of performing a ges-
ture, the classification system may benefit from semi-
supervised learning to adapt to new users. A large
amount of unlabelled gesture data may be available
or acquired on-line. Semi-supervised learning, i.e.
pre-training the classifier on a supervised dataset and
updating the training set using the labels assigned by
the classifier (Zhu and Goldberg, 2009), solves these
problems in different applications of machine learn-
ing. However, the problems arising here are possibly
non-linearly separable distributions of the data, high
dimensionality, computational complexity of classi-
fier retraining and potentially false labels assigned
by the classifier that will effect the performance of
the classifier after the next training cycle. Hence, it
is desirable to design a system that may operate us-
ing low-dimensional subspace projections of the data
while still being able to separate non-linearly separa-
ble data distributions with high accuracy to guaran-
tee the success of the semi-supervised learning. This
work focuses on the recognition of emblematic ges-
tures which are performed in 3D space with one arm
and acquired with a Kinect sensor.
1.1 Related Work
Metric learning is an important concept for both unsu-
pervised and semi-supervised learning. Examples of
metric learning are k-nearest neighbour (kNN) (Guil-
laumin et al., 2009; Cover and Hart, 1967; Boiman
et al., 2008; Altman, 1992), prototype learning with
adaptive distance metric (Schneider et al., 2009),
Nearest Class Mean (NCM) (Webb, 2003), and Near-
est Class Mean Multi-class Loistic Discrimination
(NCMC) (Mensink et al., 2013a,b). A kNN classifier
determines the distance between a sample to be clas-
sified and each training sample. The method proposed
282
Al-Behadili, H., Grumpe, A. and Wöhler, C.
Non-linear Distance-based Semi-supervised Multi-class Gesture Recognition.
DOI: 10.5220/0005674102800286
In Proceedings of the 11th Joint Conference on Computer Vision, Imaging and Computer Graphics Theory and Applications (VISIGRAPP 2016) - Volume 3: VISAPP, pages 282-288
ISBN: 978-989-758-175-5
Copyright
c
2016 by SCITEPRESS – Science and Technology Publications, Lda. All rights reserved

by Schneider et al. (2009) provides a representation of
the training set based on prototype vectors and assigns
a sample to a class based on an appropriately cho-
sen or learned distance metric. In the NCM method
suggested by Webb (2003), the Mahalanobis distance
between the query sample and the class-specific sam-
ple mean vectors measures the similarity between the
query sample and the classes. The NCMC framework
extends the NCM method applying an optimal projec-
tion that enforces the samples within the same class
to have a smaller distance to its corresponding class
mean than samples from other classes (Mensink et al.,
2013a,b).
1.2 Contribution
The performance of the classifier in semi-supervised
learning scenarios is very sensitive to the classifier ac-
curacy in the previous classification process. Hence,
we need to build a classifier that is robust against
outliers, has high accuracy, and is quickly retrained
in near constant time. The NCMC classifier pro-
posed by Mensink et al. (2013a) uses a linear sub-
space projection approximating the covariance matrix
to reduce the computational complexity of modern
high-dimensional classification problems. Most ges-
ture datasets, however, are are not linearly separable.
We extend the NCMC towards linearly unseparable
datasets by applying the kernel trick to improve the
performance of the NCMC in such environments and
make it less sensitive to the dimensionality of the data.
To avoid an increased runtime, the kernel function is
applied after the linear subspace projection. The pro-
posed algorithm shows an increased accuracy in both
linear and non-linear system as well as a reduced time
of processing in most cases.
2 FUNDAMENTALS
2.1 Non-linear Nearest Class Mean with
Multiple Class Centroid (NCMC)
The nearest class mean classifier implemented by
Mensink et al. (2013a) looks for the closest centroid
µ
µ
µ
c
of class c to assign the corresponding class label to
the instance with feature vector x of dimensionality
D. If we have a new sample x, the distance between
this sample and the centroid µ
µ
µ
c
of class c is d(x, µ
µ
µ
c
).
This new sample is labelled by ˆc, corresponding to the
class with the minimum distance among the distances
from N
classes
classes to this sample:
ˆc = argmin
c∈
{
1,...,N
classes
}
d(x, µ
µ
µ
c
). (1)
The centroid of class c is the mean of the N
c
instances
x
i
of class c:
µ
µ
µ
c
=
1
N
c
N
c
∑
i=1
x
i
. (2)
The squared Mahalanobis distance specified by the
covariance matrix M
M
M, i.e.
d(x, µ
µ
µ
c
) = (x − µ
µ
µ
c
)
T
M
M
M(x − µ
µ
µ
c
), (3)
was applied by Mensink et al. (2013a). Further-
more, it is assumed by Mensink et al. (2013a) that
M
M
M = W
W
W
T
W
W
W , since M
M
M is a positive semi-definite ma-
trix. The matrix W
W
W ∈ R
h×D
is a low-rank metric and
h ≤ D is the effective dimension of the subspace pro-
jection. Consequently,
d(x, µ
µ
µ
c
) = (x − µ
µ
µ
c
)
T
W
W
W
T
W
W
W (x − µ
µ
µ
c
)
=
k
W
W
W x −W
W
W µ
µ
µ
c
k
2
2
. (4)
The posterior of the class c given an instance x is
defined by Mensink et al. (2013a) as
p(c|x) =
exp
−
1
2
d(x, µ
µ
µ
c
)
N
classes
∑
˜c=1
exp
−
1
2
d(x, µ
µ
µ
˜c
)
(5)
assuming uniformly distributed classes and a
normally distributed likelihood, i.e. p(x|c) =
N (µ
µ
µ
c
,W
W
W
T
W
W
W ). The covariance W
W
W
T
W
W
W is shared across
all classes. The log-posterior of the correct prediction
is maximized using a stochastic gradient descent to
obtain the optimal projection matrix W
W
W (Mensink
et al., 2013a).
For non-linear spaces, the single centroid of each
class is replaced by Mensink et al. (2013a) by multi-
ple prototypes, which are obtained using the k-means
algorithm. The query samples are then assigned to the
class of the nearest centroid. Assuming a mixture of
normal distributions centred at the N
centroids
centroids
m
c, j
, j ∈
{
1, . . . , N
centroids
}
for each class c, the poste-
rior probability of class c is defined by Mensink et al.
(2013a) as
p(c|x) =
N
centroids
∑
j=1
p(m
c, j
|x), with (6)
p(m
c, j
|x) =
exp
−
1
2
d(x, m
c, j
)
N
classes
∑
c=1
N
centroids
∑
˜
j=1
exp
−
1
2
d(x, m
c,
˜
j
)
. (7)
2.2 Kernel based Metrics
Kernels are proposed to solve non-linear separation
problems in different types of machine learning algo-
rithms. As described in detail by Theodoridis et al.
Non-linear Distance-based Semi-supervised Multi-class Gesture Recognition
283
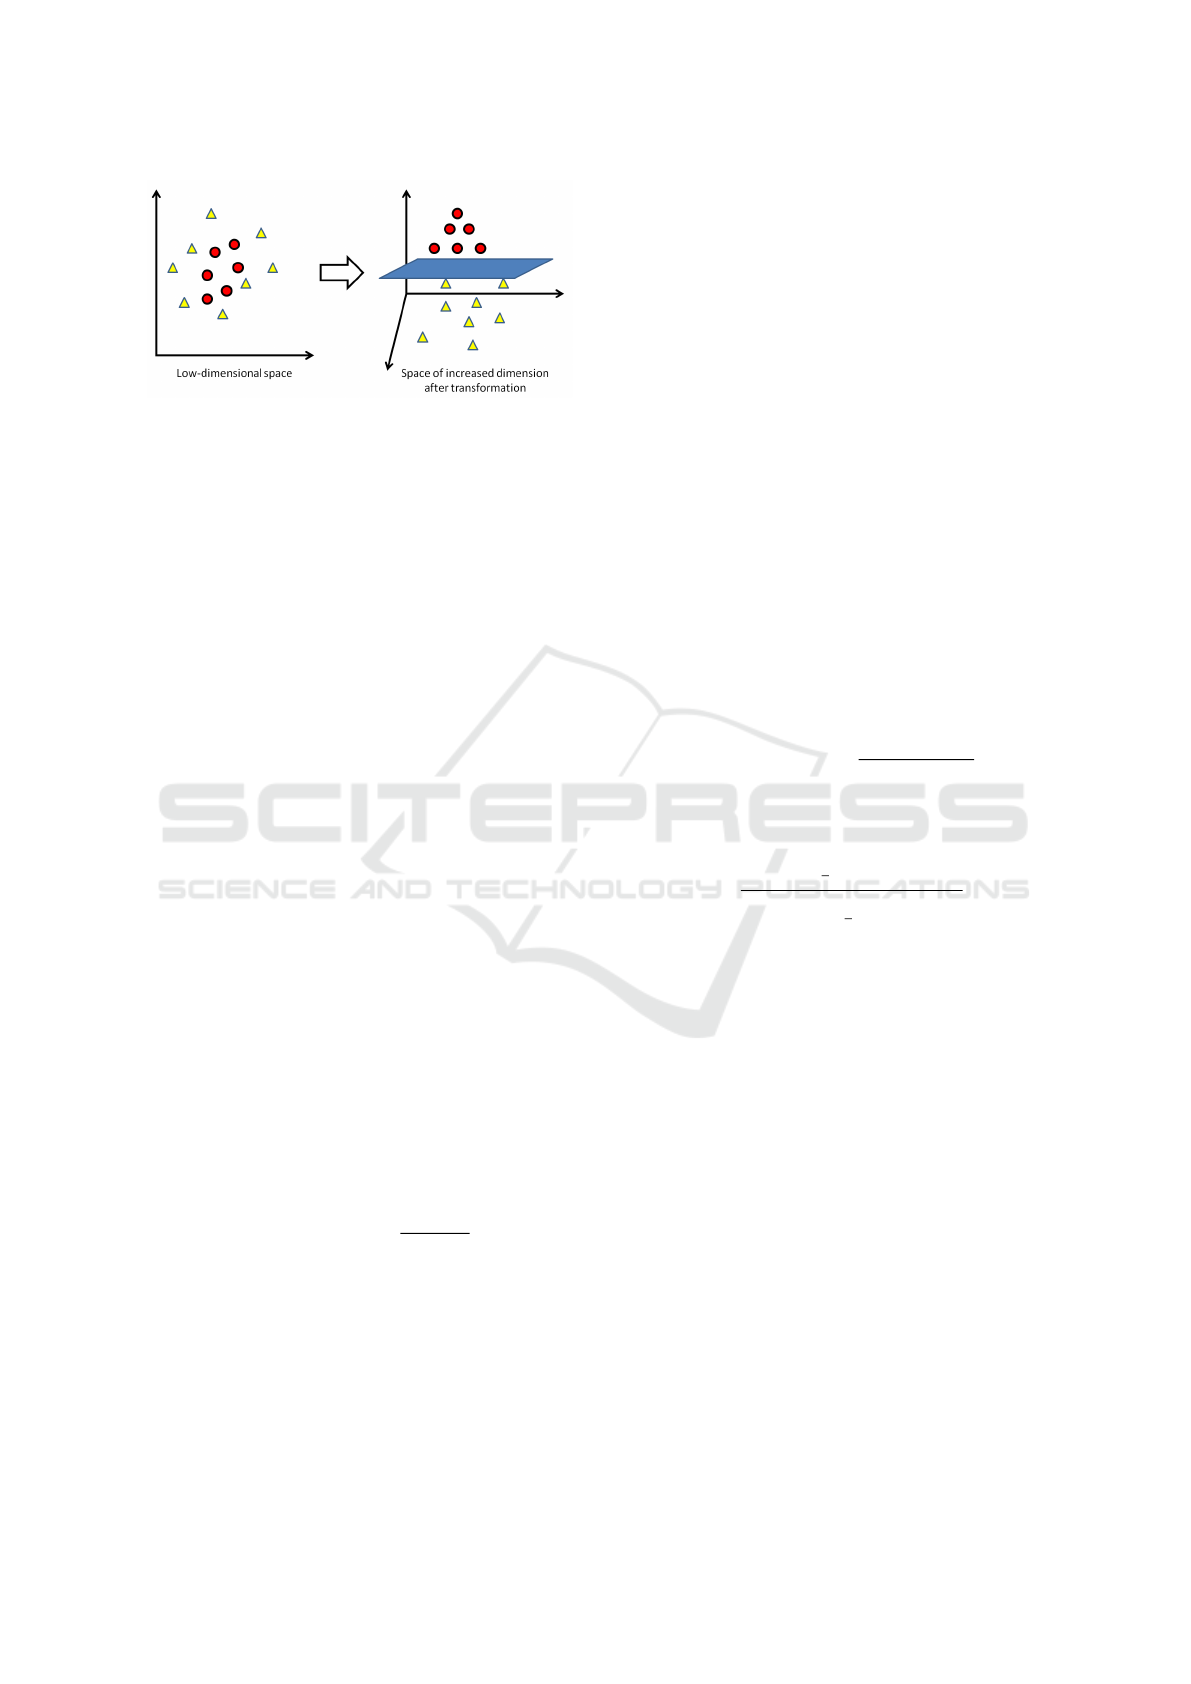
Figure 1: Kernel trick. By transforming the original
space (left) into a space of increased dimension (right) the
two classes circle and square become linearly separable.
Adapted from Elmezain et al. (2009).
(2010), the transformation ϕ
ϕ
ϕ : R
D
× R −→ R
H
is
a generally non-linear transformation of the feature
space R
D
to a space R
H
of increased dimension
H . Due to the transformation ϕ
ϕ
ϕ, a linear separation,
i.e. a separating hyperplane, in R
H
becomes a non-
linear separating function when projected back onto
the original feature space. Consequently, the classes
may become linearly separable after the transforma-
tion into the space of increased dimension. An exam-
ple is shown in Fig. 1.
Commonly, it is sufficient to compute inner prod-
ucts in the higher dimensional space, e.g. computing
the Euclidean distance of samples from the separating
hyperplane. The so-called “kernel Trick” utilizes this
fact. As shown by Theodoridis et al. (2010), if the
mapping of the vectors x and
ˆ
x satisfies Mercer’s the-
orem it is not required to evaluate or know the map-
ping ϕ
ϕ
ϕ, and the inner product may be replaced by the
kernel function
K(x,
ˆ
x) =
h
ϕ
ϕ
ϕ(x), ϕ
ϕ
ϕ(
ˆ
x)
i
H
= ϕ
ϕ
ϕ(x)
T
ϕ
ϕ
ϕ(
ˆ
x). (8)
Consequently, it is possible to evaluate the inner prod-
uct in the high dimensional space by applying a pos-
sibly non-linear kernel function K(x,
ˆ
x) to the repre-
sentations x and
ˆ
x in the original space. Examples of
common kernel functions are polynomial kernels or
Gaussian kernels (Theodoridis et al., 2010). In this
work, the kernel function is a radial basis function
(RBF) of Gaussian shape given by
K
RBF
(x,
ˆ
x) = exp
−
k
x −
ˆ
x
k
2
2
(2σ
2
)
!
, (9)
where σ denotes the predefined width of the ker-
nel function. The Gaussian RBF kernel is shift-
invariant. Consequently, the similarity metric learned
using RBF kernels will be coordinate-independent
(Kung, 2014).
3 PROPOSED KERNEL NCM
(KNCM)
This work extends the work of Al-Behadili et al.
(2015), who proposed a kernel-based distance met-
ric. We extend this idea towards semi-supervised
learning of non-linearly separable classes using a low-
dimensional kernel-based data representation. Recall-
ing the distance proposed by Mensink et al. (2013a)
d(x, µ
µ
µ
c
) =
k
W
W
W x −W
W
W µ
µ
µ
c
k
2
2
and setting
˜
x = W
W
W x and
˜
µ
µ
µ
c
= W
W
W µ
µ
µ
c
, the distance becomes
d(x, µ
µ
µ
c
) =
k
˜
x −
˜
µ
µ
µ
c
k
2
2
=
˜
x
T
˜
x −
˜
x
T
˜
µ
µ
µ
c
−
˜
µ
µ
µ
T
c
˜
x +
˜
µ
µ
µ
T
c
˜
µ
µ
µ
c
. (10)
Applying the transformation to a higher-dimensional
space to
˜
x and
˜
µ
µ
µ
c
, respectively, yields the kernel based
distance
d
kernel
(
˜
x,
˜
µ
µ
µ
c
) = K(
˜
x,
˜
x) − K(
˜
x,
˜
µ
µ
µ
c
)
− K(
˜
µ
µ
µ
c
,
˜
x) + K(
˜
µ
µ
µ
c
,
˜
µ
µ
µ
c
), (11)
which, in case of a Gaussian RBF, is given by
d
kernel
(x, µ
µ
µ
c
) = 2 − 2exp
−
k
W
W
W x −W
W
W µ
µ
µ
c
k
2
2σ
2
!
. (12)
Adopting the approach of Mensink et al. (2013a) we
obtain the posterior probability
p(c|x) =
exp
−
1
2
d
kernel
(x, µ
µ
µ
c
)
N
classes
∑
˜c=1
exp
−
1
2
d
kernel
(x, µ
µ
µ
˜c
)
(13)
and compute the matrix W
W
W by maximizing the log-
posterior of the correct prediction using gradient as-
cent.
4 DATASET
Since KNCM is proposed to work with non-linear
systems without losing the key features of NCMC,
i.e. the accuracy and the short processing time, we
apply it to a non-linearly separable gesture dataset.
We will evaluate and compare the recognition perfor-
mance of the KNCM approach with that of the the
NCMC method.
A Kinect sensor has been used by Fothergill et al.
(2012) to acquire a database of gestures which are
mainly performed with both hands simultaneously.
A database of emblematic gestures performed with
a single forearm and hand has been published by
Richarz and Fink (2011), where the 3D trajectories
were inferred from stereo image data. A dataset
VISAPP 2016 - International Conference on Computer Vision Theory and Applications
284
of single-arm emblematic gestures acquired with a
Kinect sensor is described by Al-Behadili et al.
(2014)
1
. We use the dataset of Al-Behadili et al.
(2014), but since each gesture is repeated three times
in the published version, we performed a subdivision
of the dataset into single repetitions, resulting in 2878
gestures altogether. The first six features are adopted
from Al-Behadili et al. (2014): three features for the
x, y and z coordinates of the mean vector, and three
features for the extension along the x, y and z axis.
The motion direction is transformed into the seventh
feature as follows:
• A principal component analysis of the dataset is
performed. A 3D trajectory is considered a two-
axes gesture if the projection on the eigenvec-
tor belonging to the second-largest eigenvalue is
larger than 60% of the projection on the eigen-
vector belonging to the largest eigenvalue. In this
case, the first two principal components are kept
for the subsequent analysis. Otherwise, only the
first principal component is kept as the gesture
then is a one-axis gesture.
• The signs of the selected principal components are
computed for each coordinate.
• A value of 1 (2) is assigned if more than 80% of
the coordinates are positive (negative). In the case
of no predominant direction, a value of 3 is as-
signed. Principal components not selected by the
described procedure are assigned a value of 0.
• The assigned direction values are concatenated in
the order of the principal components, forming a
base-4 number which is then transformed to a dec-
imal number denoting the direction information.
The total length of the normalized gesture is taken as
the last feature. We found this compact set of fea-
tures to be a favourable choice after having performed
many experiments with more extensive feature sets
proposed by e.g. Bhuyan et al. (2008) and Yoon et al.
(2001) including position, speed, direction, orienta-
tion, curvature, chain code etc.
5 EXPERIMENTS AND RESULTS
5.1 Experimental Setup
Since falsely assigned labels have a strong effect on
the performance of a semi-supervised learning algo-
rithm, we introduce a confidence threshold and re-
ject possible outliers, i.e. samples exceeding a dis-
1
The complete dataset is available at http://www.bv.e-
technik.tu-dortmund.de
tance threshold. The labels of samples that do not
exceed the threshold are added to the training dataset
of the classifier. The same approach is applied to the
KNCM and the NCMC classifiers, respectively. We
used the code of NCMC
2
as published by Mensink
et al. (2013a).
The threshold is based on an independent valida-
tion dataset. Consequently, the full dataset is subdi-
vided into four parts: a labelled initial training set, a
labelled validation set, an unlabelled learning set and
a labelled test set. At the beginning of the experi-
ment, the classifiers are adapted to the initial training
set and the confidence threshold is computed based on
the validation set. The learning set is further subdi-
vided into so-called “buckets” that represent a stream
of data. The buckets are presented to the classifiers
one by one. The classifiers then assign labels to the
samples contained in the bucket, respectively, and add
the samples that do not exceed the training threshold
with the assigned labels to the training data. Then the
classifiers are adapted to the extended training set, and
a new confidence threshold is computed. This process
is repeated until the last bucket has been presented
to the classifiers. After each training process of the
classifiers, we evaluate the accuracy of the classifiers
based on the test set. In addition to the accuracy, we
track the computation time required by each training
and prediction stage and the training set size. Addi-
tionally, we train a second version of each classifier
with the correct labels to evaluate the performance of
a fully supervised learning scenario in each step.
The semi-supervised learning experiment is re-
peated for three different sizes of the initial training
set: 1%, 5% and 10% of the total dataset. In all exper-
iments, the test and the validation set comprise 20%
and 15% of the total dataset, respectively. The re-
mainder is the unlabelled learning set, which is sub-
divided into buckets of 100 samples each. The sets
are formed using a class-wise random partition, i.e.
1% of the training set corresponds to 1% of the sam-
ples from each class, respectively. Since each of the
nine gestures in the dataset is represented by a dif-
ferent amount of samples, the amount of samples in
the initial training set may be as low as two sam-
ples in the case of class nine and an initial training
set comprising 1% of the total data. Each experiment
is repeated for four different dimensions of the sub-
space h =
{
2, 4, 6, 8
}
, respectively, resulting in twelve
different experiments. Due to the random partition
of the data, the results of the experiments may de-
pend on how the initial training set has been selected.
To estimate the expected outcome of the experiment,
each experiment is repeated 100 times with a differ-
2
https://staff.fnwi.uva.nl/t.e.j.mensink/code.php
Non-linear Distance-based Semi-supervised Multi-class Gesture Recognition
285
(a) (b)
(c) (d)
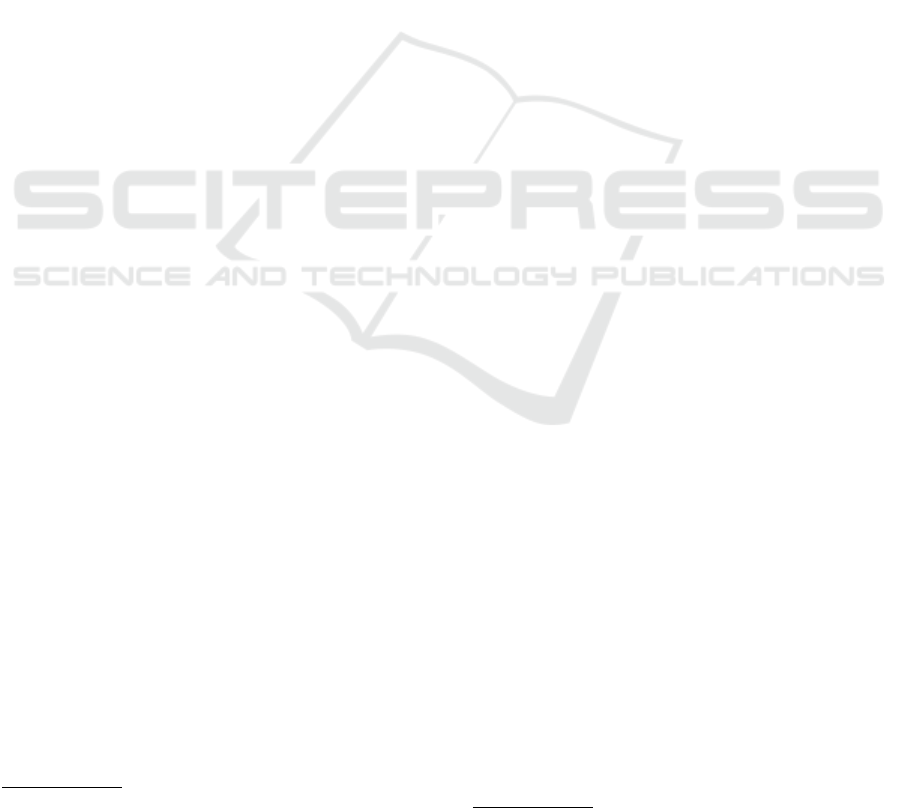
Figure 2: Median prediction accuracy of the classifiers for an initial training set comprising 1% of the total data. KNCMS
and NCMCS denote the supervised version of the KNCM and NCMC, respectively. The dashed lines correspond to the 25%
and 75% quantiles and represent the spread over 100 repetitions. (a) h = 2. (b) h = 4. (c) h = 6. (d) h = 8.
(a) (b)
(c) (d)
Figure 3: Median prediction accuracy of the classifiers for 5% of the total data used as initial training set. KNCMS and
NCMCS denote the supervised version of the KNCM and NCMC, respectively. The dashed lines correspond to the 25% and
75% quantiles and represent the spread over the 100 repetitions. (a) h = 2. (b) h = 4. (c) h = 6. (d) h = 8.
ent random permutation. Both classifiers use the same
random permutation for each experiment during these
100 repetitions.
The NCMC requires the specification of the num-
ber of centroids per class N
centroids
. There is, however,
a function within the utilised code package published
by Mensink et al. (2013a) that computes the optimal
number of centroids per class. We apply this code to
specify the best N
centroids
for each projection matrix
dimension. The resulting values were N
centroids
= 2
for the four dimensions of the subspace, respectively.
In case of N
centroids
> N
c
, i.e. the number of class c
samples in the initial training is smaller than the num-
ber of centroids, we start by setting N
centroids
> N
c
and
then gradually increase N
centroids
until it equals the op-
timal value.
5.2 Results and Performances Study
Figs. 2–4 show the prediction accuracy of KNCM and
NCMC. Notably, the first bucket corresponds to the
initial training set. The remaining results thus may
be directly compared to the result obtained by using
the initial training set. For large training sets (see Fig.
4), the accuracy of the KNCM equals the accuracy
of the supervised version. The high initial accuracy
VISAPP 2016 - International Conference on Computer Vision Theory and Applications
286
(a) (b)
(c) (d)
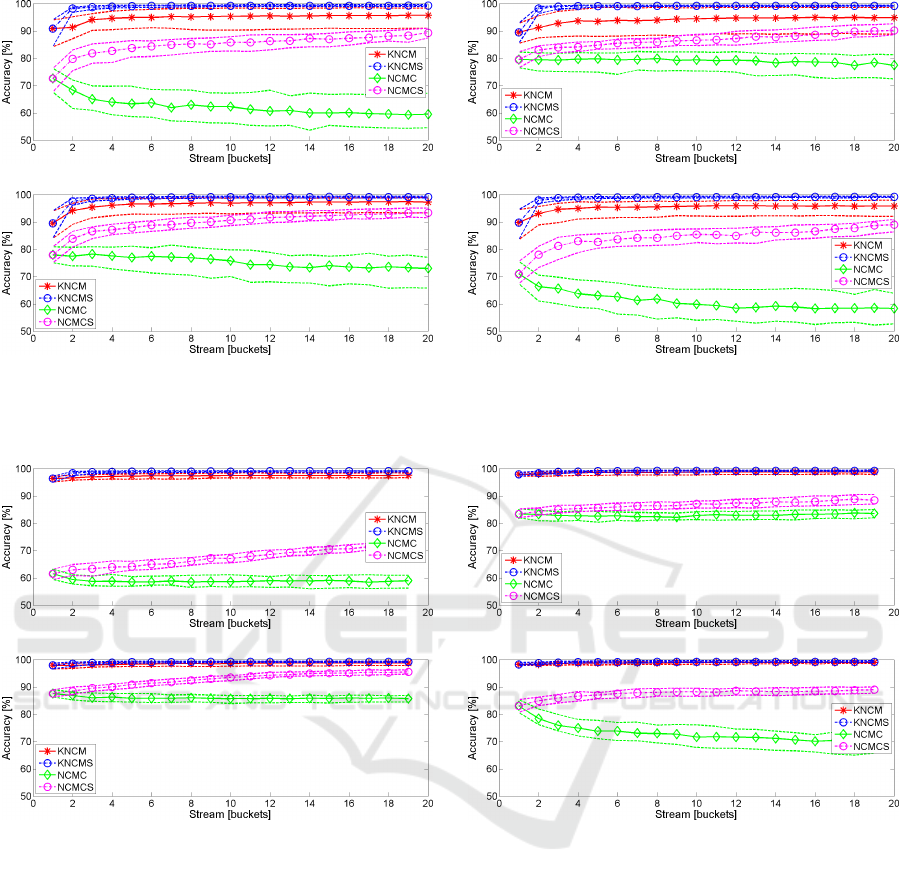
Figure 4: Median prediction accuracy of the classifiers for 10% of the total data used as initial training set. KNCMS and
NCMCS denote the supervised version of the KNCM and NCMC, respectively. The dashed lines correspond to the 25% and
75% quantiles and represent the spread over the 100 repetitions. (a) h = 2. (b) h = 4. (c) h = 6. (d) h = 8.
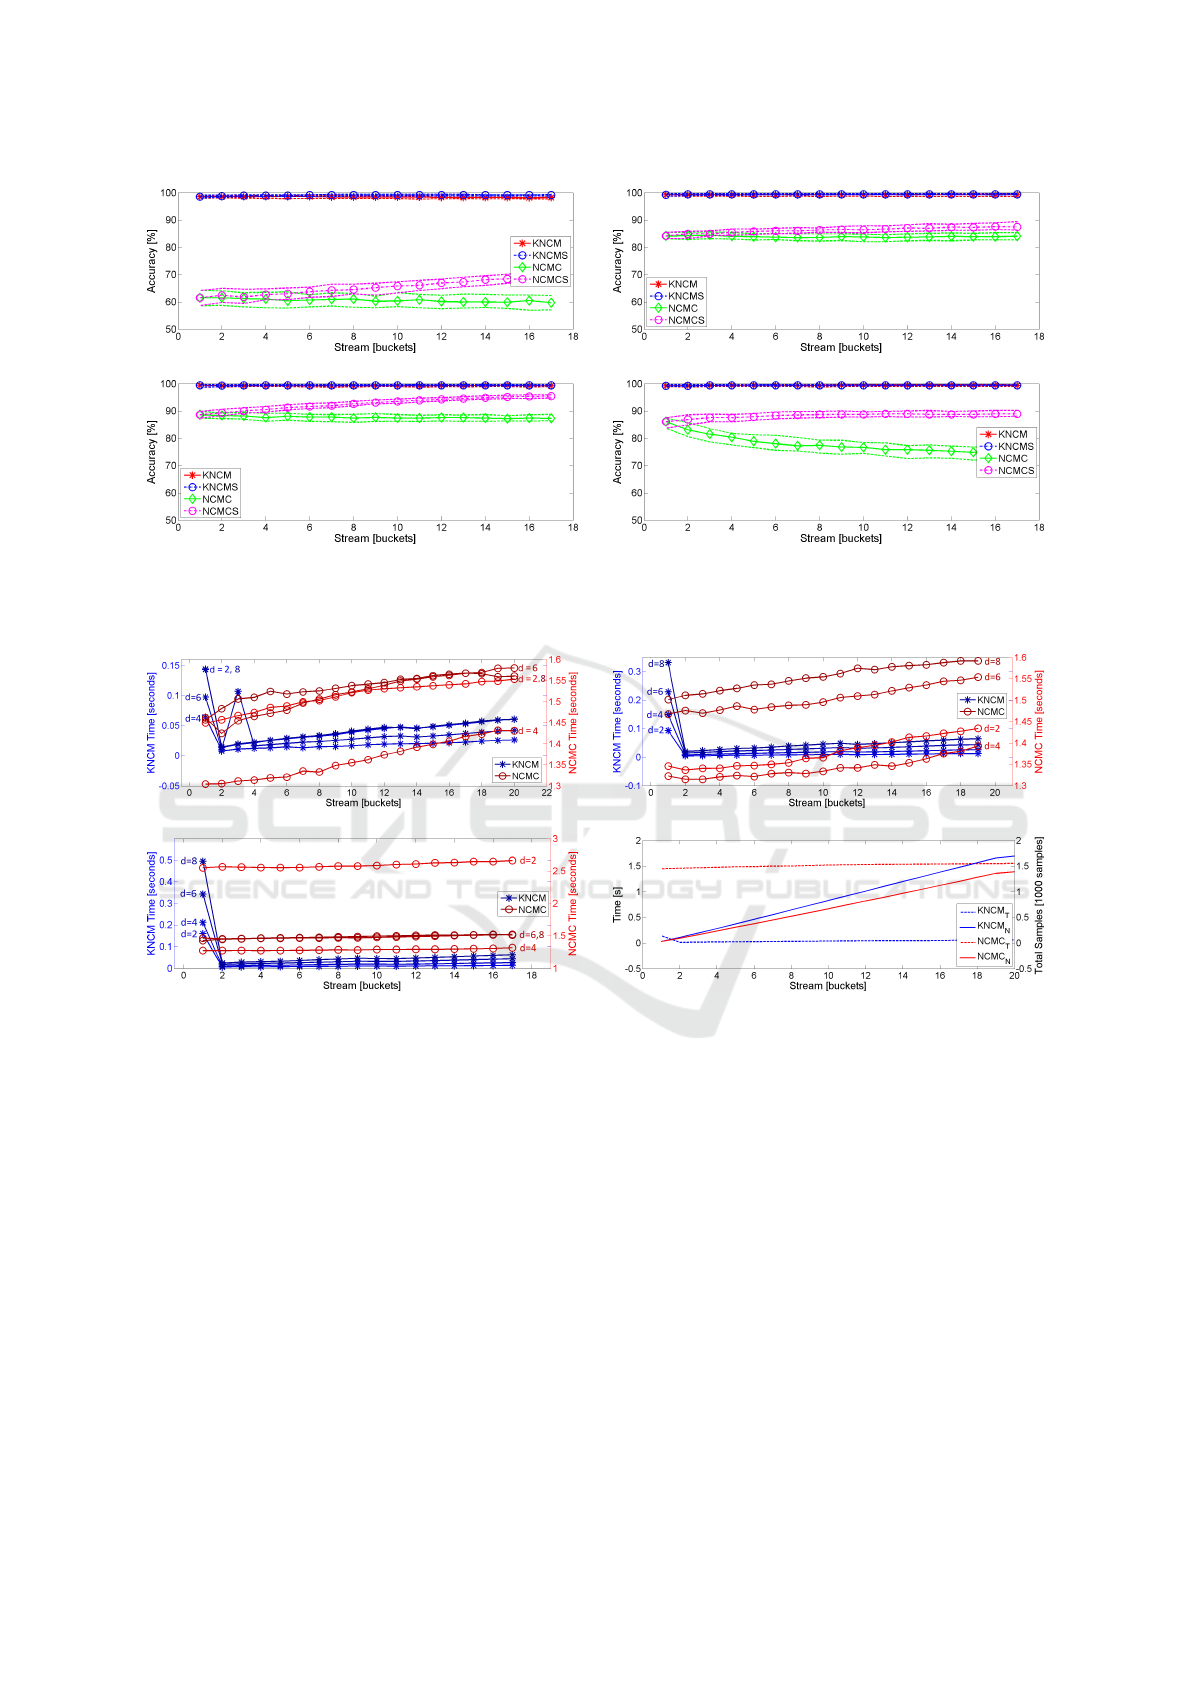
(a) (b)
(c) (d)
Figure 5: Time consumed by the classifiers. (a) Initial training set: 1% of total data. (b) Initial training set: 5% of total
data. (c) Initial training set: 10% of total data. (d) Runtime (KNCM
T
and NCMC
T
) and samples in the training set (KNCM
N
and NCMC
N
) for the KNCM and the NCMC, respectively. The initial training set size is 1% of the total data, and the
dimensionality is h = 2.
is kept throughout the learning process. If the size
of the training set is reduced (see Fig. 2–3) the ac-
curacy of the semi-supervised KNCM does not reach
the optimal value of the fully supervised KNCM. It,
however, increases strongly over the first few buck-
ets and approaches the fully supervised KNCM. The
difference between the semi-supervised KNCM and
the fully supervised KNCM increases with decreas-
ing dimensions of the projection subspace. However,
the effect of the subspace dimension on the KNCM
accuracy is rather subtle and thus it is possible to use
subspace projections of very low dimension.
The accuracy of the NCMC, in contrast, shows a
larger difference to its fully supervised counterpart if
the number of presented buckets increases. While the
fully supervised NCMC shows an increasing accuracy
in the course of the learning experiment, the accuracy
of the semi-supervised NCMC seems constant in the
best case and exhibits a strong decrease in some ex-
periments. Both the semi-supervised NCMC and the
fully supervised NCMC do not reach the accuracy of
the KNCM in all experiments. The decreasing accu-
racy of the NCMC suggests that the NCMC adds false
labels to the training set. This may be due to the low
initial prediction accuracy. The effect is less notice-
able if the size of the training set increases. Further-
Non-linear Distance-based Semi-supervised Multi-class Gesture Recognition
287

more, this effect seems to be strong for both the full
dimension of the data set and a very small subspace
dimension. The former may be related to the estima-
tion of many parameters while the latter may be due to
in insufficient subspace dimension that does not allow
for a separation of the classes.
In addition to the gain in prediction accuracy, the
runtime of the KNCM is considerably lower than the
runtime of the NCMC, as shown in Fig. 5. The de-
creasing accuracy of the NCMC suggests that the
NCMC method results in the addition of more false
labels to the training set, possibly leading to a larger
total number of samples. However, the opposite is
true. Fig. 5(d) shows the median runtime and the me-
dian of the training set size for an initial training set
comprising 1% of the total data and a dimensionality
of h = 2. This exemplary semi-supervised learning
progress is similar to the other experiments. Fig. 5(d)
clearly shows that the runtime is independent of the
training set size.
6 CONCLUSION
The proposed KNCM shows an increased accuracy
and a lower runtime in comparison to the original
NCMC. The high accuracy is maintained for ex-
tremely small dimensional subspace projections. Fur-
thermore, the KNCM and its ability to reject outliers
has been demonstrated in a semi-supervised learning
scenario of gestures. The semi-supervised KNCM
achieves accuracies that are comparable to a fully su-
pervised learning scenario. Since the proposed algo-
rithm is not limited to gesture data, it is expected to be
applicable to any semi-supervised learning scenario.
REFERENCES
Al-Behadili, H., W
¨
ohler, C., and Grumpe, A. (2014). Semi-
supervised learning of emblematic gestures. AT-
AUTOMATISIERUNGSTECHNIK, 62(10):732–739.
Al-Behadili, H., W
¨
ohler, C., and Grumpe, A. (2015). Non-
Linear Distance Based Large Scale Data Classifica-
tions. In 3’rd International conference on image In-
formation Processing (ICIIP), page In Press. IEEE.
Altman, N. S. (1992). An introduction to kernel and nearest-
neighbor nonparametric regression. The American
Statistician, 46(3):175–185.
Bhuyan, M., Bora, P., and Ghosh, D. (2008). Trajec-
tory guided recognition of hand gestures having only
global motions. International Journal of Computer
Science, Fall.
Boiman, O., Shechtman, E., and Irani, M. (2008). In de-
fense of nearest-neighbor based image classification.
In Computer Vision and Pattern Recognition, 2008.
CVPR 2008. IEEE Conference on, pages 1–8. IEEE.
Cover, T. and Hart, P. (1967). Nearest neighbor pattern clas-
sification. Information Theory, IEEE Transactions on,
13(1):21–27.
Elmezain, M., Al-Hamadi, A., Rashid, O., and Michaelis,
B. (2009). Posture and Gesture Recognition for
Human-Computer Interaction. In Jayanthakumaran,
K., editor, Advanced Technologies, pages 415–440.
InTech, Rijeka, Croatia.
Fothergill, S., Mentis, H., Kohli, P., and Nowozin, S.
(2012). Instructing people for training gestural inter-
active systems. In Proceedings of the SIGCHI Confer-
ence on Human Factors in Computing Systems, pages
1737–1746. ACM.
Guillaumin, M., Mensink, T., Verbeek, J., and Schmid, C.
(2009). Tagprop: Discriminative metric learning in
nearest neighbor models for image auto-annotation. In
Computer Vision, 2009 IEEE 12th International Con-
ference on, pages 309–316. IEEE.
Kung, S. Y. (2014). Kernel Methods and Machine Learning.
Cambridge University Press.
Mensink, T., Verbeek, J., Perronnin, F., and Csurka, G.
(2013a). Distance-based image classification: Gener-
alizing to new classes at near-zero cost. IEEE Trans-
actions on Pattern Analysis and Machine Intelligence,
35(11):2624–2637.
Mensink, T., Verbeek, J., Perronnin, F., and Csurka, G.
(2013b). Large scale metric learning for distance-
based image classification on open ended data sets. In
Advanced Topics in Computer Vision, pages 243–276.
Springer.
Richarz, J. and Fink, G. A. (2011). Visual recognition of
3d emblematic gestures in an hmm framework. Jour-
nal of Ambient Intelligence and Smart Environments,
3(3):193–211.
Schneider, P., Biehl, M., and Hammer, B. (2009). Adap-
tive relevance matrices in learning vector quantiza-
tion. Neural Computation, 21(12):3532–3561.
Theodoridis, S., Pikrakis, A., Koutroumbas, K., and
Cavouras, D. (2010). Introduction to Pattern Recog-
nition: A Matlab Approach. Academic Press.
Webb, A. R. (2003). Statistical pattern recognition. John
Wiley & Sons.
Yoon, H.-S., Soh, J., Bae, Y. J., and Yang, H. S. (2001).
Hand gesture recognition using combined features of
location, angle and velocity. Pattern recognition,
34(7):1491–1501.
Zhu, X. and Goldberg, A. B. (2009). Introduction to Semi-
supervised Learning. Synthesis lectures on artificial
intelligence and machine learning. Morgan & Clay-
pool Publishers.
VISAPP 2016 - International Conference on Computer Vision Theory and Applications
288
