
The Problem of Measurement Accuracy in Sensor Networks for IAQ
Monitoring
Andrzej Szczurek, Monika Maciejewska and Tomasz Pietrucha
Laboratory of Sensor Technique and Indoor Air Quality Studies, Wroclaw University of Technology,
Wybrzeze Wyspanskiego 27, 57-370, Wroclaw, Poland
Keywords:
Indoor Air Quality, Sensor, Monitoring, Accuracy, Network.
Abstract:
These days, the problem of indoor air quality (IAQ) attracts increasing attention. Presently, IAQ is usually
characterised on the basis of the following parameters: temperature, relative humidity and carbon dioxide
concentration. Because of spatial and temporal variation of these parameters multi-point monitoring systems
which operate continuously are preferred. The aim of this work was to show that accuracies of sensors being
elements of a network have serious implications for a continuous, fixed-point monitoring of IAQ. The analysis
was based on four-point IAQ monitoring study performed in a lecture hall. With reference to the measurement
accuracy we computed how likely it was that sensors located in different points recorded the same value of
measured quantity and how frequently such situations occurred. It was found that: (1) number of sensors and
their displacement affect information provided by the measurement system; (2) these aspects should be con-
sidered individually for each parameter describing IAQ ; (3) the sensor device dedicated to each measurement
point should be considered individually. By considering these issues in the design process the cost of IAQ
monitoring network as well as information redundancy may be reduced.
1 INTRODUCTION
In last decades, indoor air quality (IAQ) has drawn
considerable attention in both the public and scien-
tific domains (Fanger, 2006). Due to rising energy
costs, buildings are willingly built or renovated to be
air tight. In this way, the air exchange between indoor
and outdoor environmentis seriously reduced. In con-
sequence, the unwanted heat loss is reduced. The neg-
ative effect of energy saving is the degradation of air
quality in such objects. Bad indoor air quality has a
significant impact on human health, safety, produc-
tivity and comfort (Sundell, 2004; Sarbu and Pacu-
rar, 2015). This is especially important in developed
countries where people spend major fraction of their
time indoors.
Recently, much effort has gone into improving in-
door air quality (Persily, 2015). In order to perform
this task, there is required monitoring of IAQ which
provides valuable information to building managers,
policy makers, health professionals as well as scien-
tific researchers. In this work, we want to discuss
some aspects of the accuracy of measurement devices
which should be taken into account in the design of
IAQ monitoring system (Hughes and Hase, 2010).
Our attention was focused on the influence of sensor
accuracy on the location and the composition of sen-
sor unit.
Currently, indoor air quality is rarely monitored
(Kim et al., 2015; Varas-Muriel, 2014). Although
the need for IAQ monitoring is great, the availabil-
ity of cost-effective systems is low. Majority of
homes and commercial buildings built today are not
equipped with IAQ control systems. Regular indoor
air monitoring is typically limited to smoke and car-
bon monoxide (CO) detectors. Some advanced heat-
ing, ventilation and air conditioning (HVAC) systems
use carbon dioxide (CO
2
) sensors to control ventila-
tion (Hesaraki and Holmberg, 2015). HVAC engi-
neers have known for a long time that CO
2
measure-
ments coupled with temperature and humidity read-
ings give an indication of the effectiveness of the
HVAC system in the building.
Typical environmental analysis consists of tak-
ing single-point measurements of pollutant concen-
trations. This approach is controversial in the case
of IAQ investigation, because parameters describing
physical and chemical conditions inside building may
vary significantly even within the same room. Espe-
cially, indoor pollutants distribution can be spatially
non-uniform. Therefore, IAQ monitoring requires a
Szczurek, A., Maciejewska, M. and Pietrucha, T.
The Problem of Measurement Accuracy in Sensor Networks for IAQ Monitoring.
DOI: 10.5220/0005645101490157
In Proceedings of the 5th International Confererence on Sensor Networks (SENSORNETS 2016), pages 149-157
ISBN: 978-989-758-169-4
Copyright
c
2016 by SCITEPRESS – Science and Technology Publications, Lda. All rights reserved
149

cost-effective, widely-accessible, distributed, station-
ary sensor network, which is capable of measuring se-
lected IAQ parameters at various locations over time,
simultaneously (Liu and Zhai, 2009). Basically, this
system can be formed by a number of small measur-
ing units which are able to obtain information from
their surroundings by means of sensors and transmit
it towards a base station using wire or wireless com-
munications. The data from individual monitoring
locations are compiled and analyzed. The locations
chosen for sensor units depend on the purpose of the
monitoring. Using this system, a more detailed repre-
sentation of IAQ is gained.
Several factors like cost, power consumption,
space utilization or measurement characteristics de-
cide about the applicability of sensor networks (Shan
et al., 2012; Jelicic et al., 2013). The stationary mon-
itoring network has a serious limitation. It can deter-
mine IAQ only at points where sensors are installed.
Therefore the appropriate number of fixed monitoring
points and reliable sensor localization is a key issue
in the design of this system. In practice, the applied
sensor units may be too expensive for large-scale and
fine grained deployment (Kumar et al., 2011). Thus,
existing structures, or even new buildings, with sen-
sor networks is a costly process. The selection of the
number of sensors to install and the site for each sen-
sor is one of the most critical aspects to be considered
for the overall monitoring system effectiveness. Plac-
ing the sensor in the wrong location will defeat the
purpose for which it is intended.
IAQ relates to a number of environmental factors,
inside a building, which can impinge on the health,
comfort or work performance of the buildings occu-
pants. Therefore, real IAQ monitoring systems re-
quire multiple types of devices for continuous, in real-
time detection and measurements of temperature, hu-
midity, and numerous toxic (hazardous) gases. Cur-
rently, different models of sensors are available in the
market for monitoring these parameters. IAQ mon-
itoring involves the application of technologies that
can provide information at different level of reliabil-
ity (Peng et al., 2013). Achieving high-quality IAQ
evaluation with small number of inexpensive sensors
is challenging now.
The aim of this work is to show that the number
and location of sensors in IAQ monitoring networks
is strongly affected by the accuracies of these mea-
surement devices. Taking this into consideration may
allow to reduce data redundancy and build more cost
effective and power efficient sensor systems. This is
especially important for wireless sensor networks. It
should be noted that professionalIAQ monitoring sys-
tems very often have to face constraints of high power
consumption and the excessive cost of applied sensor
units.
The rest of the paper is structured as follows. We
start from the Experimental part which presents the
scope of sensors-based IAQ measurement study. The
next section, Methods contains the description of an
approach proposed to study the performance of a sen-
sor set with reference to the accuracies of individual
sensors. With this approach we analyzed the out-
come of IAQ monitoring study. The obtained re-
sults are presented and commented in the Results and
discussion section. Individual subsections of it are
dedicated to temperature, relative humidity and CO
2
measurements. The generalization of our results is
proposed in Conclusions.
2 EXPERIMENTAL
Indoor air quality monitoirng study was carried out in
a university lecture hall, see Fig. 1. The room may be
considered as representative for this category of in-
door spaces. It has an amphitheatrical layout. Down
at the front, a narrow dais is the place for a lecturer.
The first row of seats for students starts about some
distance from the dais and the last row touches the
back wall. Hall dimensions are given in Fig. 2. Desk-
tops and seats form a compact zone, which is a place
for 90 listeners (10 rows, 9 seats in each). Lecture
hall is fitted with openable windows, which take up
one wall. The air is exchanged via natural ventilation.
Figure 1: Lecture hall in which there was conducted IAQ
monitoring study.
Measurement session took place in Spring 2015
(April, May, June) and it lasted 8 days. Experiments
were performed on Wednesdays in subsequent weeks.
We were interested in lecture time i.e. the period from
9:15 to 18:15. Experiments consisted in instrumental
SENSORNETS 2016 - 5th International Conference on Sensor Networks
150
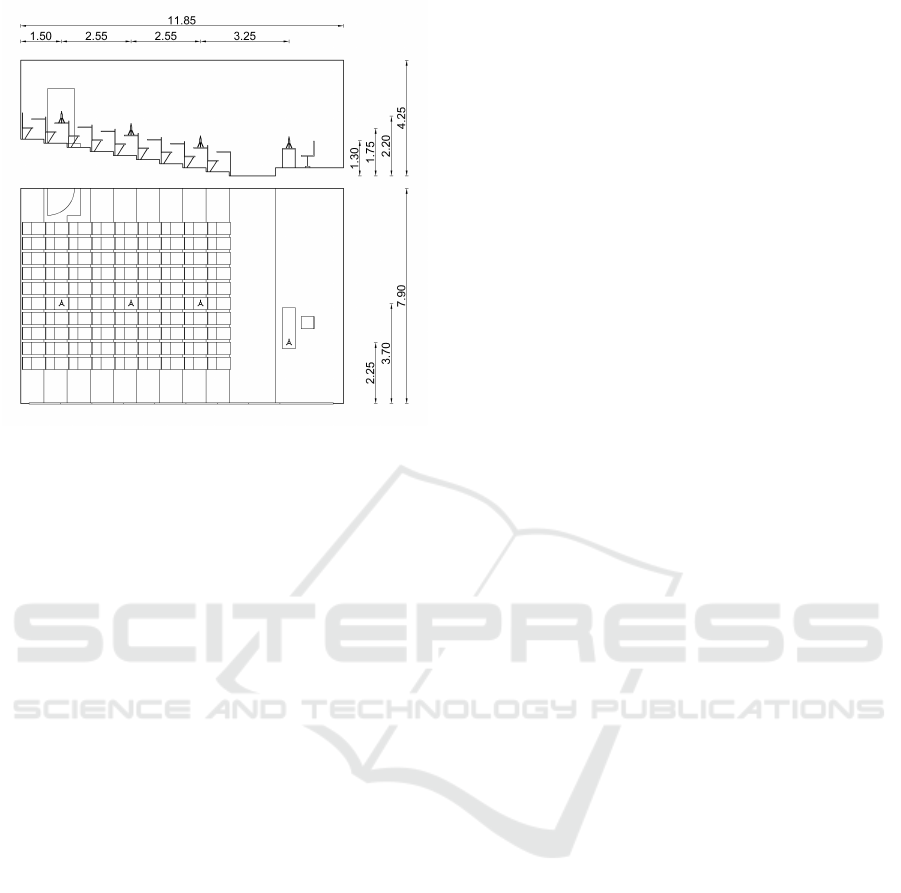
Figure 2: Distributionof measurement points in lecture hall.
In each location there were monitored: temperature, relative
humidity and CO
2
concentration.
measurements of indoor air parameters and the obser-
vation of factors influencing IAQ.
The instrumental part of IAQ study involved the
monitoring of three basic indoor air parameters: tem-
perature, relative humidity and carbon dioxide con-
centration. For this purpose we used sensor devices
which measured these three parameters in parallel.
Most important technical specifications of sensors are
presented in Table 1. They represent a preset standard
offered in terms of measurement solutions for the rou-
tine determination of indoor air quality. Measurement
data was recorded with time resolution of 1 min.
Monitoring was performed at four places within
the room. The location of sensor devices is shown in
Fig. 2. One of them (no. 1) was placed by the lec-
turer’s seat. Three others were distributed along the
hall’s central axis in the third (no. 2), sixth (no. 3)
and ninth (no. 4) row of seats. Sensor devices were
assigned to measurement points. Upon selection of
sensors locations we took into account the amphithe-
atrical layout of the room and students distribution,
see Fig. 9. Measuring instruments were placed on
desktops i.e. in students’ breathing zone. Typically,
in the immediate vicinity of sensors the seats were
left free in order to eliminate the direct influence of
occupants on the readouts.
In addition to sensor measurements there were ob-
served factors which influence IAQ. We considered:
number of students present in the room, their spatial
distribution, degree of opening for each window, time
and duration of windows and door opening, blinds
use. The data was collected concerning temporal
variation of these factors. The obtained information
helped to interpret the results of analysis presented in
this work.
3 METHODS
Accuracy of measurement is defined as the closeness
of agreement between a measured quantity value and
a true quantity value of a measurand (i.e. quantity
intended to be measured (JCGM, 200:2008). Accord-
ing to some references (JCGM, 200:2008), the con-
cept ”measurement accuracy” is not a quantity and it
is not given a numerical value. A measurement is said
to be more accurate when it offers a smaller measure-
ment error.
Nevertheless, producers of measurement devices
oftentimes provide the numerical information about
the accuracy of measurement. It is typically under-
stood as the maximum distance between the true and
measured value of a quantity.
We made several assumptions for the purpose of
our analysis.
1. The true value x
true
of the the measurand X be-
longs to the 2A-wide interval around the measured
value x
m
if
x
true
∈ hx
m
− A, x
m
+ Ai (1)
where A is the measurement accuracy.
2. Two values x
true1
and x
true2
may be considered
different if the interval which hosts the true value
x
true1
and the interval which hosts the true value
x
true2
do not have common part. Namely, when
hx
m1
− A
1
, x
m1
+ A
1
i ∩ hx
m2
− A
2
, x
m2
+ A
2
i = ∅
(2)
where A
1
and A
2
are the accuracy of measurement
1 and measurement 2 of the same quantity X, re-
spectively.
3. Two values x
true1
and x
true2
may be considered
equal when the two intervals have common part
i.e.
hx
m1
− A
1
, x
m1
+ A
1
i ∩ hx
m2
− A
2
, x
m2
+ A
2
i 6= ∅.
(3)
4. Using I
i
to denote the interval around the mea-
sured value which includes the true value
I
i
= hx
mi
− A
i
, x
mi
+ A
i
i (4)
one may formulate the generic versions of crite-
ria, given by eq. 2 and eq. 3, which are applicable
to i = 1...N measurement results. Namely, we as-
sume that N true values x
true1
, x
true2
, ...., x
trueN
are
different, if there is no common part shared by the
associated I
i
intervals
The Problem of Measurement Accuracy in Sensor Networks for IAQ Monitoring
151
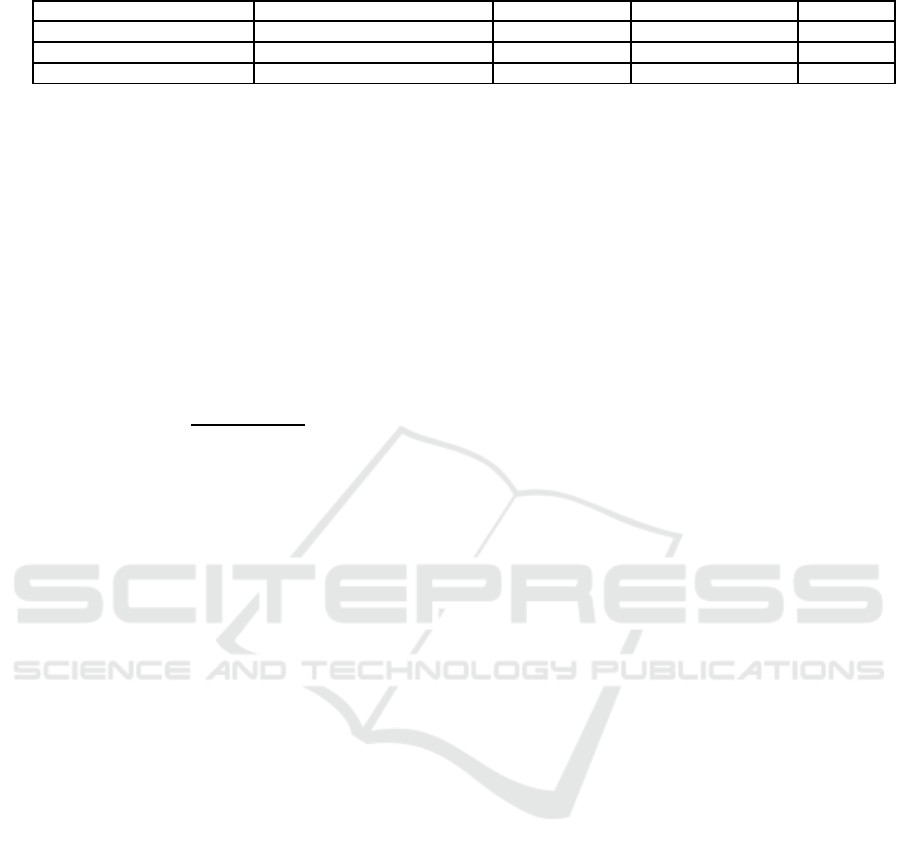
Table 1: Measuring characteristics of sensors applied for indoor air monitoring.
Measured quantity Type of sensor Measuring range Accuracy Resolution
carbon dioxide concentration Non dispersive infrared (NDIR) 0 ... 500 ppm 50 ppm + 3 % m.v. 1 ppm
temperature Thermistor NTC 10 kΩ -20 ... 60
◦
C 0.2
◦
C or 0.15% m.v. 0.1
◦
C
relative humidity Capacitive sensor 5 ... 100% 2 % 0.1 %
I
1
∩ I
2
∩ ...I
N
= ∅. (5)
Otherwise, i.e. when N intervals have a part which
is common for all of them
I
1
∩ I
2
∩ ...I
N
6= ∅. (6)
then N true values x
true1
, x
true2
, ...., x
trueN
may be
recognized as equal.
5. The degree of overlap between intervals I
i
may be
represented by the width of the interval which is
their common part. We used it as the basis for
constructing index L
L =
|I
1
∩ I
2
∩ ...I
N
|
|2A|
(7)
which is the ratio between the width of the ac-
tual common part of N intervals and the maximum
width of the common part, i.e. 2A. The index is
equal zero in case of lack of overlap. For a com-
plete overlap L equals one.
L may be interpreted as the likelihood that N mea-
surement results refer to the same real value of the
measured quantity. In other words, it is a likeli-
hood that a single point measurement would be
sufficient to provide the true value of the mea-
surand in the space covered by N measurement
points.
We applied the above listed assumptions to analyse
the data collected during a four-point IAQ monitoring
study which was carried out in a lecture hall. We were
interested in the importance of the measurement accu-
racy in the design of sensor network for IAQ monitor-
ing .
Essentially, we compared measurements per-
formed by N = 4 sensors, each located in different
measurement point (see Fig. 2). The analysis was
performed for pairs of sensors (1-2, 1-3, 1-4, 2-3, 2-4,
3-4), for sensor triplets (1-2-3, 1-2-4, 2-3-4) and for
the quartet of sensors (1-2-3-4).
Temperature, relative humidity and carbon diox-
ide concentration were examined individually. The
measurement accuracies used in calculations were
following, T: 0.2
◦
C, RH: 2 % RH and CO
2
concen-
tration: 50 + 3% measured value, as given in Table
1.
The analysis was performed in time steps. A sin-
gle time step was 1 minute long. Entire monitoring
period was divided into such intervals. For a single
time step it was determined: 1) whether individual
sensors recorded equal values of the measured param-
eter, 2) the L index.
Based on (1) we computed how frequently a par-
ticular set of sensors recorded the same value of the
measured quantity during one day. Following (2), all
nonzero L values were averaged within the period of
one day. The obtained index represented the average
degree of overlap between information provided by
different measurement points at times when the I in-
tervals overlap existed. The results obtained for indi-
vidual days were aggregated for the purpose of pre-
sentation.
Box and whiskers plot was applied in order to vi-
sualize the aggregate results. In the plot, a single box
refers to one set of data. The central mark in the box
is the median of the data set. The edges of the box are
the 25
th
and 75
th
percentiles. The whiskers extend to
the most extreme data points not considered outliers.
Outliers are plotted individually using crosses.
All necessary scripts were written in Matlab.
4 RESULTS AND DISCUSSION
4.1 Temperature
In Fig. 3 we show the results of temperature monitor-
ing in the lecture hall during an exemplary day. More
precisely, we plotted the limits of intervals I (see eq.
4) which are expected to host true values of temper-
ature in each measurement point on the subsequent
minutes of the monitoring period.
In Fig. 4 we present how frequently sensors lo-
cated in different measurement points recorded tem-
perature values which could be considered equal. In
Table 2 we show the L index which envisages the like-
lihood that one sensor would be sufficient to provide
a true value of temperature, which is representative
for all places where the particular set of sensors was
distributed.
Based on our results, the existence of common
part between I intervals for temperature measured in
different locations within lecture hall was basically
limited to pairs of sensors. As shown in Fig. 4, an
overlap was most frequently observed for measure-
ment points 1-2 (70 % of measurement period), 1-3
SENSORNETS 2016 - 5th International Conference on Sensor Networks
152
0 1 2 3 4 5 6 7 8 9
19
20
21
22
23
24
25
26
27
Time [h]
I intervals for T [C]
measurement point 1
measurement point 2
measurement point 3
measurement point 4
Figure 3: I intervals around temperature values recorded by
four sensors located in different measurement points. Re-
sults come from an exemplary day of the monitoring study.
1−2−3−41−2−3 1−2−4 1−3−4 2−3−4 1−2 1−3 1−4 2−3 2−4 3−4
0
0.1
0.2
0.3
0.4
0.5
0.6
0.7
0.8
0.9
1
Set of measurement points
Frequency of occurence
Figure 4: How frequently sensors located in different mea-
surement points recorded temperature values which could
be considered equal.
(55 %) and 3-4 (45 %). When the overlap existed, I
intervals shared about 40 % of their width (see Table
2). Interestingly, we noticed an overlap in pairs 1-2
and 1-3 rather than in pairs 1-2 and 2-3, as would be
suggested by the vertical as well as horizontal proxim-
ity of sensors (see Fig. 2). This fact may be explained
by the exceptional character of location 1. Based on
Fig. 3, if one arranged measurement points according
to the increasing temperature, the sequence would be
as follows: point 2, 1, 3 and 4. Except for point 1, the
positions of others in the row could be easily associ-
ated with the height of measuring instrument above
the lowest floor level. The obtained temperature data
reflected the existence of thermal stratification in the
room. Sensor 1 recorded greater values than sensor
2 and smaller than sensor 3 because of an additional
heat source at the lecturer’s seat - a computer system
for overhead projection.
Table 2: L index for temperature. Average for the cases
when there existed a common part of I intervals.
Set of measuring points I intervals overlap [%]
1-2-3-4 0.00 ± 0.00
1-2-3 3.26 ± 5.65
1-2-4 5.36 ± 5.26
1-3-4 20.05 ± 10.68
2-3-4 6.56 ± 7.07
1-2 40.15 ± 5.38
1-3 47.35 ± 6.08
1-4 34.86 ± 6.61
2-3 18.14 ± 12.90
2-4 17.21 ± 14.13
3-4 39.99 ± 10.92
In case of three-sensors combinations the same
value of temperature was recorded less frequently
than 10 % of the overall monitoring period (see Fig.
4). The identity of records form four measurement
points was extremely rare, less than 1 % of time.
Our analysis showed that, in an amphitheatrical
lecture hall, spatial temperature variation was de-
tectable at a horizontal distance of less than two me-
ters based on measurements performed with the ac-
curacy of 0.2
◦
C. Therefore, it is reasonable to ap-
ply multi-point temperature monitoring indoors using
standard instruments. Data redundancy is relatively
low. Of course, the ultimate distribution of measure-
ment points would be mainly driven by the goal of
maintaining human comfort in an occupied zone.
Temperature sensors are small, cheap and battery
powered. Their calibration is rarely required. Sen-
sor devices may operate unattended for weeks, even
months. Therefore, numerous measurement points
are affordable in case of temperature monitoring in-
doors. It is important. As we have shown, in view
of the available measurement accuracy, there may be
required temperature sensors displacement on quite a
dense grid in order to properly characterize indoor air.
4.2 Relative Humidity
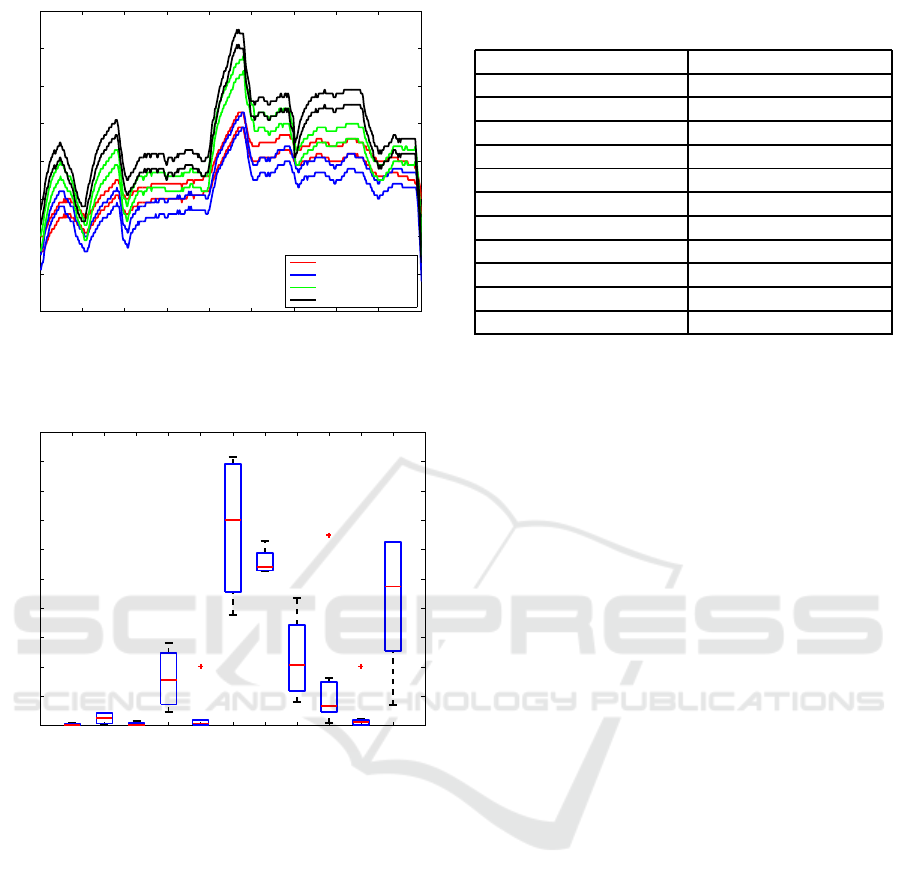
In Fig. 5 we show the results of relative humidity
monitoring in the lecture hall during an exemplary
day. More precisely, we plotted the limits of intervals
I (see eq. 4) which are expected to host true values
of RH on the subsequent minutes of the monitoring
period in different measurement points.
In Fig. 6 we show how frequently RH sensors
placed in different measurement points recorded val-
ues which could be considered equal. In Table 3 we
present the likelihood that one sensor would be suf-
ficient to provide a true value of humidity, which is
representative for all places where particular sensors
were located.
The Problem of Measurement Accuracy in Sensor Networks for IAQ Monitoring
153
0 1 2 3 4 5 6 7 8 9
36
38
40
42
44
46
48
50
52
54
56
Time [h]
I intervals for RH [%]
measurement point 1
measurement point 2
measurement point 3
measurement point 4
Figure 5: I intervals around RH values recorded by four
sensors located in different measurement points. Results
come from an exemplary day of the monitoring study.
1−2−3−41−2−3 1−2−4 1−3−4 2−3−4 1−2 1−3 1−4 2−3 2−4 3−4
0
0.1
0.2
0.3
0.4
0.5
0.6
0.7
0.8
0.9
1
Set of measurement points
Frequency of occurence
Figure 6: How frequently sensors located in different mea-
surement points recorded relative humidity values which
could be considered equal.
Table 3: L index for relative humidity. Average for the cases
when there existed a common part of I intervals.
Set of measuring points I intervals overlap [%]
1-2-3-4 46.99 ± 7.44
1-2-3 50.27 ± 7.99
1-2-4 49.55 ± 7.87
1-3-4 63.07 ± 8.84
2-3-4 56.48 ± 6.29
1-2 65.34 ± 10.67
1-3 66.51 ± 10.61
1-4 64.92 ± 10.15
2-3 66.50 ± 6.12
2-4 63.35 ± 6.94
3-4 79.42 ± 2.52
From our results, the overlap between I intervals
for RH recorded in different measurement points was
very frequent. As shown in Fig. 6, this relation was
observed between 80 to 100 % of the overall monitor-
ing period. Computations revealed that the frequency
of overlap was nearly the same in groups of two, three
as well as all four measurement points. In view of the
available RH measurement accuracy, nearly all time
of the monitoring study air humidity was the same in
each measurement point. Just on one day we observed
smaller overlap between RH in measurement point 1
and the remaining locations. Although such occur-
rences shall not to be ignored, this situation could be
considered as episodic.
Based on Fig. 5 also the degree of overlap be-
tween I intervals around RH values recorded simul-
taneously in different measurement points was very
high. From the numbers given in Table 3 we see that
in case of entire sensor network, common part of I in-
tervals was as big as 47 %. Of course, for individual
pairs of sensors the degree of overlap was still higher
and equal 60 to 80 %.
Very high frequency and degree of overlap for I
intervals in case of RH pointed at the considerable re-
dundancy while using multi-point layout for collect-
ing data about air humidity. Instruments which mea-
sure RH with the accuracy of 2 % were not able to
detect spatial variation of this parameter in the lecture
hall. Actually, when accepting this level of accuracy,
the original multi-point monitoring network could be
reduced down to one measurement point. In case of
taking care for the lecturers comfort individually, two
RH sensors would be needed, one located in point 1
and the other located at point 2, 3 or 4.
Similar as in case of temperature measuring units,
humidity sensors are small, cheap and durable. From
the point of view of cost, installation and maintenance
multi-point RH monitoring networks indoors are af-
fordable. However, our findings indicate that they
may not be needed. Their creation shall be carefully
thought over, with reference to the accuracy of the
available measuring devices.
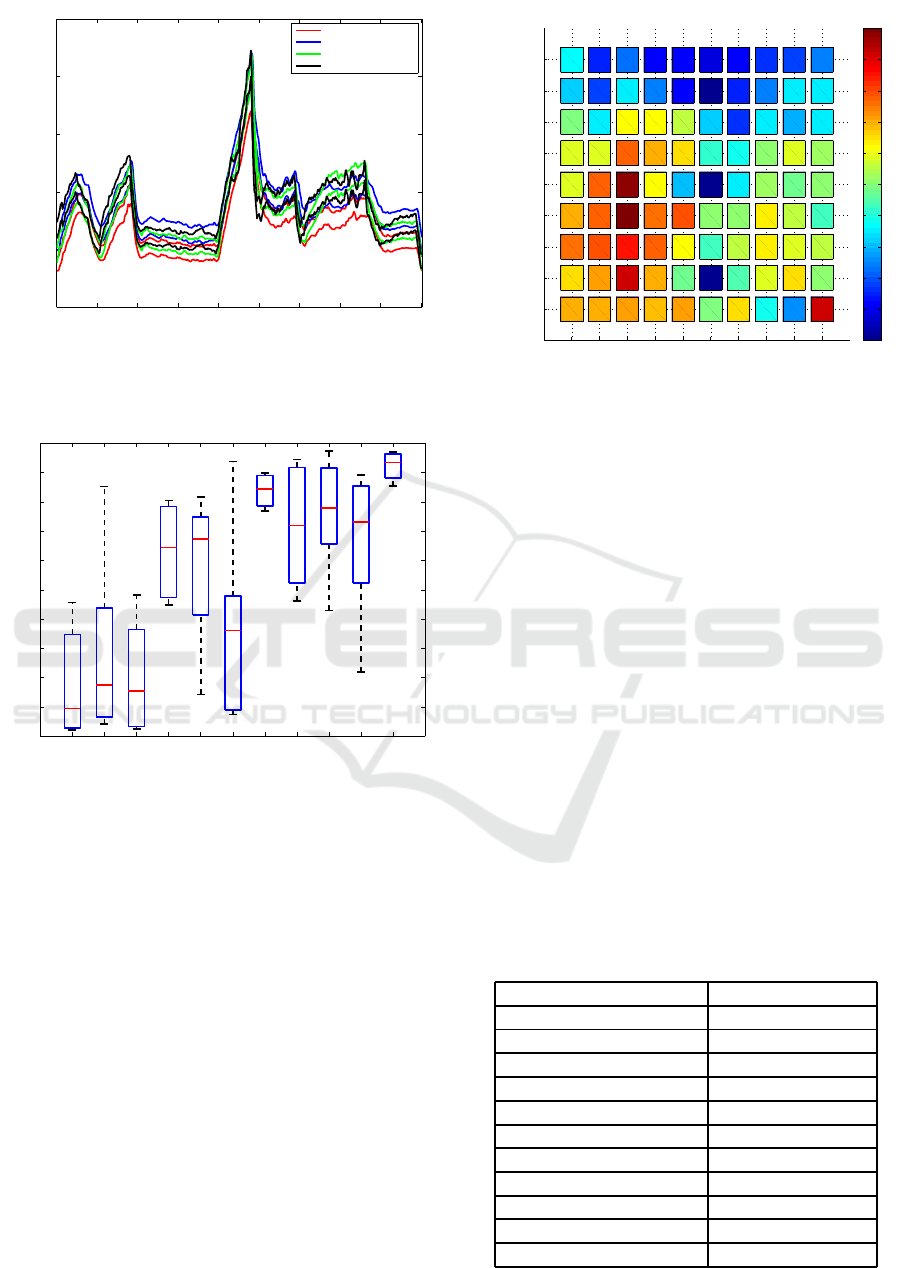
4.3 CO
2
Concentration
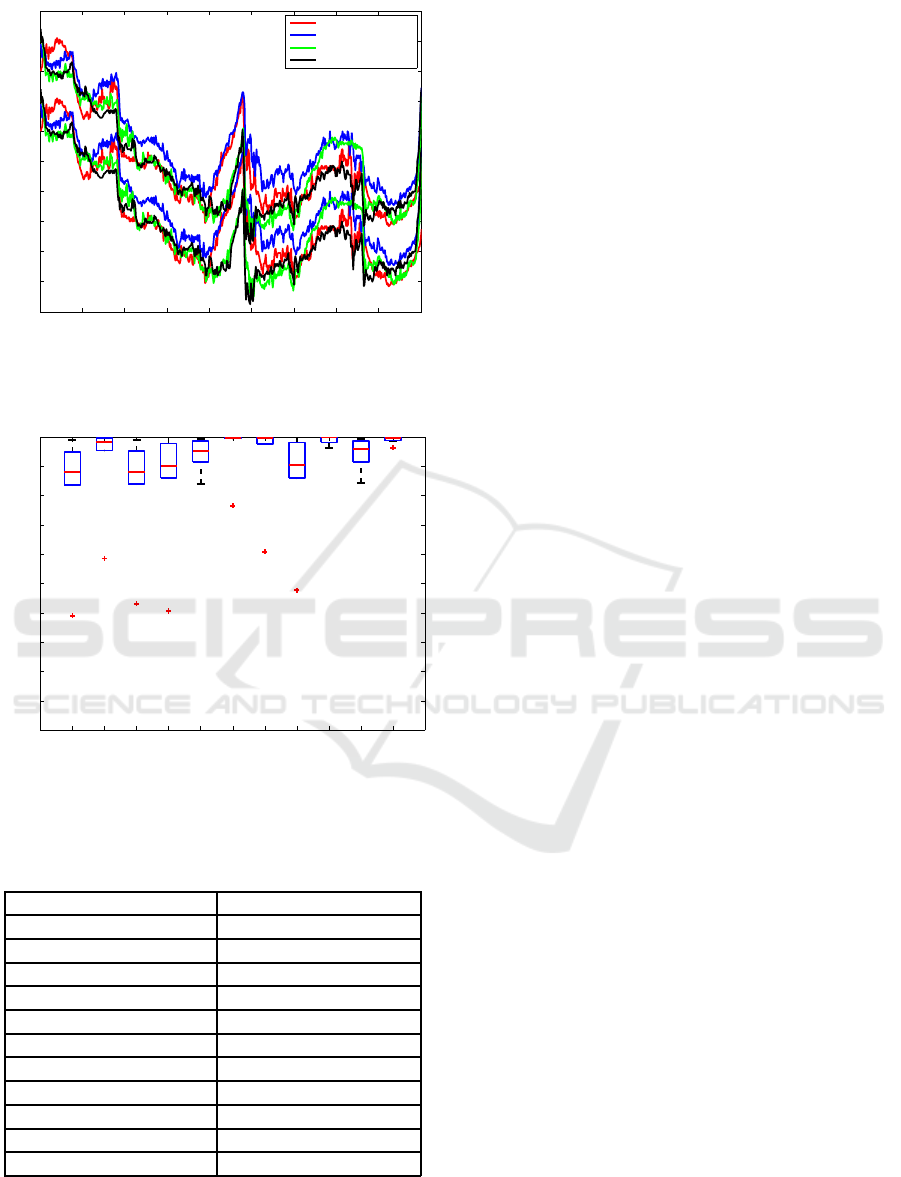
In Fig. 7 we show the results of CO
2
concentration
monitoring in the lecture hall during an exemplary
day. More precisely, we plotted the limits of I inter-
vals (see eq. 4) which are expected to host true values
of CO
2
concentration in each measurement point on
the subsequent minutes of the monitoring period.
In Fig. 8 we show how frequently carbon diox-
ide sensors located along the main axis in the lecture
hall and at the lecturers seat rerecorded concentra-
tions which could be considered equal. In Table 4 we
present the probability that one sensor would be suf-
ficient to provide a true value of CO
2
concentration,
SENSORNETS 2016 - 5th International Conference on Sensor Networks
154
0 1 2 3 4 5 6 7 8 9
0
500
1000
1500
2000
2500
Time [h]
I intervals for CO
2
concentration [ppm]
measurement point 1
measurement point 2
measurement point 3
measurement point 4
Figure 7: I intervals around CO
2
concentration values
recorded by four sensors located in different measurement
points. Results come from an exemplary day of the moni-
toring study.
1−2−3−41−2−3 1−2−4 1−3−4 2−3−4 1−2 1−3 1−4 2−3 2−4 3−4
0
0.1
0.2
0.3
0.4
0.5
0.6
0.7
0.8
0.9
1
Set of measurement points
Frequency of occurence
Figure 8: How frequently sensors located in different mea-
surement points recorded CO
2
concentration values which
could be considered equal.
which is representative for all places where particular
sensors were distributed.
The temporal variation of CO
2
concentration
shown in Fig. 6 well reflects room occupancy.
Namely, sudden increase of concentration is always
associated with the beginningof the lecture, when stu-
dents enter the room. Sudden decrease appears when
students leave the hall for the break.
Based on Fig. 8, most rarely the same CO
2
con-
centrations were recorded in measurement points 1
and 2. Such situations occurred on average during
40 % of the measurement period. For other pairs of
sensors the percentage was much higher from 70 %
up to 90 % . The distance between results obtained
in point 1 and 2 loaded on the overlap within groups
of three or four sensor which included 1-2 pair. In
such sensor sets the overlap was infrequent, namely
10 to 20 % of the monitoring period. In case the set
1 2 3 4 5 6 7 8 9 10
1
2
3
4
5
6
7
8
9
seat in the row
row
0
0.1
0.2
0.3
0.4
0.5
0.6
0.7
0.8
0.9
1
Figure 9: Frequency of student seats occupation. Darkest
blue squares indicate location of sensors.
of sensors did not include 1-2 pair the identity of the
recorded values was observed during 60 to 70 % of
the measurement time. As shown in Table 4, the size
of common part of I intervals behaved in the same
way as the frequency of overlap occurrence. Namely,
the expected regularity was biased due to the dissimi-
larity of data collected in points 1 and 2. For a particu-
lar combination of measurement points the of L index
for CO
2
was higher than for temperature and lower as
compared with RH.
In Fig. 7 we see that CO
2
concentrations recorded
in point 2 were high, compared with other locations.
This regularity was observed during entire IAQ mon-
itoring study. High concentrations of CO
2
in point 2
could be attributed to the accumulation of this species
in low-lying parts of the room. The molecular mass of
this substance is larger compared with air. As shown
in Fig. 9 Students, who are the major source of CO
2
in this room rarely took seats in the first rows, i.e. in
the vicinity of sensor 2. As a rule, last rows were the
Table 4: L index for CO
2
concentration. Average for the
cases when there existed a common part of I intervals.
Set of measuring points Common part [%]
1-2-3-4 18.29 ± 11.45
1-2-3 25.13 ± 12.40
1-2-4 18.25 ± 10.36
1-3-4 44.74 ± 8.46
2-3-4 33.48 ± 7.13
1-2 27.75 ± 13.97
1-3 53.61 ± 8.82
1-4 52.75 ± 9.21
2-3 49.41 ± 11.43
2-4 42.88 ± 11.73
3-4 62.77 ± 7.60
The Problem of Measurement Accuracy in Sensor Networks for IAQ Monitoring
155

heavily occupied part of the room. For this reason
concentrations recorded in points 3 and 4 were most
frequently high and could be considered identical (90
%, see Fig. 8). Interestingly, results of lecturers seat
monitoring (point 1) frequently overlapped with the
concentrations up in the audience (80 % of time, see
Fig. 8).
From the above presented analysis we see that the
distinctive, important locations for CO
2
monitoring
were associated with low-lying parts of the room and
heavily occupied sections. There, the species should
be controlled. In case of the examined lecture hall, the
sufficient information about CO
2
concentration could
be acquired using two measurement points namely,
point 2 (low-lying part of the room) and point 4 or 3
(heavily occupied zone). Setting more points resulted
in redundant information if measurements were per-
formed with the accuracy of 50 ppm + 3 % m.v.
CO
2
sensors are several times more expensive
compared with temperature and RH sensors. They
require relatively frequent calibration and consume
much more energy. If measurements session lasts
longer than several days CO
2
measurement devices
shall be connected to power supply in order to assure
the continuity of readouts. These constraints have to
be taken under consideration while setting CO
2
moni-
toring network. However, based on our analysis small
number of CO
2
measurement points may not impair
the quality of information about this species. Con-
trarily, in view of the offered measurement accuracies
such sensor nets may be recommended.
5 CONCLUSIONS
Temporal and spatial variability of IAQ causes that it
should be determined by multi-point sensor networks
which operate continuously.
Many factors affect the quality of information
which is acquired in this way. These are, for exam-
ple the number of sensors, their localization and the
characteristics of measurement devices. In practical
applications, the optimization of these factors is very
important.
In our opinion it is necessary that the accuracy of
measurement devices is taken under consideration in
the selection of the number and distribution of sen-
sors.
This parameter may be different in various com-
mercially offered temperature, RH and CO
2
sensors.
In this work, we have shown that also the relation of
accuracy to spatial and temporal variation may be dif-
ferent among quantities measured in indoor air. For
this reason, the sensor net should be designed indi-
vidually for each parameter.
Based on our study, the measurement accuracy al-
lows to apply small number of sensors in RH and CO
2
measurements, while in case of temperature, their
number should be grater. However, in our opinion
the determination of the number of sensors and their
distribution shall be based on the screening study and
the analysis, which needs to be performed individu-
ally for a particular object of interest. This opinion
finds the justification in a strong influence of HVAC
system, occupancy and building characteristics on the
parameters describing IAQ.
ACKNOWLEDGEMENTS
This work was financially supported by the National
Science Center, Poland, under the contract number
DEC-2012/07/B/ST8/03031.
REFERENCES
Fanger, P.O. (2006). What is IAQ? Indoor Air. 16, 328-334.
Sundell, J. (2004). On the history of indoor air quality and
health. Indoor Air. 14, 51-58.
Sarbu, I. and Pacurar, C. (2015). Experimental and nu-
merical research to assess indoor environment qual-
ity and schoolwork performance in university class-
rooms. Building and Environment. 93, 141-154.
Persily, A. (2015). Challenges in developing ventilation and
indoor air quality standards: The story of ASHRAE
Standard 62. Building and Environment. 91, 61-69.
Hughes, I.G. and Hase, T.P.A. (2010). Measurements and
their uncertainties. A practical guide to modern error
analysis. Oxford University Press. New York.
Kim, M., Braatz, R.D., Kim, J.T. and Yoo, Ch. (2015).
Indoor air quality control for improving passenger
health in subway platforms using an outdoor air qual-
ity dependent ventilation. Building and Environment.
92, 407-417.
Varas-Muriel, M.J., Fort, R., Martnez-Garrido, M.I.,
Zornoza-Indart, A. and Lpez-Arce, P. (2014). Fluc-
tuations in the indoor environment in Spanish ru-
ral churches and their effects on heritage conserva-
tion: Hygro-thermal and CO
2
conditions monitoring.
Building and Environment. 82, 97-109.
Hesaraki A. and Holmberg S. (2015). Demand-controlled
ventilation in new residential buildings: Conse-
quences on indoor air quality and energy savings. In-
door and Built Environment. 24(2), 162-173.
Liu, X. and Zhai, Z.(J.). (2009). Protecting a whole building
from critical indoor contamination with optimal sen-
sor network design and source identification methods.
Building and Environment. 44, 2276-2283.
Shan, K., Sun, Y., Wang, S. and Yan, Ch. (2012). Develop-
ment and In-situ validation of a multi-zone demand-
SENSORNETS 2016 - 5th International Conference on Sensor Networks
156

controlled ventilation strategy using a limited number
of sensors. Building and Environment. 57, 28-37.
Jelicic, V. , Magno, M., Brunelli, D., Paci, G., and Benini,
L. (2013) Context-Adaptive Multimodal Wireless
Sensor Network for Energy-Efficient Gas Monitoring.
IEE Sensors Journal. 13(1), 328-338.
Kumar, A., Singh, I.P. and Sud, S.K. (2011). Energy Effi-
cient and Low-Cost Indoor Environment Monitoring
System Based on the IEEE 1451 Standard. IEE Sen-
sors Journal. 11(10), 2598-2610.
Peng, I.-H., Chu, Y.-Y., Kong, C.-Y. and Su., Y.-S. (2013).
Implementation of Indoor VOC Air Pollution Mon-
itoring System with Sensor. Seventh International
Conference on Complex, Intelligent, and Software In-
tensive Systems Network.
International vocabulary of metrology Basic and gen-
eral concepts and associated terms (VIM), JCGM
200:2008.
The Problem of Measurement Accuracy in Sensor Networks for IAQ Monitoring
157
