
An Analysis on Commuting Travel Time Reliability: A Case study in
Bei
j
in
g
Lixia Lei
2
and Qi Zhang
School of Traffic and Transportation, Beijing Jiaotong University, Beijing 100044;
2
State Key Laboratory of Rail Traffic Control and Safety, Beijing Jiaotong University, Beijing 100044, China
Keywords: Urban traffic, travel time, reliability evaluation index, AFC data, commute.
Abstract: Based on the AFC data of Beijing metro, this paper analyzes the travel time distribution and reliability of
subway commuter travel. This paper first analyzes the OD commuter travel time distribution by combing a
large amount of actual data. The results indicate that the OD commuter travel time distribution follows the
Lognormal distribution. Then the paper analyzes the applicability of travel time reliability evaluation index,
which shows that the Buffer time index is suitable for evaluating the reliability of subway OD travel time.
1 INTRODUCTION
With the rapid development of China's subway
industry, People's travel requirements include not
only comfort, convenience, economy and security,
but also increase the accuracy of travel time,
especially commuters. They are more demanding on
travel time reliability.
In previous works, the research on the reliability
of the travel time mainly focuses on the urban road
network, and there are relatively few studies on the
reliability of the OD between the metro stations.
Commonly, the evaluation indexes of the reliability
of the travel time of the road network include the
reserved time index, the planned time index and the
95% time. At present, there is a lack of evaluation
index suitable for evaluating the reliability of travel
time of subway OD.
Therefore, this research takes Beijing metro OD
as the research object and Combine AFC data to
study the distribution rule of OD travel time. Based
on the reliability evaluation index of road network
travel time, through the index applicability analysis,
Select the appropriate indicators for evaluating the
reliability of subway commute travel time.
2 OVERVIEW OF COMMUTER
TRAVEL TIME RELIABILITY
2.1 Definition
Subway travel time means the time passenger spend
on the process from credit card into the station into
credit card off the station. Travel time components
includes the pit stop walking time, platform waiting
time, in the car time, outbound travel time form. If
need to transfer, plus travel time, transfer station
waiting time, etc.. Commuter passengers before the
trip have the psychological expectations of the time
required, and set aside a certain period of time. The
time reserved by passengers is called planned travel
time.
Travel time reliability is the probability that a
traveler will be able to travel successfully during a
scheduled travel time and may also indicate the
percentage of passengers who have successfully
completed their travel during the planned travel
time.
2.2 Probability distribution model of
commuting travel time
OD commuter travel time probability density
distribution in the form shown below, it can be
divided into three stages, the first stage a ~ b travel
time increases, the corresponding probability
increases gradually until the probability of b
maximum. In the second stage, the probability of b ~
Lei, L. and Zhang, Q.
An Analysis on Commuting Travel Time Reliability: A Case study in Beijing.
In 3rd International Conference on Electromechanical Control Technology and Transportation (ICECTT 2018), pages 375-378
ISBN: 978-989-758-312-4
Copyright © 2018 by SCITEPRESS – Science and Technology Publications, Lda. All rights reserved
375
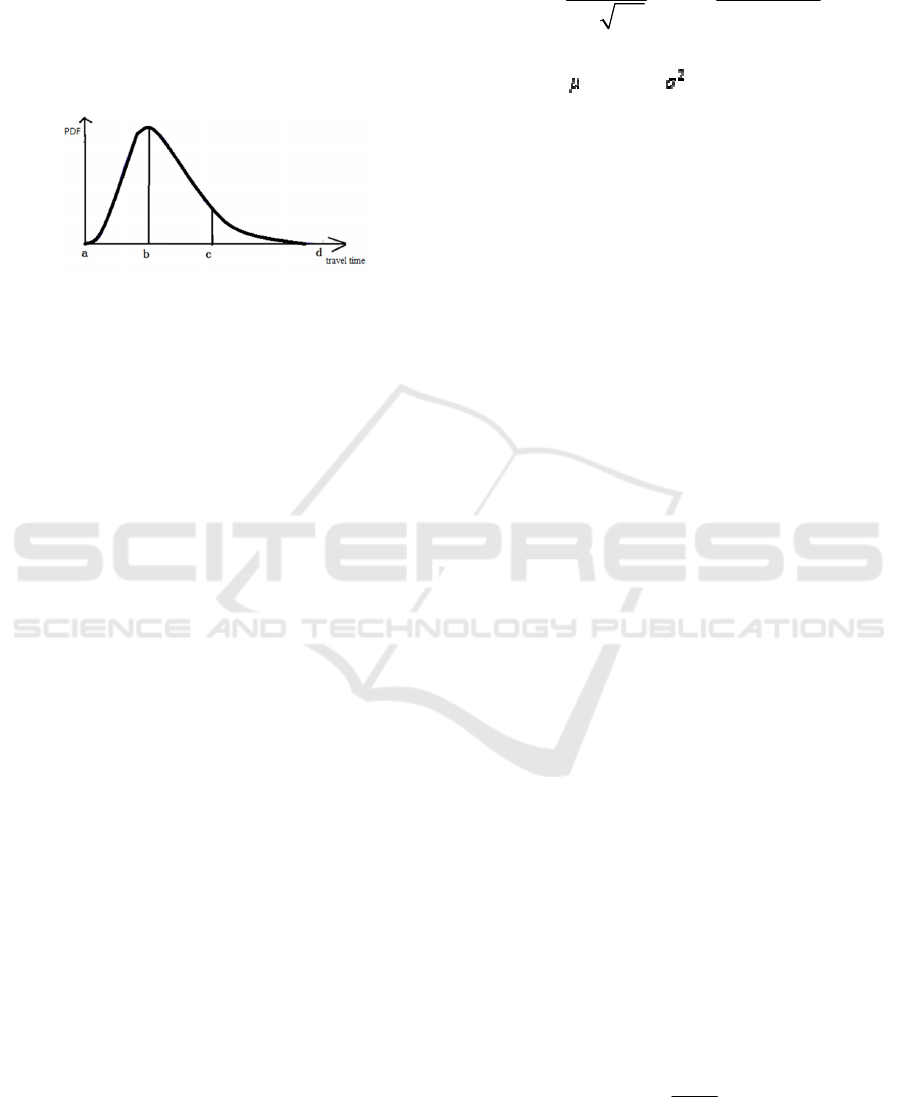
c gradually decreases, which is symmetrical with
that of the first stage about x = b. The third phase c ~
d probability is at a relatively low value and is still
decreasing. According to the characteristics of
probability density distribution of OD travel time,
we assume that its distribution obeys normal
distribution and logarithmic normal distribution, and
performs curve fitting and test.
Fig. 1. OD travel time actual probability density
distribution
The data source in the study is the AFC data of
full network include the morning rush hour from
March 16 to March 20, 2015. The AFC system
provides detailed passenger travel information,
extracts each passenger's arrival and departure
stations and the time of inbound and outbound credit
card.
According to the probability density function of
normal distribution and lognormal distribution
model and distribution model hypothesis testing
method, the fitting procedure of commuting travel
time distribution model is as follows:
Step1: Take a single OD pair of commuting time
as a general, data preprocessing. Draw a histogram
of commuting travel time distribution, and conduct a
preliminary analysis of the probability distribution
characteristics of OD travel time.
Step2: Using the cftool fitting toolbox in
MATLAB, we can obtain the probability density
function image and parameter μ, σ of OD commute
travel time after the commuting travel time of the
OD pair is respectively normalized and logarithm
normal distribution curve fitting.
Step3: Use the goodness of fit parameters SSE
and R2 and other statistical indicators and P-P map,
travel time empirical distribution function chart and
the probability distribution chart to compare the
differences to test the rationality of the distribution
model assumptions.
Through a large number of ODs, the actual data
of commuter travel time verifies that 98% of OD
commuting trips are logarithmically normal.
Therefore, it can be assumed that the probability
distribution model of OD commuting travel time is
lognormal distribution. which is:
2
ln ( , )TN
μ
σ
(1)
2
2
1()
() exp
2
2
InT
fT
T
μ
σ
σπ
⎛⎞
−
=−
⎜⎟
⎝⎠
(2)
(T)Represents OD Excursion Travel Time,
where
and represent the expected
value and variance of the logarithm of travel time
respectively.
3 COMMUTER TRAVEL TIME
RELIABILITY EVALUATION
INDEX SYSTEM
Travel time reliability evaluation indicators can be
divided into mathematical statistics based on
indicators, and based on probability travel time class
indicators. The evaluation index based on
mathematical statistics mainly describes the degree
of variation of travel time and the degree of
dispersion of distribution. Based on the historical
travel time data, the evaluation index based on the
probabilistic travel time class describes the
uncertainty of travel time and is relatively close to
the actual feelings of passengers.
3.1 Travel time reliability evaluation
index
The evaluation indexes based on mathematical
statistics include the mean value, standard deviation,
variance and the like. The evaluation indexes based
on probabilistic travel time class include planned
travel time (PT), planned travel time index (PTI),
buffer time (BT), and buffer time index (BTI).
Planned travel time (PT) indicates the estimated
travel time for the passenger when traveling.
General 95% travel time said. Reflects the vast
majority of passenger travel time required. The
planned travel time index (PTI) is a measure of the
ratio of planned travel time to median to assess the
planned travel time for different OD pairs. The
larger PTI is, the lower the reliability of travel time
is. Where:
95TT
Represents 95% of travel time;
50TT
Represents the median travel time.
95PT TT=
(3)
95
50
TT
PTI
TT
=
(4)
The buffer time (BT) indicates the amount of
time a passenger must reserve in order to travel on
ICECTT 2018 - 3rd International Conference on Electromechanical Control Technology and Transportation
376

time. The buffer time exponent (BTI) expresses the
ratio of buffer time to median as a percentage to
evaluate the buffer time for different OD pairs. The
greater BT and BTI are, the lower the reliability of
travel time is.
95 50BT TT TT=−
(5)
95 50
50
TT TT
BTI
TT
−
=
(6)
In Section 2.2, it has proved that OD commuting
travel time obeys lognormal distribution, so all the
reliability evaluation indicators of travel time are
based on lognormal distribution. The following is a
derivation based on the logarithmic normal
distribution of travel time reliability formula:
2
exp( 0.5 )Mean
μ
σ
=+
(7)
PT exp(μ 1.645σ)=+
(8)
PTI exp(1.645σ)=
(9)
[
]
BT exp( ) exp(1.645 ) 1
μσ
=−
(10)
BTI exp(1.645σ)-1=
(11)
3.2 Commuter Travel Time Reliability
Evaluation Index Applicability
Analysis
(1) Evaluation of reliability of each travel time in
different periods of evaluation results
In the process of selecting the appropriate
evaluation index of the reliability of the travel time
of the subway, although the indexes have different
measurement scales, the reliability of the travel time
should be consistent. The figure below shows the
travel time of one OD in each day of the day Travel
time reliability evaluation bar chart As can be seen
from the figure, the trend of all the reliability
indexes are basically the same, only some indexes
magnify the reliability of time periods with less
reliable reliability and reduce the reliability
measures with better reliability periods so that the
reliability of different time periods The level of
reliability is more obvious.
Fig. 2. reliability evaluation index of different travel time
in a certain day of OD
Obviously, the average travel time of the same
OD changed more smoothly and the variance
changed a lot. The planned travel times and indices
have also been changing steadily during the day. The
buffer time and index can be very intuitive to reflect
the reliability of travel time changes over different
periods of time.
(2) Comparison of reliability evaluation index of
different travel time for different OD evaluation
The purpose of this chapter is to select all of the
reliability evaluation indicators that can objectively
evaluate the reliability of different OD travel time.
Randomly select a number of OD, according to the
average travel time from small to large sorting OD
traffic weekday travel time data obtained from the
calculation of the reliability of travel time bar chart.
As can be seen from the figure, when the mean and
planned travel time are used to evaluate the
reliability of multiple OD commuter travel times, it
is impossible to directly compare the reliability
levels and is used to describe the reliability of OD
travel time alone. The standard deviation, the
planned travel time index, the buffer time and the
buffer time index can all be used to compare the
reliability of OD travel time, but the effect is
obviously different. Among them, the planned travel
time index fluctuated less, and the evaluation result
was slightly worse. Therefore, choosing the buffer
time and buffer time index as the evaluation index of
commuting time reliability can directly compare the
reliability of different OD commuter travel time.
Considering the influence of avoiding the mean
value of travel time on the reliability evaluation, this
paper chooses the buffer time index as the
An Analysis on Commuting Travel Time Reliability: A Case study in Beijing
377

evaluation index of commuting time reliability
finally.
Fig. 3. reliability evaluation index of different OD
commuter travel time and travel time
4 CONCLUSIONS
In this paper, According to the index applicability
analysis, we select the indexes that are suitable for
the evaluation of the subway commuter travel time
reliability and finally choose the BTI as the
evaluation index of the subway commuter travel
time reliability.
REFERENCES
WANG Dianhai,QI Hongsheng,XU Cheng. Summary of
traffic reliability research [J]. Transportation Systems
Engineering and Information, 2010,10(05):12-21.
ZHANG Hanliang. Study on the distribution model of
urban rail traffic flow based on travel time
distribution[D]. beijing: Beijing Jiaotong
University,2016.
LI Chao. Analysis and prediction of urban road traffic
travel time based on statistical model[D]. beijing:
Northern Polytechnic University,2015.
ZHOU Jianwei. Study on the time reliability of highway
route[D]guangdong: South China University of
Technology,2015.
SUN Xiaofei, Chen Xumei, liu Wenfeng,et al. The
reliability evaluation system of highway travel time
and the index threshold calibration [J]. Traffic
Information and Security, 2014,32(01):58-63.
ICECTT 2018 - 3rd International Conference on Electromechanical Control Technology and Transportation
378
