
Fundamental Diagram of Bicycle Traffic Based on Logistic Model
Cheng Xu
1, 2
, Xin Wang
3
and Xiaonan Yu
1
1
Department of Traffic Management Engineering, Zhejiang Police College, Hangzhou 310053 China
2
College of Civil Engineering and Architecture, Zhejiang University, Hangzhou 310058 China
3
Department of International School, Zhejiang Police College, Hangzhou 310053 China
xucheng@zjjcxy.cn, wangxin@zjjcxy.cn, yxnpolice1474@outlook.com
Keywords: Fundamental diagram, Bicycle traffic, Electric bicycle, Logistic model.
Abstract: Bicycle has become one of the important commuting travel ways to residents who are living in developing
countries including China. Therefore, it’s of great theoretical interest and industrial significance to study on
the fundamental diagram of bicycle traffic flow. According to the operating characteristic, this paper proposes
adopting logistic model to modeling the fundamental bicycle traffic flow and the method of model parameters
calibration based on the maximum likelihood algorithm. This model was verified by the measured data from
three sections of Hangzhou city and estimated the capacity was 2243 bikes/h/m. The fitting precision of this
model was significantly improved compared to the traditional model. Based on the study mentioned above, it
will provide data supporting to the application of fundamental diagram in the bicycle traffic flow field.
1 INTRODUCTION
Fundamental diagram (FD) is the relationship
between density and volume of traffic, and is the
important foundation for traffic state identification,
capacity estimation, and determination the phase
regime of traffic flow. FD is also an important feature
which distinguishes traffic flow from other fluids.
Therefore, FD is of significance for both motorized
vehicle traffic flow and non-motorized traffic flow.
Greenshields firstly presented a linear speed-density
relationship and parabolic density-volume
relationship using the measured field data (B. D.
Greenshields, 1935). After around 80 years’
development of FDs, there are numerous studies of
FDs. The famous FD models includes Greenberg
model (H. Greenberg, 1959), Underwood model (R.
T. Underwood, 1961), Newell model (G. F. Newell,
1961), Pipes model (L. A. Pipes, 1976), and Qu
models (X. Qu, S. Wang, J. Zhang, 2015; X. Qu, J.
Zhang, 2017).
Most of the FD models are single-regime models
which could fit the empirical data samples well for
motorized vehicle traffic flow. However, most of the
FD models were presented for motorized vehicle
traffic flow. There was almost no FD model proposed
for non-motorized vehicles. In recent years, bicycle
traffic (including electric bicycles) has been become
one of the main trip modes in developing countries,
especially in Southeast Asian countries such as
China, Vietnam, and Indian. The electric bicycle
(E-bike) has quickly become one of the main
non-motorized travel modes in China (S. Jin, 2015;
C. Xu, 2016; S. Jin, 2015; M. Zhou, 2017). With the
rapid increase of bicycles, it is very important to
study the traffic flow characteristics of bicycles.
Traditional motorized vehicle-oriented FD models
cannot adapt to the operating characteristics of
bicycle traffic flow. Therefore, the purpose of this
paper is to use logistic model for modeling the FD of
bicycle traffic flow, and proposed a FD model for
estimating the capacity of bicycle flow.
2 MODEL
2.1 Logistic Model of Bicycle
Fundamental Diagram
Logistic curve is a model with many equations and
wildly used in population ecology field. Wang et al.
(H. Wang, J. Li, Q. Chen, 2011) presented a model
that describes traffic flow speed-density relation.
Compared the imitative effect on logistic models of
three or four parameters and five parameters, he used
Xu, C., Wang, X. and Yu, X.
Fundamental Diagram of Bicycle Traffic Based on Logistic Model.
In 3rd Inter national Conference on Electromechanical Control Technology and Transportation (ICECTT 2018), pages 187-190
ISBN: 978-989-758-312-4
Copyright © 2018 by SCITEPRESS – Science and Technology Publications, Lda. All rights reserved
187

five parameters to model the motor vehicle flow.
Concrete equation as follows:
2
1
()
1exp
fb
b
t
vv
vk v
kk
(1)
where, v is the speed of bicycle flow, k is the density
of bicycle flow, v
f
is the free flow speed, v
b
is the
speed when traffic is on the condition of stop and go,
k
t
is the density from free flow to congested flow, θ
1
is the parameter which determining the slope of the
logistic curve, and θ
2
is the parameter which
determining the symmetry of the logistic curve.
Based on the basic relationship of volume
-speed-density model,
qkv
. (2)
The relationship of density-volume is presented
as follow:
2
1
1exp
fb
b
t
vv
qkv
kk
(3)
where, q is the volume of bicycle flow.
Considering the effect of E-bikes on bicycle flow,
the volume of E-bikes should be converted to bicycle
volume using the bicycle equivalent unit for the
E-bike,
beb
qq q
(4)
where, q
b
is the volume of bicycles, q
eb
is the
volume of E-bikes, and β is the bicycle equivalent
unit for the E-bike which can be set as 0.66 (S. Jin,
2015).
Based on this model, we can establish the
fundamental diagram of traffic flow under the
operation of hybrid bicycle. Applying this model can
fit the operation characteristic of bicycle better.
2.2 Parameter Calibration
For Equation (4), the formula is nonlinear, and the
traditional method of least squares cannot be used in
parameter calibration directly. Therefore, a nonlinear
least squares fitting method is proposed for
calibrating the model parameters. For equation
q=f(k), given f() and observation vector q, the main
steps of the LM algorithm are as follows:
Step 1: Set initial value k
0
and stop control
constant ε, and calculate
00
()qfk
.
Step 2: Calculate the Jacobi Matrix J
k
, and
T
iiii
NJJ I
, then establish the equation
T
ii i i
N
J
.
Step 3: Solve the above equation for
i
.
(1) If
()
ii i
qfk
, then
1iii
kk
,
else if
i
, stop iteration, output; else
1
/
ii
, return to Step 2.
(2) If
()
ii i
qfk
, then
1ii
,
solve the function again and get
i
, return to Step 1.
Using these three steps, we can complete the
calibration and obtain the parameters that minimize
the model error.
3 RESULTS
3.1 Date Collection
Field data collection is of significance for FD model
estimation and calibration. In this paper, three bicycle
path sections in Hangzhou, China, were selected for
data collection. Every bicycle path was one-way, and
located in the middle of road links, far away from
intersections, which will minimize the effects of
traffic signals and pedestrians on bicycle traffic.
Camera was set up on the side of the bicycle path to
take videos. The filed data was conducted on
weekdays during peak and non-peak hours. Using
video-processing technology, the volume and speed
can be easily recorded automatically.
Table 1 provides the width of bicycle path,
percentage of E-bike and percentage of male cyclist
from these three surveyed sections. Traffic flow data
from these three sections will use to fit and capacity
estimate on fundamental diagram of bicycle traffic
flow as below.
Table 1: Description of field survey data
Section
name
Width of
bicycle path
Percentage
of E-bike
Percentage of
male cyclist
Jiaogong
Road
2.4 m 65.5% 62.7%
Hushu
Road
3.0m 57.9% 67.3%
Wener
Road
3.5 m 59.8% 66.3%
Overall - 61.0% 65.5%
3.2 Results of Estimation
In order to analyze the advantage of logistic model
further, this paper will analyze it by comparing to
Greenshields model, Greenberg model and
ICECTT 2018 - 3rd International Conference on Electromechanical Control Technology and Transportation
188
Underwood model individual. The above three model
equations as follow:
(1 )
f
j
qkv kk
(5)
log
mj
qkv kk
(6)
exp( )
f
m
qkv kk
(7)
Calibrating the above four models’ parameter by
applying the maximum likelihood algorithm and
draw the relationship diagram between model
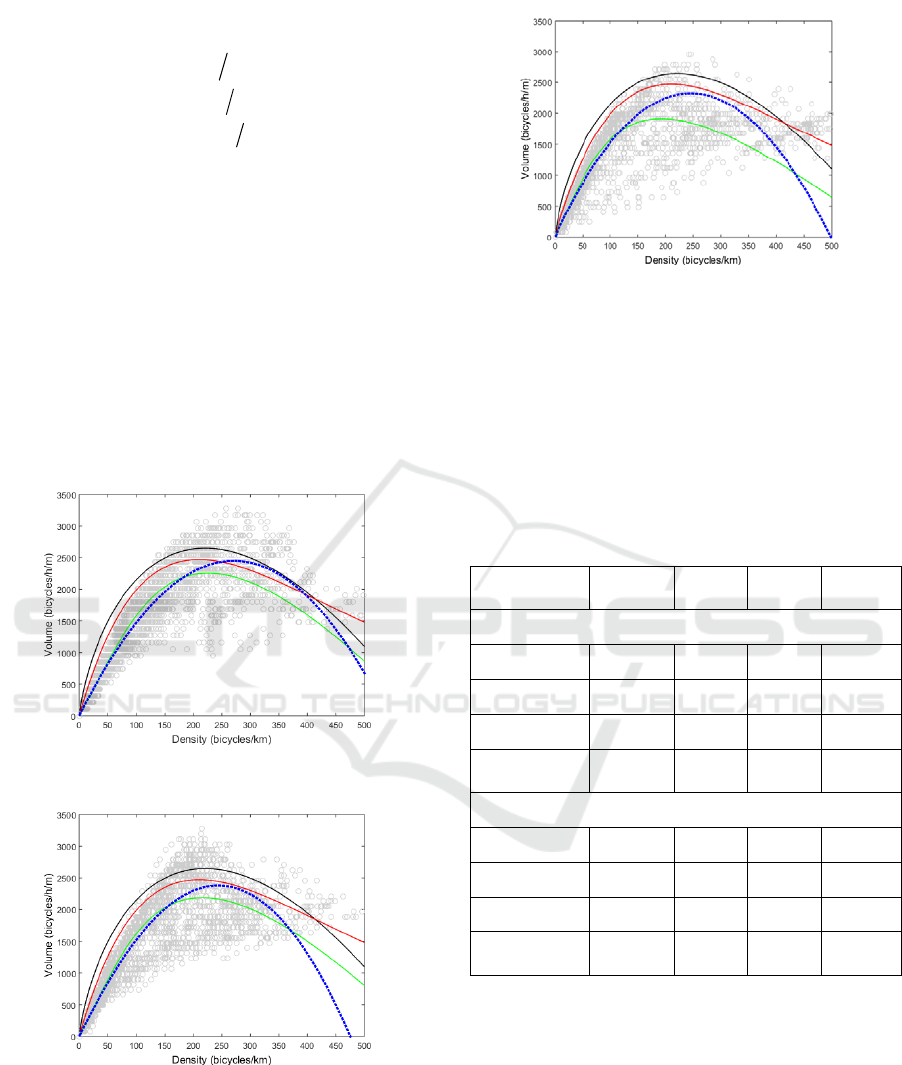
estimation and field observed data. Table1-3 presents
the fundamental diagram which was drawn by field
observed data from three sections and the curve
which is fitting by the four models. The gray circles
are field observed data. The black, red and green
solid lines represent the Greenshields model,
Greenberg model and Underwood model
respectively. The blue dotted line represents the
outcomes of logistic model fitting. The logistic model
has higher fitting precision to these three different
widths of paths from the tables.
Figure 1: FD models of bicycle traffic on Jiaogong Road
Figure 2: FD models of bicycle traffic on Hushu Road
Figure 3: FD models of bicycle traffic on Wener Road
In order to analyze the fitting precision of model
further, Table 2 gives fitting errors and estimated
bicycle capacity of different models. Paper presents
the average error of logistic model which gets higher
fitting precision than others is around 15%.
Meanwhile, the average estimated capacity of these
three sections is about 2243 bikes/h/m, which is more
correspond to actual fact.
Table 2: Results of density-volume relationships
Models
Jiaogong
Road
Hushu
Road
Wener
Road
Average
Capacity
Greenshields 2340 2476 2432 2412
Greenberg 2530 2432 2412 2473
Underwood 2101 2098 2023 2062
Logistic
model
2312 2322 2203 2243
Fitting error
Greenshields 19.41% 17.62% 18.34% 18.33%
Greenberg 34.12% 31.32% 28.23% 30.21%
Underwood 19.32% 17.23% 19.12% 18.54%
Logistic
model
15.32% 14.43% 16.12% 15.12%
4 CONCLUSIONS
The study on the fundamental diagram of traffic flow
focus on the vehicle flow, and few of research
addressed the non-motor vehicle. From the
perspective of establishing the fundamental diagram
of non-motor vehicle traffic flow which was base on
logistic model, this paper verified the feasibility of
fundamental diagram which was applied to the
Fundamental Diagram of Bicycle Traffic Based on Logistic Model
189

non-motor vehicle traffic flow. Following
conclusions were obtained in this paper:
(1) The speed-density relation model of bicycle
traffic flow corresponds to the fundamental diagram,
but the data points are more discrete compared to the
vehicle data.
(2) The outcome of fitting error based on the
logistic model is significantly rising compared to the
classic model.
(3) The capacity and block density of bicycle path
which were calibrated based on the logistic model
correspond more to actual fact.
ACKNOWLEDGEMENT
This work was partly supported by the Zhejiang
Provincial Natural Science Foundation (No.
LQ17E080001), the China Postdoctoral Science
Foundation, and the Key Research and Development
Program of Zhejiang (No. 2018C01007).
REFERENCES
B. D. Greenshields, 1935. A study in highway capacity.
Highway Research Board Proceedings, 14, 448-477.
H. Greenberg, 1959. An analysis of traffic flow. Operation
Research, 7, 79-85.
R. T. Underwood, 1961. Speed, volume, and density
relationship: quality and theory of traffic flow. Yale
Bureau of Highway Traffic, 141-188.
G. F. Newell, 1961. Nonlinear effects in the dynamics of
car following. Operation Research , 9(2), 209-229.
L. A. Pipes, 1976. Car following models and the
fundamental diagram of road traffic. Transportation
Research, 1(1), 21-29.
X. Qu, S. Wang, J. Zhang, 2015. On the fundamental
diagram for freeway traffic: A novel calibration
approach for single-regime models. Transportation
Research Part B , 73, 91-102.
X. Qu, J. Zhang, S. Wang, 2017. On the Stochastic
Fundamental Diagram for Freeway Traffic: Model
Development, Analytical Properties, Validation, and
Extensive Applications. Transportation Research Part
B, 104, 256-271.
S. Jin, X. Qu, D. Zhou, C. Xu, D. Ma, D. Wang, 2015.
Estimating cycleway capacity and bicycle equivalent
unit for electric bicycles. Transportation Research Part
A, 77, 225-248.
C. Xu, Y. Yang, S. Jin, Z. Qu, L, 2016. Hou. Potential risk
and its influencing factors for separated bicycle paths.
Accident Analysis and Prevention, 87, 59–67.
S. Jin, X. Qu, C. Xu, D. Ma, D. Wang, 2015. An improved
multi-value cellular automata model for heterogeneous
bicycle traffic flow. Physics Letters A, 379,
2409–2416.
M. Zhou, X. Qu, S. Jin, 2017. On the Impact of Cooperative
Autonomous Vehicles in Improving Freeway Merging:
A Modified Intelligent Driver Model-Based Approach.
IEEE Transactions on Intelligent Transportation
Systems, 18(6), 1422-1428.
H. Wang, J. Li, Q. Chen, et al, 2011. Logistic modelling of
the equilibrium speed-density relationship.
Transportation Research Part A, 45(6), 554-566.
ICECTT 2018 - 3rd International Conference on Electromechanical Control Technology and Transportation
190
