
Modelling Urban Logistics Business Ecosystems
An Agent-based Model Proposal
Giovanni Zenezini and Alberto De Marco
Department of Management and Production Engineering, Politecnico di Torino, Corso Duca degli Abruzzi 24, Torino, Italy
Keywords: Urban Logistics, Innovation, Business Ecosystems, Agent-based Modelling, Simulation.
Abstract: Urban Logistics (UL) faces several issues arising from e-commerce and population growth, and it is
undergoing a series of technological and systemic innovations. However, most of these innovations fails to
scale up, and high is the need to grasp the overall operational and economic aspects that drive UL
stakeholders to accept such innovations. To this end, proper modelling and assessment methodologies need
to take into account these aspects and the heterogeneity of objectives and decision-making of stakeholders.
This paper aims at filling this gap by proposing an agent-based model based on an existing theoretical
framework depicting UL systems from a business model perspective. A computational experiment is
presented to retrieve more insights into the topic.
1 INTRODUCTION
Urban Logistics (UL) is facing several issues that
arise from e-commerce and population growth. In
particular, logistics service providers (LSP) are
faced with the challenge to increase the speed of
delivery (Savelsbergh and Van Woensel, 2016),
which has become a major value proposition (VP)
for e-commerce customers et al., 2016). At the same
time however, UL is dealing with technological
innovation that might enhance the optimization
capabilities by LSPs (Mena and Bourlakis, 2016).
From a systemic perspective, the traditional hub-
and-spoke delivery network is being reshaped and
improved by existing and new players. For instance,
automated parcel locker stations consolidate parcels
at the delivery point, reducing the uncertainty of the
home delivery process (Morganti, Dablanc and
Fortin, 2014). Despite their relatively large
diffusion, UL initiatives often fail to take up after a
first pilot implementation, or lag at a low scale for
years after their introduction (Zenezini and De
Marco, 2016). Reasons for failure ranges from a lack
of profitability, too many stakeholders involved or
too complex schemes to be introduced (Rooijen,
Guikink and Quak, 2017). If initiatives are
implemented without a proper assessment of their
commercial attractiveness then private operators
may not be willing to invest their resources
(Cagliano et al., 2016).
This paper aims to contribute to the research area
of UL project evaluation by providing an agent-
based model (ABM) oriented at the business model
of UL stakeholders, taking into consideration both
business and operational aspects. The ABM
proposed here is a follow-up work to the theoretical
framework by Zenezini et al. (2017), which depicts
UL systems as business ecosystems where
companies can play different roles. In this paper, we
present the development of the model and a
computational experiment on a parcel locker
installation case study.
The paper is structured as follows. After a litera-
ture review section, the model development phases
are outlined inn section 3. Then, the computational
experiment is presented. Simulation results from this
experiment are shown in section 5, and discussions
and conclusions are drawn in section 6.
2 LITERATURE REVIEW
Scholars of Urban Logistics have only recently
turned to ABM to model and simulate various
aspects of the topic. The main goal of the majority of
ABM papers in UL literature is to depict the
interaction among agents through flows of money
and goods, and then to evaluate the introduction of
policy measures in terms of economic and
environmental impacts. In one of the first
128
Zenezini, G. and Marco, A.
Modelling Urban Logistics Business Ecosystems - An Agent-based Model Proposal.
DOI: 10.5220/0006865301280135
In Proceedings of 8th International Conference on Simulation and Modeling Methodologies, Technologies and Applications (SIMULTECH 2018), pages 128-135
ISBN: 978-989-758-323-0
Copyright © 2018 by SCITEPRESS – Science and Technology Publications, Lda. All rights reserved

conceptualizations of ABM in UL contexts,
Taniguchi and Tamagawa (2005) simulate traffic
flows, and include for the first time stakeholders’
behaviours and objectives in the evaluation. In a
similar effort, a combined approach agent-based
with vehicle routing problem is proposed by Teo,
Taniguchi and Qureshi (2014). Adaptive agents
learning from previous experiences are modelled in
Tamagawa, Taniguchi and Yamada (2010) using a
Q-learning algorithm to compute the value function
of an agent, namely the profit, including the
expected values of the agent’s future states and
behaviours, and a learning rate through which agents
adapt their behaviour. However, the calibration of
parameters in this previous work is not proposed.
The decisions of agents in the previous models are
mostly driven by costs and only basic transportation
services are exchanged among them. van Heeswijk,
Mes and Schutten (2016) integrate operational
decisions with strategic ones, such as cooperation
and collaboration among agents.
Only Roorda et al. (2010) introduce the concept
of business model within their conceptual
framework for modelling urban supply chains, to
identify business and operational decisions behind
the exchange of logistics services among entities.
In summary, extant literature focuses on evaluation
of the impact of policy measures on UL systems,
and fails short of addressing the business model of
UL agents as a comprehensive tool to identify
business and operational factors and assess the
exchange of services and the success of UL
initiatives. The objective of this work is to contribute
to existing literature by providing a business model
view of the UL system, similarly to Roorda et al.
(2010). Hence, UL agents are characterized by their
business model, in terms of a specific set of
resources, a limited set of decisions, and the
exchange of logistics services with other agents. To
this end, new agents that are nowadays striving in
UL systems and were not recognized previously
need to be introduced.
3 MODEL DEVELOPMENT
The model development of this UL system agent-
based model is based on the methodological steps
identified by van Dam, Nikolic and Lukszo (2013)
namely: i) problem statement, ii) concept
formalization, iii) model formalization and iv) model
verification. This paper attempts at operationalizing
the theoretical framework presented in Zenezini et
al. (2017) focusing on a specific case study in UL
systems. In particular, in problem statement we
outline the case study at issue by identifying agent
types and the agents’ environment. Then, concept
formalization focuses on providing a
conceptualization of two major elements that
compose a UL system under the lens of the business
model: the value proposition exchanged between a
provider and a set of potential users, and the metrics
used to evaluate that value proposition exchange.
Model formalization represents the model narrative,
meaning the activities performed by the agents, the
major events and the rules that triggers them.
Finally, this section explores the issue of model
verification.
3.1 Problem Statement
The model aims to simulate two different service
configurations related to the introduction of
automated parcel locker stations in office buildings.
For the first configuration, the locker operator only
installs parcel lockers, and builds the managing ICT
infrastructure. For the second one the locker
operator consolidates goods at the warehouse on top
of installing and managing the parcel lockers and
organizes the last-mile delivery. Hence, it is
assumed that in the second scenario the PLO would
require more resources and consequently offer a
higher price to the customer.
3.1.1 Problem Owner
UL promoters are faced with the issue of involving
other stakeholders without a complete knowledge of
the potential outcomes of such projects. Therefore,
the major problem owner of the proposed ABM is
the stakeholder, or group of stakeholders, that comes
up with an idea of an innovative UL solution and
intend to design it, plan it and implement it. New
business ventures in UL are shaping their business
model or striving to scale up. These private ventures
need to generate value for old and new customers of
logistics services.
3.1.2 Agents
Agents in this model belong to two types: provider
and user of logistics services. Entities that decide to
become providers aim at delivering a value
proposition including tangible and intangible
benefits that are valued by their potential customers
(Zenezini et al., 2017). Such value proposition is
assembled as a bundle of logistics services with
attributes such as price and service quality. In this
view of UL systems agents, perform activities, use
Modelling Urban Logistics Business Ecosystems - An Agent-based Model Proposal
129

resources and take business and operational
decisions.
Parcel Locker Operators: besides installing
parcel lockers, Parcel locker operators (PLOs) take
on some activities related to last-mile delivery
process such as cross-docking and fleet allocation.
Moreover, they have an interface with both the final
customers and the express couriers. The activity and
resources of PLOs are shown in Table 1.
Table 1: Activities and resources of PLOs.
Activities Resources
Parcel lockers
installation
Cross-docking
Parcel delivery
ICT support
Urban Distribution Centres
Logistics personnel
Marketing personnel
ICT Equipment
Light commercial vehicles
PLOs have a set of strategic and operative decisions
to take (Table 2).
Table 2: Business and operative decisions of City
Logistics providers.
Strategic Decisions Operative decisions
Value Proposition setting
Level of service provided
Pricing scheme
Budget allocation
Resource acquisition
Fleet allocation
Vehicle routing
Demand allocation
Facility Managers: Facility managers are
employees in charge of managing large complex
buildings such as office buildings, malls or large
condominiums. They need to cope with the
increasing number of parcels being delivered at the
desk reception. Therefore, some UL innovations
target these managers by offering them solution for
reducing the efforts spent doing this non-core
activity. Activities and resources of facility
managers are outlined in table 3.
Table 3: Activities and resources of Facility Managers
according to the role played.
Activities Resources
Inbound operations
Payment for delivery
Evaluation of level of service
Evaluation of intangible benefits
Storage
capacity
Inbound
Personnel
Facility managers have to take certain decisions,
mainly related to the adoption of the service offer,
the evaluation of the level of service and intangible
benefits obtained with the service. It is assumed here
that after adopting the service, there will be no
decisions taken on the operative level by facility
managers.
3.1.3 Environment
In the business-model oriented UL system, agents
change the way they evaluate a Value Proposition
based on the dynamics of the environment
surrounding them, meaning that the perception of a
UL innovation changes when more and more agents
start adopting it. Moreover, relationships between
agents are the result of interaction, and each agent
can encounter a set of other agents and deliver the
Value Proposition. In this context, the environment
decides which agents are actually part of the subset
of potential users. The availability of resources from
the UL business ecosystem environment determines
the capability of a company to perform. In
particular, new UL companies gain access to
external funding from investors, which are not
modelled explicitly. The modeller decides whether a
new business entity can have access to a specific
amount of monetary resources. The role of the
environment is also to include parameters defined by
the modeller to establish the cost of the interaction
among the agents and the success of such
interactions. In fact, the UL system implies the
generation, promotion and execution of logistics
services. Thus, each provider-user encounter as well
as each logistics contract signed has a cost. This cost
is borne by the provider.
3.2 Concept Formalization
3.2.1 Logistics Value Proposition
To quantify a value proposition, Töytäri and Rajala
(2015) propose to link the elements of such VP to
key performance indicators that the customer is
seeking after. The VP evaluation is then regarded
likewise a qualification step for the supplier
selection problem, where the supplier
performance/attributes have to rank above a
minimum threshold. Moreover, innovative
companies have to overcome the afore-mentioned
risk of committing to them by providing a
“premium” in terms of the desired service attributes.
If the components of value proposition yield higher
value than the target requirements then the user
decides how much demand to allocate.
The value proposition offered by PLOs is
composed of four components, or decision-making
criteria. The first criterion is the logistics cost for
SIMULTECH 2018 - 8th International Conference on Simulation and Modeling Methodologies, Technologies and Applications
130

receiving parcels. A second criterion is related to
intangible benefits, such as cost reduction,
availability and convenience, better, flexible and
customized service or plain innovativeness and
status from product superiority or design. The third
criterion is the environmental sustainability of the
delivery process. A fourth criterion is added to take
into account the risk related to adopt an innovative
solution ever tested before, which is related to the
credibility of the company the scope of the service.
The overall value proposition is an aggregated
function dependent on the four attributes of value
highlighted (Eq. 1).
VP
i
= f (Price
i
, Intangible
i
, Sustainability
i
,
Risk
i
)
(1)
3.2.2 Metrics
Metrics are assigned to the targets set by entities,
which refer to their objectives. Primarily, entities
need to achieve economic benefits from their
relationships with other entities. Providers for
instance need to make profit by selling their logistics
services to users. Then they aim at maximizing other
objectives, which are better represented by the
intangible benefits created and exchanged during the
execution of the roles. Metrics are relevant because
performance measurement can steer the decisions of
UL companies.
Table 4 highlights the evaluation metrics of the
model.
Table 4: Evaluation metrics.
Agent type Metrics
Provider Profit
Number of
customers
Receiver (Un)loading time
(Un)loading cost
3.3 Model Formalization
The model narrative focuses on the value
proposition exchange between provider and user.
As anticipated, entities first make strategic
decisions. Providers for instance need to design their
value proposition in terms of price and service
quality. Then, the first allocation of the budget in
Research and Development (R&D) and marketing
should take place. In the case presented, the provider
sets a specific number of customers (i.e. market
penetration) as a target, and thus calculates the size
and number of parcel lockers stations according to
this target. This decision nonetheless ensues from
both the target for market penetration and the budget
allocated to R&D in terms of capacity building.
Consequently, the size of the lockers station will
also determine an estimation of the total costs.
Entities that are potential users of this service
will receive the service offer. The spread of the
service proposal to potential customers is a function
of the marketing action set up by the service
provider. From a modelling standpoint, this
configures as a message sent by the service provider
to a potential customer. This message bears a cost,
that is a reflection of how difficult it is to get in
touch with a company. Providers can make a contact
with the employer only once, and it is assumed that
employers are reached by only one provider and
later on cannot be reached by a second provider.
Potential users then evaluate the VP according to
the value of the four VP components. We adopt a
multi-criteria assessment for the VP evaluation,
which include monetary and non-monetary aspects.
The multi-criteria evaluation depends on the relative
importance assigned to the different criteria, which
is expressed as a subjective judgment by the user.
Multi-criteria methods have already been used in
transport problems, and are suitable to the problem
at issue. For the proposed ABM, it is assumed that
evaluating the VP means giving a quantitative
outcome as a weighted linear combination of the
service (Eq. 2). In particular, the VP of provider i to
potential user j is as follows:
VP
ij
= w(p)
j
Price
i
+ w(i)
j
Intangible
i
+
w(s)
j
Sustainability
i
+w(r)
j
Risk
i
(2)
This evaluation method is associated with a
simple additive weighting (SAW) method (Afshari,
Mojahed and Yusuff, 2010). Triantaphyllou and
Mann (1989) state that SAW “gives the most
acceptable results for the majority of single-
dimensional problems” and is the most used multi-
criteria methods for its simplicity.
The decision to adopt the service does not
change over time even if a better solution for the
customer might be present in the system. This is
because it is not cost-effective for an employer to
look for other solutions, and thus the first solution to
provide overall benefits will be chosen (technology
lock in). On the contrary, a negative evaluation will
end the evaluation process and no agreement will be
signed between user and provider. However, users
can change their minds if conditions change. In this
case, there will be no need for a second contact and
the user will only re-evaluate the value proposition.
When a contract is signed among the parties, the
lockers are installed and then a payment is issued
Modelling Urban Logistics Business Ecosystems - An Agent-based Model Proposal
131

each month by the user to the provider, according to
the size of the locker.
The providers therefore can sum up all the profits
accrued during the previous months and calculate
their costs, including marketing budget spent for
reaching new customers and R&D budget spent in
improving the capacity. Table 5 summarizes the
events and rules that triggers them for each agent
type.
Table 5: Events, rules and agents of the model.
Agent
type
Event Rule
Facility
manager
VP received
Random choice by
software engine
VP accepted
Positive comparison
between alternatives
Change of criteria
weights
Market share
threshold
Payment issued Once per month
PLO
Parcel locker
installed
VP accepted
Payment received Payment issued
3.4 Model Verification
Verification of ABM often poses some challenges to
modellers. For model verification we adopt the
approach by Walters and Lancaster (2000). The first
verification step takes place during problem
formulation and model building, and is grounded on
the adoption of the theoretical framework (Zenezini
et al., 2017) that provides with the model
components. Moreover, first-hand verification with
stakeholders involved is used to verify that the
mechanisms in the model resemble the ones in the
real life case. Finally, given that only synthetic data
are available, the second and third validation stages
are carried out by performing a robustness analysis
on the main assumptions and hypotheses regarding
the performance indicators of the model.
4 COMPUTATIONAL
EXPERIMENT
Through the computational experiment we investi-
gate two different service offering configurations
related to the installation of parcel lockers inside
office buildings. The aim is to garner insights into
the service diffusion across potential users, in
relation with the allocation of the initial budget and
the type of service configuration.
To model the providers, interviews with the
founder from one company and the Director of
product design of a second company supported the
quantification of the value proposition of the two
competing services, and provided a realistic value
for operational parameters.
Concerning the facility managers, we consider
three types of employers, namely small, medium and
big entities according to the number of employees.
Small companies have less than 50 employees,
medium between 51 and 250, and big companies
have more than 250 employees. Such companies
differ in decision-making criteria as will become
clearer later on. Facility managers have to choose
between three alternatives: i) Business-As-Usual
(BAU), where no parcel lockers is installed, ii) first
configuration with only parcel lockers management,
and iii) second configuration with parcel lockers
management and parcels consolidation.
Software implementation is performed on
NetLogo. NetLogo is used for its simplicity and for
its ability for rapid prototyping and developing
proof-of-concept models (Anand, 2015).
4.1 Parameters and Variables
As mentioned above, data on infrastructure costs
were collected through interviews with a PLO, data
on marketing instead are a speculation based on the
assumption made for the two scenarios.
Some variables shape the system. To manage the
parcel lockers, PLOs build up their IT capacity,
which is directly dependent on the share of budget
allocated to R&D. The values for marketing cost are
set so that realistically all employers are reached in a
sufficient period of time, to avoid that a small share
of the budget devoted to marketing is enough to
reach all market in few simulation steps. Marketing
cost is furthermore assumed to be related to the
degree of innovation, and thus the marketing cost for
provider 1 is half the same cost for provider 2. In
other words, solution 1 is “easier” to understand and
thus it can reach a wider market. Hence, the
marketing effort is modelled by explicitly stating the
cost for reaching one customer and thus the share of
the market that can be reached with the marketing
budget.
Furthermore, more resources are necessary to
organize the last-mile delivery, thus the cost for each
unit of capacity is higher for provider 2. To organize
the last-mile, PLOs compute their handling capacity
as (Parcel handled per m2) x (Handling area).
From the facility manager point of view,
handling cost is as follows:
SIMULTECH 2018 - 8th International Conference on Simulation and Modeling Methodologies, Technologies and Applications
132
Handling cost = (Cost of handling cost per parcel
p
er
unit of time) x (Handling Time) x Employee per
company x Monthly demand per employee
(3)
Table 7 synthetizes the parameters of the model.
Table 6: Parameters of the model.
Actor Parameter Value
Both PLOs ITcapacity
r&dbudget / 1000
€
Cost of
infrastructure
100
€/lockerstation
Cost of
maintenance
50 €/lockerstation
PLO (first
configuration)
Marketing cost 2500 €
Fixed cost
150 €/locker
station
PLO (second
configuration)
area 100 m2
Parcel handled
per m2
3
Marketing cost 5000 €
Cost of
transportation
10 €/lockerstation
Cost of
handling
150 € /
lockerstation
Fixed cost
200 €/locker
station
Facility
Managers
Cost of
handling
0.33
€/minute/parcel
Handling time 5 minutes
4.2 Criteria Weights and Values
The alternatives are ranked using four criteria. Some
criteria need to be further detailed according to the
information given by the companies. The criterion
related to the intangible benefits is represented by
the hassles connected with having to face the
delivery process, determined with the amount of
people external to the employer that are involved in
this process. The criterion of sustainability is
assumed to have the highest value for the second
configuration, since it consolidates the deliveries and
therefore reduces the number of vehicles-km.
Finally, the risk criterion is assumed to be higher for
the PLO that organizes the last-mile and
consolidates goods, which is the more extensive
solution in terms of service offering among the three
ones and therefore the more risky for customers.
To calculate the values for each criterion and
convert them for the multi-criteria method their
value are computed and then converted into an
ordinal scale signifying their relative values. A
traditional Likert-scale 1-5 has been used to the task.
To this end, thresholds need to be identified for
criteria C1 and C2. For criteria C1, information from
online retails reports is used (Wallace, 2017).
Computing the cost of receiving parcels by using the
parameters identified previously and the average
number of monthly deliveries per employee, it is
assumed that the median employer usually spends in
average circa 5 €/ employee: this value is equivalent
to 3 in a Likert scale. For criteria C2, it is assumed
that one delivery person per day in average is still
manageable by the company, whereas 5 represents a
situation where having to deal with multiple persons
entails a strain on daily operations. This is especially
true if express couriers should change the drivers
very often.
To assign the weights, companies are profiled
based on their characteristics and size. The results of
this profiling are not presented here for space reason.
In practical terms, smaller companies are less
interested in consolidation value because they are
less likely to face a lot of deliveries and are also
more risk averse because installing locker station
require an investment which might be too large to
sustain for them. Larger companies instead care less
about price but more for sustainability and
consolidation, and are less risk averse.
4.3 Sensitivity Analysis
To validate the results of the evaluation phase and
check the robustness of the model, a sensitivity
analysis is performed on the criteria weights. The
objective of the sensitivity analysis is to identify the
change in criteria weights needed for diverging from
the first ranking, assessing the impact of those
changes on the final ranking of alternatives. This
work can be performed by making pair-wise
comparisons between two non-dominated
alternatives, and observe the change in the criteria
weights needed to reverse the total weighted value
of those alternatives by a predetermined amount. A
least-square procedure (Barron and Schmidt, 1988)
is applied on the weights assigned to the companies,
showing that the evaluation results holds quite well
after manipulating the criteria weights.
5 SIMULATION RESULTS
An experiment has been run to provide insights into
the effect of the parameters initial population, initial
Modelling Urban Logistics Business Ecosystems - An Agent-based Model Proposal
133
budget and marketing budget of the two providers
on the number of customers reached. In particular,
the ranges of the parameters are as follows:
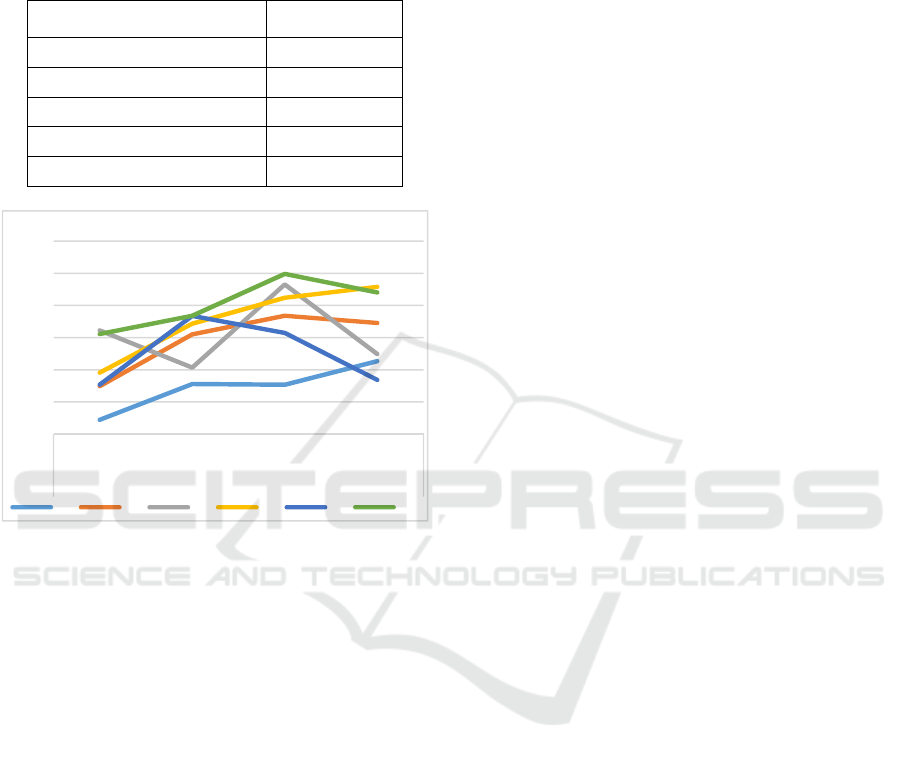
Table 7: Parameter settings for the run experiment.
Parameter Range
Initial Market 15-90
Marketing budget provider 1 2500-10000 €
Marketing budget provider 2 5000-15000 €
Initial Budget provider 1 20000-30000 €
Initial budget provider 2 20000-30000€
Figure 1 Market share of provider 1 with different levels
of marketing budget by provider 2 and different initial
population size.
One simulation run has been performed for each
setting of the parameters, generating 1440 total runs.
Figure 2 shows that only for selected initial
population of employers the average market size
reached by provider 1 increases with the marketing
budget.
For population size equals to 75 the market share
of provider 1 decreases with marketing spending.
For a population of 45 moreover, the average market
share is lower with a marketing budget of 10’000 €
than with a marketing budget of 2’500 €. From an
experiment with total market of 60 employers,
provider 1 can reach 50% of the market with either a
lower initial or marketing budget than provider 2 in
more than one third of the simulation runs (i.e.
36.25%).
These results further confirm that it may be
counterproductive to increase marketing spending as
well as the overall budget, and that a decision from
one provider affects the success of the other
provider.
Another experiment has been conducted on
profits, with the same range of parameters. To
compare fully the profits with market share it is
necessary to apply normalization to the profits, as
these are evidently influenced by the size of the
market. Hence, the average profit per initial
customers is used to check for correlation between
market share and profits. These simulations show
that the maximization of the profit per initial
customer for all marketing budgets does not take
place with the highest market share (i.e. with
population of 30 customers). Similarly, we find that
one of the lowest profit per customer corresponds to
the highest market share (i.e. with population of 90
customers).
6 DISCUSSIONS AND
CONCLUSIONS
This paper provides a first modelling and simulation
tool for assessing the implications of business model
decisions for UL systems.
The model simulation provides insights into a
specific case study that has become relevant in city
logistics, namely the parcel locker operator. The
model enables to assess the profitability of the
solution by assigning a business model to all
stakeholders involved. The model is designed on a
service offering and evaluation basis, where service
providers bear costs to reach customers and deliver
their value proposition, which is then assessed using
multiple criteria. Two different configuration of the
same innovation are modelled, ac-cording to the
specifics emerged during interviews with the
administrators of two parcel lockers companies. The
main strategic levers for the success of the business
model are the initial budget and the share of the
budget allocated to the marketing effort, which
enables the two providers to reach their customers.
Results show that in some cases a higher
marketing spending turns into smaller market share
reached and consequently lower profits. This
counterintuitive result originates from the fact that a
higher spending dries out the budget for one
provider, making it impossible to contact other
customers and thus leaving the completely
“untouched” market to the other provider. Hence, it
is clear that the outcome for each provider is
strongly influenced by the decisions taken by the
other providers.
This study has some limitations that will be
addressed in future research. In particular, the
30%
35%
40%
45%
50%
55%
60%
2500 5000 7500 10000
Marketing budget
Market share of provider 1
15 30 45 60 75 90
SIMULTECH 2018 - 8th International Conference on Simulation and Modeling Methodologies, Technologies and Applications
134

calculation of the metrics by the agents should lead
to further decision-making and reassessment of their
initial decisions. This reassessment should consider
the actual performance of the service delivery by the
providers, and it would then require the
implementation of a realistic operational model in
the existing ABM. By doing so, it would be feasible
to embed other metrics such as customer
satisfaction, reliability and efficiency in the
evaluation by the agents.
ACKNOWLEDGEMENTS
The authors wish to thank Nilesh Anand for his
precious suggestions and comments during the
development of the model.
REFERENCES
Afshari, A., Mojahed, M. and Yusuff, R. (2010) ‘Simple
additive weighting approach to personnel selection
problem’, International Journal of Innovation,
Management and Technology, 1(5), pp. 511–515. doi:
10.7763/IJIMT.2010.V1.89.
Anand, N. (2015) An Agent Based Modelling Approach
for Multi-Stakeholder Analysis of City Logistics
Solutions. PhD dissertation, TU Delft.
Barron, H. and Schmidt, C. P. (1988) ‘Sensitivity Analysis
of Additive Multiattribute Value Models’, Operations
Research, 36(1), pp. 122–127. doi: doi:10.1287/
opre.36.1.122.
Cagliano, A. C., De Marco, A., Mangano, G. and
Zenezini, G. (2016) ‘Assessing city logistics projects:
A business-oriented approach’, in Proceedings of the
Summer School Francesco Turco.
van Dam, K., Nikolic, I. and Lukszo, Z. (2013) Agent-
based modelling of socio-technical systems, Agent-
Based Social Systems. Springer-Verlag. doi:
10.1007/978-94-007-4933-7.
Ghajargar, M., Zenezini, G. and Montanaro, T. (2016)
‘Home delivery services: innovations and emerging
needs’, IFAC-PapersOnLine, 49(12). doi: 10.1016/
j.ifacol.2016.07.755.
van Heeswijk, W., Mes, M. and Schutten, M. (2016) ‘An
agent-based simulation framework to evaluate urban
logistics schemes’, in International Conference on
Computational Logistics. Springer, pp. 369–383.
Mena, C. and Bourlakis, M. (2016) ‘Retail logistics
special issue’, International Journal of Physical
Distribution & Logistics Management. Emerald Group
Publishing Limited, 46(6/7).
Morganti, E., Dablanc, L. and Fortin, F. (2014) ‘Final
deliveries for online shopping: The deployment of
pickup point networks in urban and suburban areas’,
Research in Transportation Business and
Management, 11, pp. 23–31. doi: 10.1016/j.rtbm.2014.
03.002.
Rooijen, T. van, Guikink, D. and Quak, H. (2017) ‘Long-
Term Effects Of Innovative City Logistics Measures’,
in 10th International City Logistics Conference. 14-16
June, Phuket, Thailand.
Roorda, M. J., Cavalcante, R., McCabe, S. and Kwan, H.
(2010) ‘A conceptual framework for agent-based
modelling of logistics services’, Transportation
Research Part E: Logistics and Transportation
Review, 46(1), pp. 18–31. doi: 10.1016/j.tre.2009.
06.002.
Savelsbergh, M. and Van Woensel, T. (2016) ‘City
Logistics: Challenges and Opportunities’, Transporta-
tion Science, 50(2), pp. 579–590. doi: 10.1287/trsc.
2016.0675.
Tamagawa, D., Taniguchi, E. and Yamada, T. (2010)
‘Evaluating city logistics measures using a multi-agent
model’, in Procedia - Social and Behavioral Sciences,
pp. 6002–6012. doi: 10.1016/j.sbspro.2010.04.014.
Taniguchi, E. and Tamagawa, D. (2005) ‘Evaluating City
Logistics Measures Considering the Behavior of
Several Stakeholders’, Journal of the Eastern Asia
Society for Transportation Studies, 6, pp. 3062–3076.
doi: 10.11175/easts.6.3062.
Teo, J. S. E., Taniguchi, E. and Qureshi, A. G. (2014)
‘Evaluation of Load Factor Control and Urban Freight
Road Pricing Joint Schemes with Multi-agent Systems
Learning Models’, Procedia - Social and Behavioral
Sciences, 125, pp. 62–74. doi: 10.1016/j.sbspro.2014.
01.1456.
Töytäri, P. and Rajala, R. (2015) ‘Value-based selling: An
organizational capability perspective’, Industrial
Marketing Management, 45, pp. 101–112. doi:
10.1016/j.indmarman.2015.02.009.
Triantaphyllou, E. and Mann, S. H. (1989) ‘An
examination of the effectiveness of multi-dimensional
decision-making methods: A decision-making
paradox’, Decision Support Systems, 5(3), pp. 303–
312. doi: 10.1016/0167-9236(89)90037-7.
Wallace, T. (2017) Ecommerce Trends: 147 Stats
Revealing How Modern Customers Shop in 2017.
Available at: https://www.bigcommerce.com/blog/
ecommerce-trends/.
Walters, D. and Lancaster, G. (2000) ‘Implementing value
strategy through the value chain’, Management
Decision, 38(3), pp. 160–178. doi: 10.1108/
EUM0000000005344.
Zenezini, G., van Duin, R., Tavasszy, L. and De Marco, A.
(2017) ‘Stakeholders’ roles for Business Modelling in
a City Logistics ecosystem: towards a conceptual
model’, in 10th International City Logistics
Conference. 14-16 June, Phuket, Thailand: Institute
for City Logistics.
Zenezini, G. and De Marco, A. (2016) ‘A review of
methodologies to assess urban freight initiatives’,
IFAC-PapersOnLine, 49(12). doi: 10.1016/j.ifacol.
2016.07.752.
Modelling Urban Logistics Business Ecosystems - An Agent-based Model Proposal
135
