
Overseer: A Multi Robot Monitoring Infrastructure
Felipe Roman, Alexandre Amory and Renan Maidana
School of Technology, Pontifical Catholic University of Rio Grande do Sul, Porto Alegre, Brazil
Keywords:
Mobile Robotics, Monitoring, Diagnostics, ROS.
Abstract:
In this paper, we present a lightweight runtime monitoring system for Multi Robot Systems, intended to
supervise and identify the state of a team of robots. It integrates the Nagios IT monitoring tool and the ROS
robotic middleware without any additional software at the robot side. The experimental results demonstrate
that the proposed monitoring system has a negligible performance impact on the robot, and the monitoring
server can easily support hundreds or even thousands of monitored robots.
1 INTRODUCTION
Robotics started at the beginning of 20th century, with
the necessity to improve productivity and quality of
manufactured products. Mobile robots are becoming
ubiquitous, as they are used to accomplish a variety of
tasks, from vacuum cleaning to accessing remote and
dangerous places, for example (Dudek and Jenkin,
2010).
A cost-effective way to enhance performance and
provide robustness to a robotic solution is to use
multiple robots instead of a single robot. Multi-
Robot Systems (MRS) have some advantages over
Single-Robot Systems (SRS), such as reduced time
required for task completion through parallelism, and
increased robustness and reliability due to the intrin-
sic redundancy. An MRS of cheaper and simpler
robots are typically more reliable than a more expen-
sive and intricate single robot (Parker, 2008). On the
other hand, MRS present more complex challenges
compared to SRS. For instance, MRS are more diffi-
cult to manage and coordinate collectively, requiring
increased communication capabilities. Another chal-
lenge is in determining the system’s global state and
debugging it, due to its distributed nature.
MRS can be classified as homogeneous or hetero-
geneous (Parker, 2008). Homogeneous MRS means
that all members of the team have the same specifi-
cation (hardware and software configuration). Het-
erogeneous MRS can have different kind of robots
in the same team. The advantage of heterogeneous
MRS is to support different kind of specialized and
simpler robots, compared to a single robot model that
does several different tasks. In this paper, we present
a monitoring system for heterogeneous MRS, where
the goal is to provide a means to easily monitor faults
and the state of the MRS as a whole. This is achieved
with the integration of the Nagios IT monitoring tool
and the Robot Operating System (ROS) framework.
The detection and isolation of the defective robot is a
first step toward an adaptive MRS, which can execute
the desired task even in the presence of faults.
The rest of this paper is organized as follows. Sec-
tion 2 presents previous papers. Section 3 describes
the proposed software architecture. Sections 4 and 5
present the experimental setup and the obtained re-
sults. Section 6 concludes the paper.
2 PREVIOUS WORKS
Parker (Parker, 2008) describes a large number of
possible of faults in robotics, such as: Robot sen-
sors faults, uncertain environment models, interaction
faults, limited power and computation limits. In order
to navigate this complex fault landscape, roboticists
need adequate tools to monitor and address these is-
sues. Robot middlewares (Elkady and Sobh, 2012)
are one of these tools developed to abstract part of the
complexity related to software design and hardware
abstraction. However, in terms of fault tolerance,
these robot middlewares (Elkady and Sobh, 2012;
Brugali and Scandurra, 2009; Brugali and Shakhimar-
danov, 2010) usually address only single parts of the
problem and most of the time the solution does not
address MRS.
Roman, F., Amory, A. and Maidana, R.
Overseer: A Multi Robot Monitoring Infrastructure.
DOI: 10.5220/0006851801410148
In Proceedings of the 15th International Conference on Informatics in Control, Automation and Robotics (ICINCO 2018) - Volume 1, pages 141-148
ISBN: 978-989-758-321-6
Copyright © 2018 by SCITEPRESS – Science and Technology Publications, Lda. All rights reserved
141

2.1 Individual Robots Fault Monitoring
Pettersson (Pettersson, 2005) classifies the mon-
itoring methods into analytical, data-driven, and
knowledge-based. The analytical methods (further
classified as parameter estimation, parity relations,
and observers) compare two analytically generated
quantities obtained from different sets of variables
and an analytical model. The data-driven methods
derive fault detection directly from input data, usu-
ally by computing statistic measures. The most pop-
ular method of fault monitoring in robotics is to com-
pare the sensors values with a pre-determined range
of acceptable values (i.e. using thresholds). The
knowledge-based approaches are designed to simu-
late the problem-solving skills of humans (e.g. arti-
ficial neural networks or expert systems), which com-
bine both analytical and data-driven approaches to
create a hybrid monitoring method.
Logging (Lotz et al., 2011) is another fault detec-
tion technique where data is collected in advance, to
be analyzed later (off-line fault detection). During the
normal runtime, all necessary data is collected and
stored in some device. The disadvantage of this tech-
nique is that a huge amount of data can be generated.
Usually logging needs another monitor to check if the
device is not full and in need of clean-up actions. Log-
ging can be used for both SRS and MRS.
2.2 Multiple Robots Fault Detection
Fault detection systems in MRS (Mendes and
da Costa, 2010) have the distribution as a coefficient
that increases the complexity of the process. The
robots of an MRS must be able to cooperate and com-
municate with each other to achieve satisfactory per-
formance and stability. A networked control system is
a requirement to connect all robots through commu-
nication networks. Because of this complexity, these
systems are subject to faults, performance deteriora-
tion, or operation interruption.
Kannan and Parker (Kannan and Parker, 2007)
propose a metric for evaluation the effectiveness of
fault-tolerance in MRS. Most existent metrics ac-
counts for the system robustness based only on the re-
dundancy of MRS. The ability of learning from faults
and reasoning (e.g. replanning) are not accounted.
The authors propose a new evaluation metric which
is application-independent, and can be used to com-
pare different fault detection approaches.
RoSHA (Multi-Robot Self-Healing Architecture)
(Kirchner et al., 2014) is an architecture that offers
self-healing capabilities for MRS. The architecture of
the self-healing add-on should be resource efficient,
to prevent indirect interferences. Scalability is an-
other important requirement. The self-healing add-
on should be independent from the size and distribu-
tion of an MRS. Beside these envisioned features of a
self-healing architecture, humans should be still able
to oversee and control the system. This work presents
a very advanced proposal on how to handle the MRS
dependability challenges. However, it does not de-
tail how to address a possible solution and does not
contain evidence that this proposal is already imple-
mented.
Kaminka et al. (Kaminka et al., 2002) present
an approach to monitor multi-agent systems by ob-
serving their actions by tracking the routine commu-
nication among these agents. The results show that
the proposed approach has a monitoring performance
comparable to a human expert. There is no evalua-
tion on the computing performance overhead caused
on each agent by the proposed monitoring. The au-
thors state that the so called report-based monitoring
requires modification on the robot’s software plans,
and it generates major network bandwidth usage. On
the other hand, in this paper we show that our pro-
posed method is not intrusive (i.e. it does require
modifications in the robot software) and it does not
have significant network bandwidth, memory, or CPU
requirements.
DRUMS (Distributed Robot Monitoring System)
(Monajjemi et al., 2014) is a tool for monitoring, fault
detection and debugging in distributed robot systems.
It integrates to the robot middleware used (e.g., ROS,
player) and monitors interactions in user code, the
middleware itself, the robot devices (e.g., sensors),
network interfaces and more. Its output can be vi-
sualized with third-party tools by a human operator,
or DRUMS can be used as a low-cost data collection,
fault detection and diagnostics software layer.
3 PROPOSED ARCHITECTURE
This section describes the proposed Multi Robot
Monitoring architecture and the tools related to it.
3.1 Used Robot Middleware
The ROS framework is designed to reduce the cost
of software development for large-scale robots sys-
tems, providing the communication layer above the
host operating system and the application. According
to (Dudek and Jenkin, 2010) the ROS main character-
istics are:
• Peer-to-peer communication to reduce traffic in
ICINCO 2018 - 15th International Conference on Informatics in Control, Automation and Robotics
142

the network. It uses publish/subscribe communi-
cation;
• Tools-based: micro kernel designed instead of
monolithic kernel;
• Multi-lingual support;
• Thin: software development libraries with no de-
pendencies on ROS;
• Free and open-source under BSD license;
• Organized in packages in order to build large sys-
tems;
ROS has a modular design that allows advanced
communication functionalities, which could be ex-
tended to communicate with any kind of other tools.
Moreover, the framework provides some tools for
fault monitoring and diagnosis (Goebel, 2014; Foote,
2010). These tools are useful for development and
monitoring one specific robot each time and not for
the entire MRS. This solution addresses only part of
the overall problem of runtime monitoring because
they allow checking the status of one component/-
module at time. The Diagnostics stack (Goebel, 2014;
Foote, 2010) is the software responsible for analyzing
and reporting the system state. It consists of develop-
ment support for collecting, publishing, and visualiz-
ing monitoring information. This tool-chain is built
around a standardized topic, named /diagnostic
topic, where monitoring information are continuously
published.
ROS also provides the diagnostic_aggregator
,→ package, which subscribes to the /diagnostic
,→ topic, reads the raw published data, reorganizes
all information based on a set of pre-defined rules
(YAML file), and publishes the generated result in the
/diagnostic_agg topic. The diagnostic.yaml file
defines groups to aggregate the information according
with the type of data. For example, robots with more
than one battery could aggregate all batteries statuses
on a Battery group.
Another tool built-in on ROS is the
robot_monitor tool. This is a GUI tool that displays
all results published on the /diagnostic_agg topic
in a hierarchical format. A double click on the
selected information will open more details about the
diagnostic. Different icons and colors make it easy to
identify components in OK, ERROR or WARNING
statuses.
3.2 Used IT Infrastructure Monitoring
Tool
Nagios (Barth, 2008) is a platform for executing spe-
cific checks to monitor an entire system of networked
Figure 1: Software Architecture.
computers. It supports several different methods and
protocols to access the remote computers, meanwhile
being highly customizable such that it can monitor
practically any kind of device information. For in-
stance, the use of memory, free space on disks, CPU
load, the number of processes, specific processes, and
many other customized information. Nagios provides
an easy web interface for graphical view of the entire
system and simple navigation into the nodes, allowing
searching for detailed monitoring information. Other
resources that might also be useful in the context of
robotics include SMS/email notifications and the dis-
play of time series dynamic charts of data collected
from the hosts. Scalability is another characteristic of
Nagios. Several non-central Nagios instances could
send their results to a Nagios Central Server using the
Nagios Service Check Acceptor.
Nagios has a flexible design that allows the devel-
opment of extensions to communicate and to moni-
tor almost any kind of system through a Nagios plu-
gin (Nagios Enterprises LLC, 2017). The plugin is a
small piece of software that must be developed fol-
lowing the Nagios plugin specification, in order to
support the Nagios API. Plugins used for host and ser-
vice checks are separate and independent programs
that can also be used outside of Nagios.
3.3 Developed Architecture
The proposed software architecture, illustrated in Fig-
ure 1, connects Nagios through the developed ROS
Diagnostics Nagios plugin (referred here as ROS plu-
gin) directly with the ROS diagnostics aggregator
topic on the remote robot. The ROS plugin connects
to the ROS diagnostic aggregator node through ROS
APIs and gets the requested information, printing the
output on a standard output format required for the
Nagios engine. All communications are executed us-
ing the XML-RPC protocol.
Nagios remotely connects to the robot and re-
trieves the required information. It does not require
any additional software installed or running at the
Overseer: A Multi Robot Monitoring Infrastructure
143

robot side. The only requirement is the diagnostic ag-
gregator node, which is already present in most ROS-
compatible robot platforms. On the Nagios server
side, it needs the basic ROS installation to use the
ROS protocols and standard diagnostic message for-
mats.
The ROS plugin is a Python script developed to
access the robot’s ROS core node via XML-RPC, to
remotely subscribe to the diagnostic aggregator topic
of each monitored robot, and to parse the information
in the Nagios output format. The proposed plugin is
general in the sense that it is independent of the mon-
itored device. It can parse information of any kind of
robot with different number and types of devices.
The following example shows the robot’s overall
status, which is OK. It lists the name of topics which
carry the status of different parts of the robot. The
robot’s overall status and its topics can have 3 pos-
sible statuses: OK, CRITICAL and WARNING. The
overall status assumes the most severe status of all
monitored topics.
$ . / r os −d i a g n o s t i c s a g g . py −H < h o s t >
OK − OK S e n s o r ( s ) l i s t :
/ Camera , / Camera / Caml , / L aser ,
/ L a s er / L a ser 1 , / L a se r / L a ser 2 , / Motor ,
/ Motor / Motor1 , / Motor / Motor2 ,
/ Motor / Motor3 , / Power ,
/ Power / L a pto p B a t t e r y ,
/ Power / Robot B a t t e r y , / Temp ,
/ Temp / Sen s or1 , / Temp / S e n s o r 2
The following example shows topics in different
severity status. Figure 2 shows Nagios monitoring
multiple robots with different statuses. The main ta-
ble shows the statuses of two robots (#1 and #2 in
Figure 2). Robot #1 has 6 checks and only the last
one presents a warning state (Figure 2(c)), in yellow.
Robot #2 has 9 checks, the 8th in critical state (Fig-
ure 2(a), in red) and a few other checks are in pending
state (Figure 2(b), in grey) because the robot has been
powered up recently. Robot #1 has a single check for
all sensors (Figure 2(d)), while robot #2 has multiple
checks for different sensors (laser, camera, battery).
This scenario gives an example of two types of moni-
toring configurations: detailed or summarized.
CRITICAL − CRITICAL s e n s o r ( s ) l i s t :
/ Camera , / Camera / Cam1
WARNING s e n s o r ( s ) l i s t :
/ Power , / Power / L apt op
OK s e n s o r ( s ) l i s t :
/ L a ser , / L a s er / L a ser 1 , / L a se r / L a ser 2 ,
/ Motor , / Motor / Motor1 , / Motor / Motor2 ,
/ Motor / Motor3 , / Power ,
/ Power / Robot B a t t e r y ,
/ Temp , / Temp / S enso r1 ,
/ Temp / S e n s o r 2
The plugin also has the ability to monitor only
specific sensors’ status, instead of monitoring all
robot’s statuses. For example, the plugin syntax al-
lows the monitoring of only battery statuses:
$ . / r os −d i a g n o s t i c s a g g . py −H < h o s t > −
,→ N b a t t e r y
OK − OK S e n s o r ( s ) l i s t :
/ Power , / Power / L apt op B a t t e r y ,
/ Power / Robot B a t t e r y
In this case, all other sensors not containing bat-
tery in the name are ignored by the plugin. The name
parameter also allows more configuration flexibility
on Nagios. For example, it allows monitoring of the
Motor status every 5 minutes, and the temperature
sensor every 30 seconds.
An important characteristic of this architecture is
the fact that the monitor system is completely inde-
pendent of the robot application, meaning that if the
monitor server stops, only the monitor system will
cease. The robotic system will carry on working as
if nothing happened.
4 EXPERIMENTS
Two types of experiments are performed to evaluate
the proposed architecture: a scalability experiment
with up to 100 heterogeneous virtual robots, and an
experiment with one real robot.
4.1 Server Scalability Experiment
Up to 100 heterogeneous virtual robots were executed
at the same time to test the scalability of the monitor-
ing server. The rest of this section details the virtual
robot setup and the monitoring server setup.
Figure 3 illustrates the architecture of the scala-
bility experiment. The Database server in the left side
is not a solution requirement and was created only to
collect performance data (e.g. cpu load, memory us-
age and network bandwidth) from the virtual robots
during the experiment. Nagios server is running and
the proposed ROS plugin is installed on the server
side, without any change to the virtual robots’ soft-
ware. All computers (servers and robots) are on the
same network, or equivalent via VPN. Details of this
setup are presented in the next sections.
4.1.1 The Virtual Robot Setup
The virtual robot is a Python application, running on
a Virtual Machine (VM), developed to generate di-
agnostic data typically generated by robots compliant
with ROS diagnostics. The python application reads
ICINCO 2018 - 15th International Conference on Informatics in Control, Automation and Robotics
144
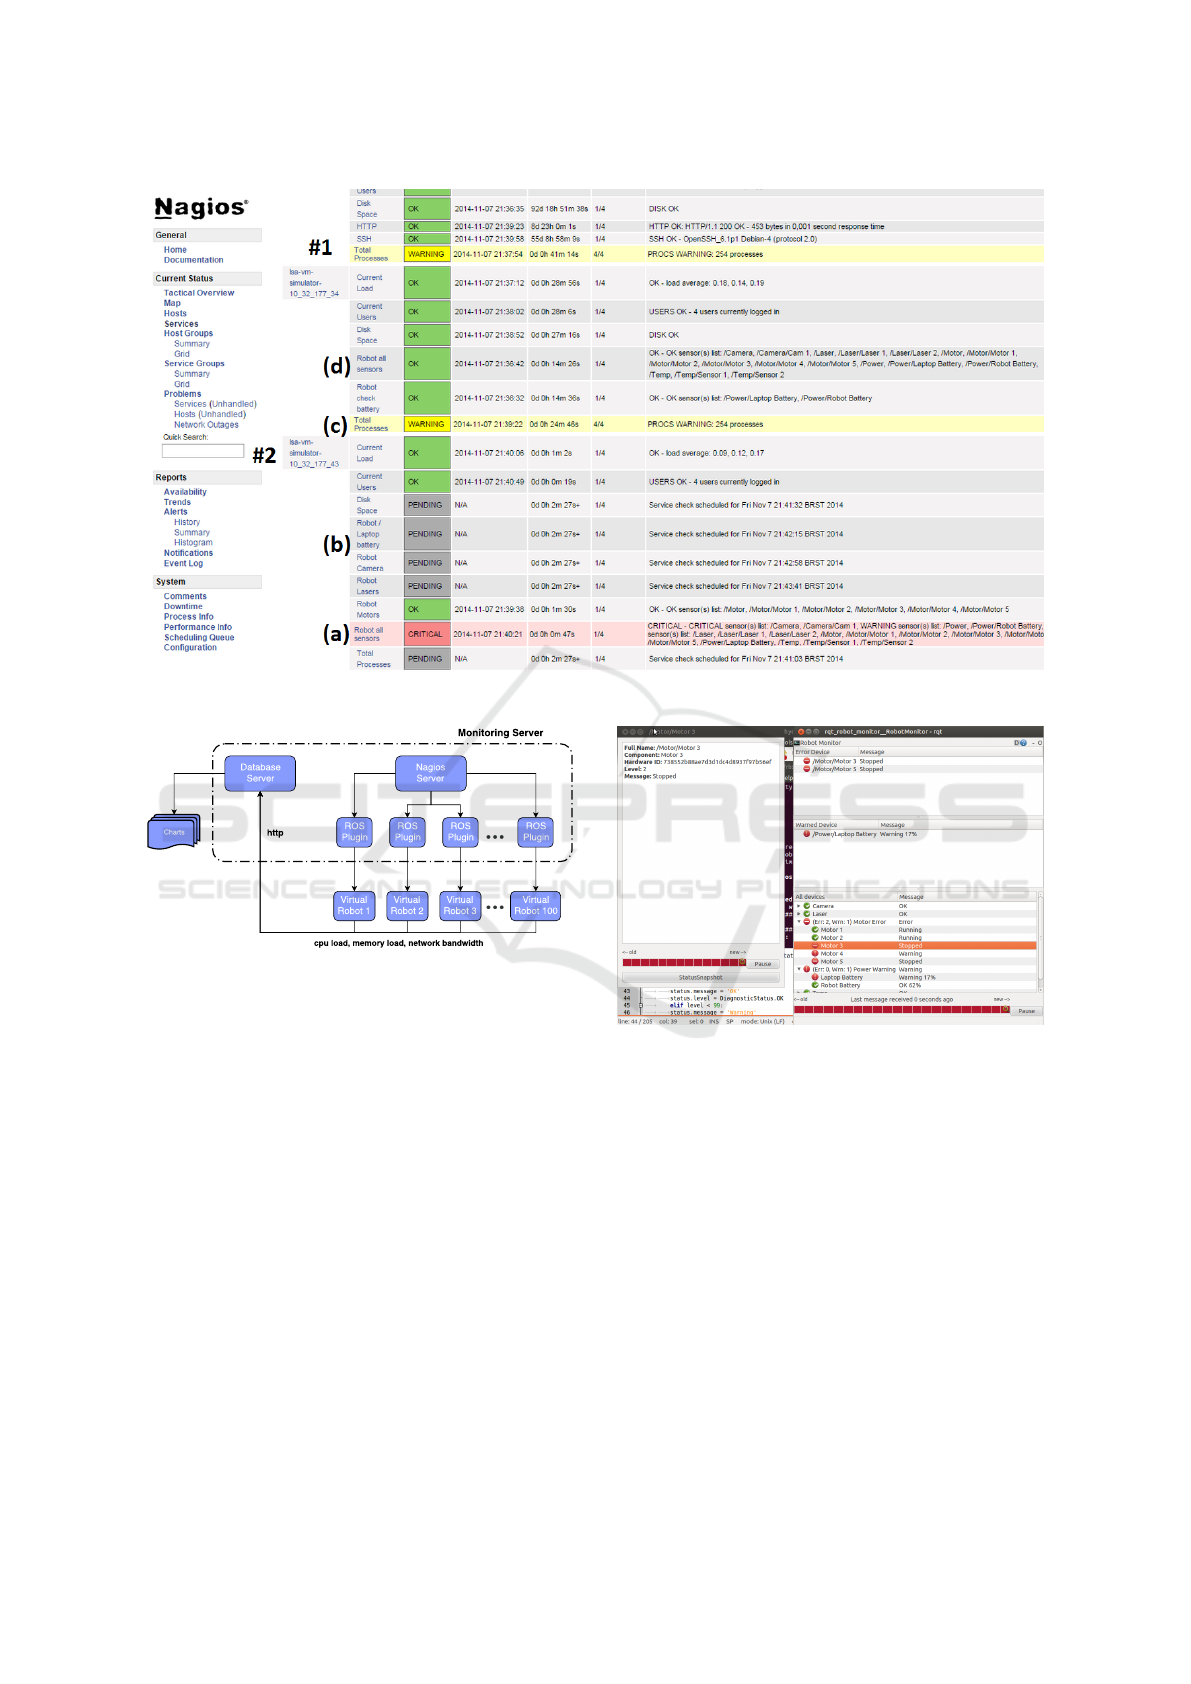
Figure 2: Nagios monitoring two robots with the proposed plugin.
Figure 3: Schematic view of the server scalability experi-
ment.
a set of configurations and, based on these configura-
tions, it publishes data on the ROS diagnostics topic.
The configuration defines the total number of sensors
to be simulated and the number of sensors in warning
and error states. As such, each virtual robot can sim-
ulate different numbers of monitored devices, charac-
terizing an heterogeneous MRS.
All virtual robot diagnostic information is com-
bined in a diagnostic aggregator node, which defines
rules to parse the raw diagnostic information and cat-
egorize it into a more readable and meaningful way,
on the /diagnostics_agg topic.
Figure 4 illustrates the RQT robot monitor, cap-
turing the diagnostic information generated by the de-
veloped Python application. This figure shows a list
of the monitored devices and their statuses. At left it
shows the detailed information of the selected device.
The virtual robot is running on a virtual machine
Figure 4: RQT screenshot of the simulator running on a
virtual machine.
with 256 megabytes of RAM, and 1 processor running
Ubuntu 12.04 and ROS Hydro. When a new instance
of the virtual robots’ VM is started up, it automati-
cally sends its IP address to the Nagios server, to be
included into the monitoring process. This script is
only used in the experiment to ease the management
of 100 virtual robots. When using real robots, no ad-
ditional setup is required at the robots’ side.
A status script was created to collect performance
data during runtime and to send this information to
the database server. This bash script runs on the guest
OS and gets CPU usage from the /proc filesystem,
the memory usage information from the ”free” Unix
command output, and calculates the bandwidth trans-
mitted from /sys/class/net every minute.
Overseer: A Multi Robot Monitoring Infrastructure
145

4.1.2 Monitoring Server
The Nagios monitoring server is running on a virtual
machine, created with 2048 megabytes of RAM and 2
processors running Ubuntu 13.10. It runs the Nagios
server, a MySQL database server, an Apache HTTP
server configured with PHP module enabled, and the
proposed ROS plug-in used to collect ROS diagnostic
information from the remote robots.
The database server is also used to collect all
robot’s performance data, gathered during the exper-
iments presented in Section 5. As mentioned before,
each robot periodically extracts its own CPU load,
memory load and network bandwidth, and saves this
information into the database server located at the
monitoring server. This specific database is not re-
quired by the proposed solution. This is only used to
ease the data capture of 100 simulated robots during
hours of execution.
4.2 Experiment with Real Robot
The experiment with a real robot uses a Kobuki-based
Turtlebot
1
mobile base, equipped with a Kinect depth
sensor to avoid obstacles. One notebook with a Core
i5 processor, 8GB of RAM memory, Ubuntu 12.04,
and ROS Hydro, is used for running the application.
The robot is programmed to perform autonomous
navigation with collision avoidance, while diagnostic
data is captured periodically.
The robot runs ROS’ kobuki_node
2
pack-
age to access and control the mobile base, the
freenect_stack
3
package to access the Kinect,
and ROS’ move_base
4
autonomous navigation stack
(Goebel, 2014). The kobuki_node locally produces
diagnostic information from the mobile base in real-
time.
5 RESULTS
5.1 Server Scalability
This experiment evaluates the scalability of the mon-
itoring server as the number of monitored virtual
robots increases up to 100. Each virtual robot requires
an average of 10 checks, as illustrated in Figure 2.
The monitoring server and the virtual robot configu-
rations are described in Section 4.1.
1
http://kobuki.yujinrobot.com/about2/
2
http://wiki.ros.org/kobuki node
3
http://wiki.ros.org/freenect stack
4
http://wiki.ros.org/move base
Figure 5 in the appendix shows the monitor-
ing servers performance while the number of virtual
robots increases from 1 to 30, 60, and 100 instances.
The evaluated performance parameters are CPU load,
memory load, and network bandwidth. These param-
eters are collected every 5 minutes during 100 min-
utes for each configuration. For each of the 3 param-
eters, their mean (or average), median, and standard
deviations (error bars) are presented in the following
3 charts.
These results show that Nagios, although over-
loaded with the presented VM configuration, can still
monitor up to 100 robots. It is reported that Nagios
can monitor thousands of computers (Barth, 2008),
when a normal fully-configured server is used instead
of this VM. If we assume one computer per robot, it
means that thousand robots could be monitored.
5.2 Virtual Robot Performance
Experiment
This experiment collects performance data at the
robot side, in this case, at the virtual robot’s VM.
Performance data (CPU load, memory load, network
bandwidth) was collected during 60 hours with dif-
ferent monitoring frequencies (no monitoring, every
5 minutes, and every 1 minute). The observed results
are illustrated in Figure 6 in the appendix, where once
again the mean, median, and standard deviations as
error bars are presented in each chart.
These results show that the monitoring process has
a small impact on the monitored VMs, even if we con-
sidered the minimal resources allocated for each VM,
as described in Section 4.1. The network bandwidth
shows an increasing pattern, however the chart’s unit
is kilobytes per minute, which is a very small amount
of data.
5.3 Real Robot Experiment
This experiment evaluates the impact of the monitor-
ing system on a real robot, running a common mo-
bile robot software application for autonomous navi-
gation. The robot’s hardware and software configura-
tions are described in Section 4.2.
Table 1 shows the performance data (CPU load,
memory load, network bandwidth), collected during
30 minutes of navigation. First, data is collected when
the monitoring system is off, and then the same navi-
gation task is repeated with the monitoring system on.
As mentioned before, no specific configuration or ad-
ditional software is required on the robot to enable the
proposed monitoring system. The results confirm the
efficiency of the proposed method at the robot side.
ICINCO 2018 - 15th International Conference on Informatics in Control, Automation and Robotics
146

Table 1: CPU load, memory load and network bandwidth at
the real robot with the monitoring on (every 5 minutes) and
off.
Item
Monitor
Status
Mean Median
Standard
Deviation
Off 133.05 132.00 26.45
On 135.75 129.00 43.30
CPU
Load
% of change 2.03 -2.27 63.71
Off 30.23 30.00 0.42
On 30.81 31.00 0.39
Memory
Load
% of change 1.92 3.33 -7.60
Off 0.19 0.00 0.71
On 0.21 0.00 0.73
Network BW
(kB/s)
% of change 7.58 N/A 2.52
6 CONCLUSIONS
This paper presented a lightweight and easy to config-
ure monitoring infrastructure, to monitor the statuses
of a large number of different robots during runtime.
The proposed approach integrates consolidated tools
for IT monitoring (Nagios) and robotics (ROS), which
proved to be very effective and efficient for robotics.
In terms of usability, the proposed approach re-
quires no modification or additional software on the
robot side, other than the robotic framework. On the
server side, the proposed ROS plug-in must be in-
stalled and the server must be able to access the robots
via their IP addresses.
Experimental results show that it is possible to
monitor 100 robots with a minimally configured Na-
gios Server, with the proposed ROS plug-in. The
results also show that the monitoring impact on real
robots is very small or negligible compared to the re-
sources required to perform a usual autonomous nav-
igation task.
As future work, we intend to use the proposed ap-
proach as a supervisory system, to monitor and log
events of one or multiple industrial robots.
ACKNOWLEDGEMENTS
This paper was achieved in cooperation with
CAPES/Brazil, under project 88887.115590/2015-01,
Pro-Alertas program.
REFERENCES
Barth, W. (2008). Nagios: System and Network Monitor-
ing. No Starch Press, San Francisco, CA, USA, 2nd
edition.
Brugali, D. and Scandurra, P. (2009). Component-based
robotic engineering (part i) [tutorial]. IEEE Robotics
& Automation Magazine, 16(4):84–96.
Brugali, D. and Shakhimardanov, A. (2010). Component-
based robotic engineering (part ii). IEEE Robotics &
Automation Magazine, 17(1):100–112.
Dudek, G. and Jenkin, M. (2010). Computational Princi-
ples of Mobile Robotics. Cambridge University Press,
New York, NY, USA, 2nd edition.
Elkady, A. Y. and Sobh, T. M. (2012). Robotics mid-
dleware: A comprehensive literature survey and
attribute-based bibliography. Journal of Robotics,
2012:959013:1–959013:15.
Foote, T. (2010). Diagnostic system for robots run-
ning ros. http://www.ros.org/reps/rep-0107.html (Ac-
cessed: 25-03-2018).
Goebel, P. (2014). ROS By Example. Lulu.
Kaminka, G. A., Pynadath, D. V., and Tambe, M. (2002).
Monitoring teams by overhearing: A multi-agent
plan-recognition approach. Journal of artificial intel-
ligence research, 17:83–135.
Kannan, B. and Parker, L. E. (2007). Fault-tolerance based
metrics for evaluating system performance in multi-
robot teams. In Performance Metrics for Intelligent
Systems Workshop.
Kirchner, D., Niemczyk, S., and Geihs, K. (2014). Rosha:
A multi-robot self-healing architecture. In RoboCup
2013: Robot World Cup XVII, pages 304–315.
Lotz, A., Steck, A., and Schlegel, C. (2011). Runtime mon-
itoring of robotics software components: Increasing
robustness of service robotic systems. In IEEE In-
ternational Conference on Advanced Robotics, pages
285–290.
Mendes, M. J. G. C. and da Costa, J. S. (2010). A multi-
agent approach to a networked fault detection system.
In Conference on Control and Fault-Tolerant Systems,
pages 916–921.
Monajjemi, V., Wawerla, J., and Vaughan, R. (2014).
Drums: A middleware-aware distributed robot mon-
itoring system. In Canadian Conference on Computer
and Robot Vision, pages 211–218.
Nagios Enterprises LLC (2017). Nagios plug-
ins development guidelines. https://nagios-
plugins.org/doc/guidelines.html (Accessed: 25-
03-2018).
Parker, L. E. (2008). Multiple Mobile Robot Systems, pages
921–941. Springer Berlin Heidelberg, Berlin, Heidel-
berg.
Pettersson, O. (2005). Execution monitoring in robotics: A
survey. Robotics and Autonomous Systems, 53(2):73–
88.
Overseer: A Multi Robot Monitoring Infrastructure
147

APPENDIX
(a)
(b)
(c)
Figure 5: CPU Load (a), memory load (b) and network
bandwidth (c) used at the monitoring server as the number
of virtual robots increases.
(a)
(b)
(c)
Figure 6: CPU Load (a), memory load (b) and network
bandwidth (c) used at the monitoring server as the moni-
toring interval decreases.
ICINCO 2018 - 15th International Conference on Informatics in Control, Automation and Robotics
148
