
Towards Rich Sensor Data Representation
Functional Data Analysis Framework for Opportunistic Mobile Monitoring
Ahmad Mustapha, Karine Zeitouni and Yehia Taher
DAVID Laboratory, UVSQ, Paris-Saclay University, 45 Avenue des Etats-Unis, Versailles, France
Keywords:
Functional Data Analysis, Database, Spatiotemporal, Multivariate Time Series, Sensors, Opportunistic
Mobile Monitoring.
Abstract:
The rise of new lightweight and cheap sensors has opened the door wide for new sensing applications. Mobile
opportunistic sensing is one type of these applications which has been adopted in multiple citizen science
projects including air pollution monitoring. However, the opportunistic nature of sensing along with cam-
paigns being mobile and sensors being subjected to noise and missing values leads to asynchronous and un-
clean data. Analyzing this type of data requires cumbersome and time-consuming preprocessing. In this paper,
we introduce a novel framework to treat such type of data by seeing data as functions rather than vectors. The
framework introduces a new data representation model along with a high-level query language and an analysis
module.
1 INTRODUCTION
The rise of new lightweight and cheap environmental
sensors is opening the door wide for more IoT ap-
plications that haven’t been possible years ago. Re-
cently, air quality monitoring has ridden the wave and
shifted towards opportunistic mobile monitoring. Op-
portunistic mobile monitoring takes advantage of peo-
ple daily commuting in order to monitor air pollution
on a fine scale (Van Den Bossche et al., 2016). This
is done by fetching air quality sensors kits on volun-
teers and leaving them to commute while holding the
sensors without restriction on time or space.
In air quality monitoring context, the sensors kits
generate multivariate spatial time series. For exam-
ple, one record of these kits might include Black Car-
bon (BC) concentration, Nitrogen Oxide (NO2) con-
centration, location (latitude, longitude), and a times-
tamp. Such data has always been stored using con-
ventional relational databases as one long table. How-
ever, such representation of time series isn’t the best
representation when it comes to data analysis.
Analyzing multivariate spatial time series requires
a cumbersome preprocessing stage. Especially when
it comes to opportunistic monitoring. The data gen-
erated from multiple individuals won’t be synchro-
nized during opportunistic monitoring because there
exists no restriction on time or space.(Van Den Boss-
che et al., 2016) While one individual is using the sen-
sor the other might not. Moreover, sensors are always
subjected to malfunctioning, noise, and no-signal mo-
ments which results in noisy, and incomplete time se-
ries. Fixing these problems in large datasets is cum-
bersome and time-consuming. In this paper, we aim
to describe a novel multivariate spatial time series rep-
resentation that can solve the aforementioned prob-
lems in a robust and semi-automatic manner.
The proposed representation sees the measured
variables as functions rather than discrete data
records. While sensors can only generate discrete
data, the generated data can always be approximated,
using curve fitting and regression techniques, by
functions with a considerable number of parameters.
These approximate functions are then stored along
with the residuals and other quality indices as they
are. The notion of functionDB (Thiagarajan and Mad-
den, 2008) is borrowed to apply functions storage,
aggregation, transformation, and retrieval through an
extended SQL query language. This proposed repre-
sentation is to be implemented and the supposed ben-
efits will be validated.
The rest of the paper is structured as what fol-
lows. Section 2 illustrates and describes the proposed
framework.Section 3 demonstrates a spatial applica-
tion. Section 4 discusses the benefits of the frame-
work and Section 5 concludes the paper.
290
Mustapha, A., Zeitouni, K. and Taher, Y.
Towards Rich Sensor Data Representation.
DOI: 10.5220/0006788502900295
In Proceedings of the 4th International Conference on Geographical Information Systems Theory, Applications and Management (GISTAM 2018), pages 290-295
ISBN: 978-989-758-294-3
Copyright
c
2019 by SCITEPRESS – Science and Technology Publications, Lda. All rights reserved
2 THE FRAMEWORK
2.1 Overview
Data scientists and researchers have been approxi-
mating discrete data by functions for several reasons.
However, curve fitting has always been a stage and
not a destination or a final structure. In this proposal,
we are willing to go further and establish functions
as a well-defined and more abstract representation of
sensors data.
In order to achieve this representation, a trans-
formation and restructuring process will be applied
to raw and discrete sensors data similar to conven-
tional ETL (Extract, Transform, Load). The initial
step of this process is to read the data which are usu-
ally stored in ASCII formatted files or as tables in
databases. Curve fitting techniques are then applied
to generate a function for each monitored entity as a
relation to a certain continuum mostly time or space.
After the functions are generated they are stored and
restructured in a specialized database. At this point,
the data is fully represented by a pool of functions.
The power of such representation is not only in over-
coming cumbersome preprocessing but also in the op-
erations that can be applied to the functions. Alge-
braic aggregation and transformation can be applied
to functions in the interest of generating new func-
tions that enrich the initial set. Also, knowledge can
be extracted directly from this pool of functions by
applying functional data analysis techniques (Ramsay
and Silverman, 2013), a field of statistics that focuses
on analyzing functions, to serve exploratory, confir-
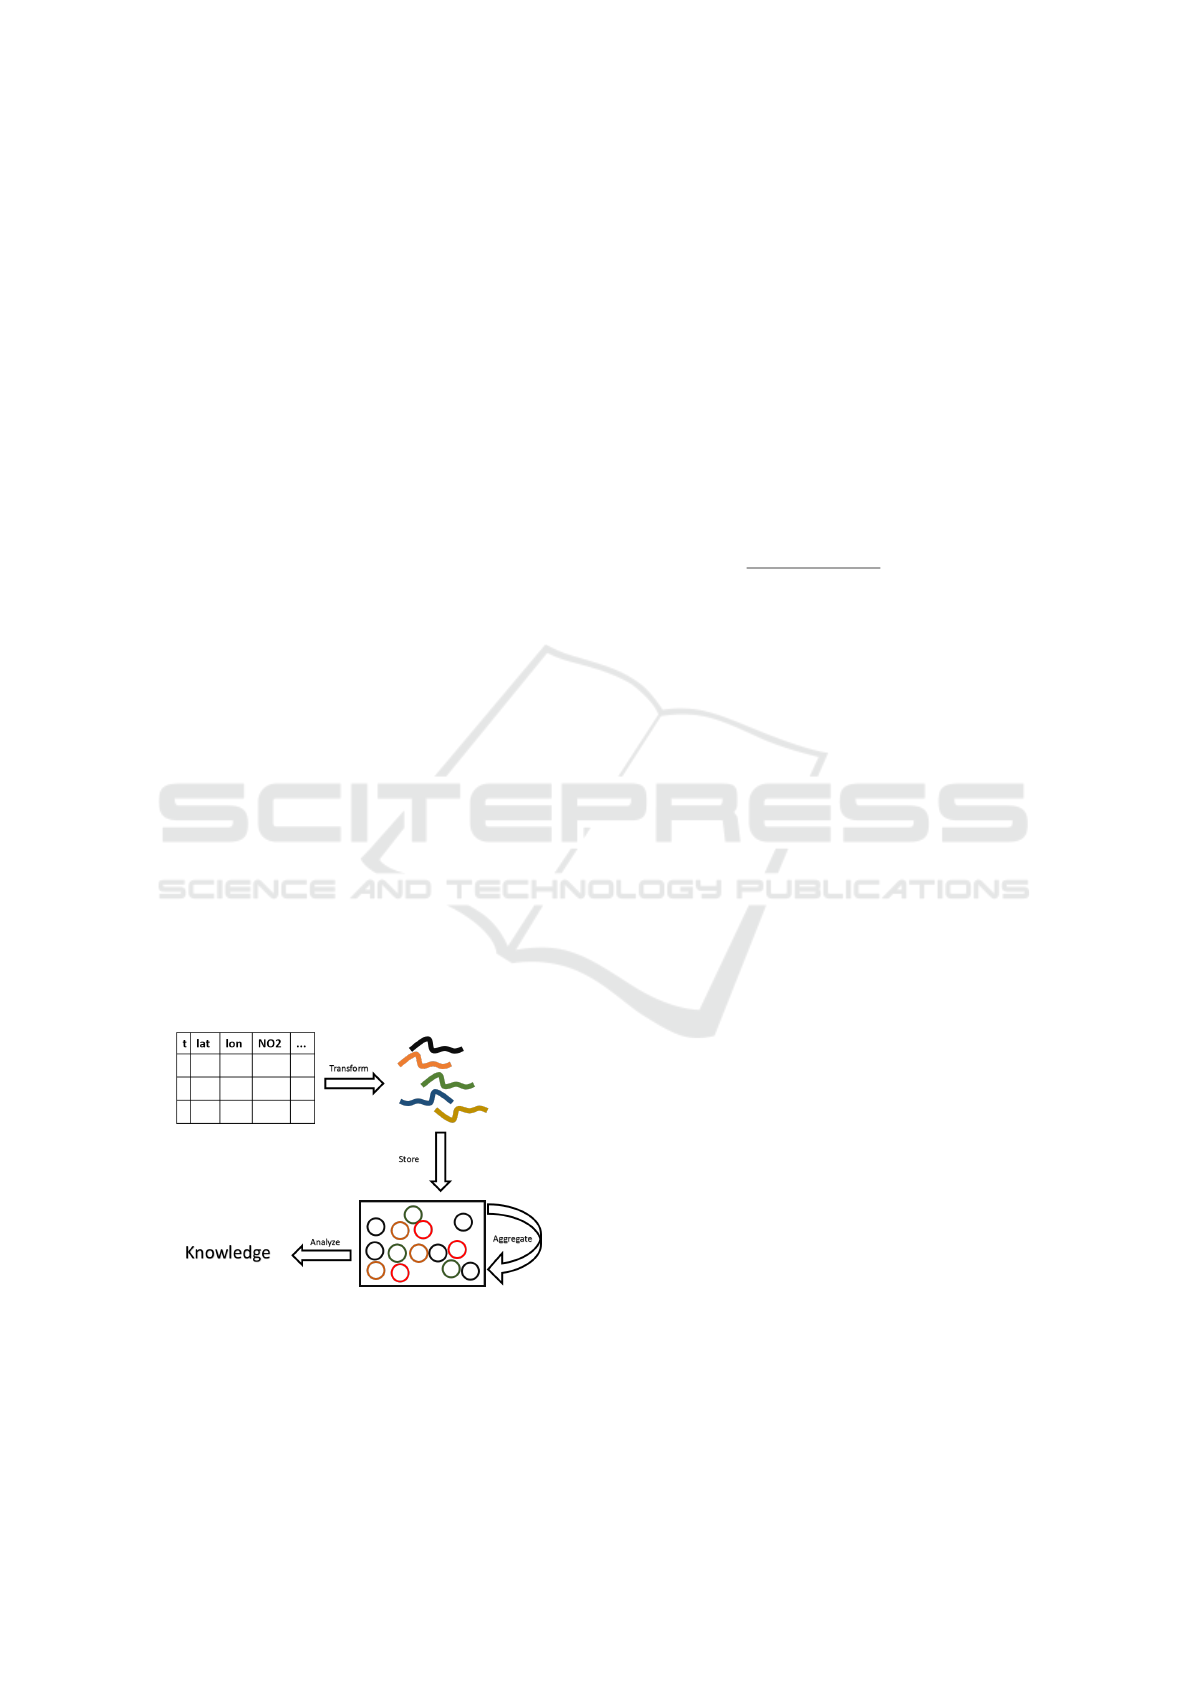
matory, or predictive objectives. Figure 1 illustrates
an overview of the entire process.
Figure 1: The framework’s data flow.
2.2 Function Generation
Approximating discrete data by functions is achieved
through curve fitting techniques. Let (x
i
,y
i
) be a
group of observed discrete data points for a given
physical process where x represents a given contin-
uum and y represents a certain variable. Let f be the
function that is supposed to approximate the discrete
data and be a mapping from x to y. We set f to be a
flexible core function with tweakable parameters vec-
tor C. Hence we end up having:
Y = f (C,X)+ε
ε
ε
Where Y is a vector of all the observed variables, X
the vector of the continuum values corresponding to
each element in Y, and ε
ε
ε is the error between f and
the original data. To approximate the data the error
should be decreased by choosing the right C. C can
be obtained by solving the differential equation:
d(Y − f (C, X))
2
dC
= 0
This difference represents the sum of the distance be-
tween each original data point and its corresponding
approximated data points.The derivation is because a
function admits its extreme (maximum or minimum)
when its derivative is equal to zero, but since the dif-
ference in our case is open-ended ( it doesn’t have a
maximum) then it certain that it admits a minimum
when the derivative is equal to zero.
One of the most used models for approximating
data is linear expansion where the parametrized func-
tion f is set to be an aggregation of well defined basis
functions each is multiplied by a coefficient and these
coefficients are the tweakable parameters:
f (C,x) =
m
∑
i=1
c
i
B
i
(x) = c
1
B
1
(x) + ... + c
m
B
m
(x) (1)
In which B
1
,B
2
,...,B
m
are the basis functions and
c
1
,c
2
,..,c
m
are the coefficients. One of the heavy used
basis system for periodic data is Fourier Basis:
f (x) = c
0
+ c
1
sin(ωx) + c
2
cos(ωx) + c
3
sin(2ωx)
+ c
4
cos(2ωx) + ...
(2)
Where c
0
,c
1
,... are the coefficients, the ba-
sis functions B
0
= 1, B
2r(even)
= cos(rωx), and
B
2r+1(odd)
= sin(rωx). ω is a parameter that deter-
mines the period of the fitted function 2π/ω. Another
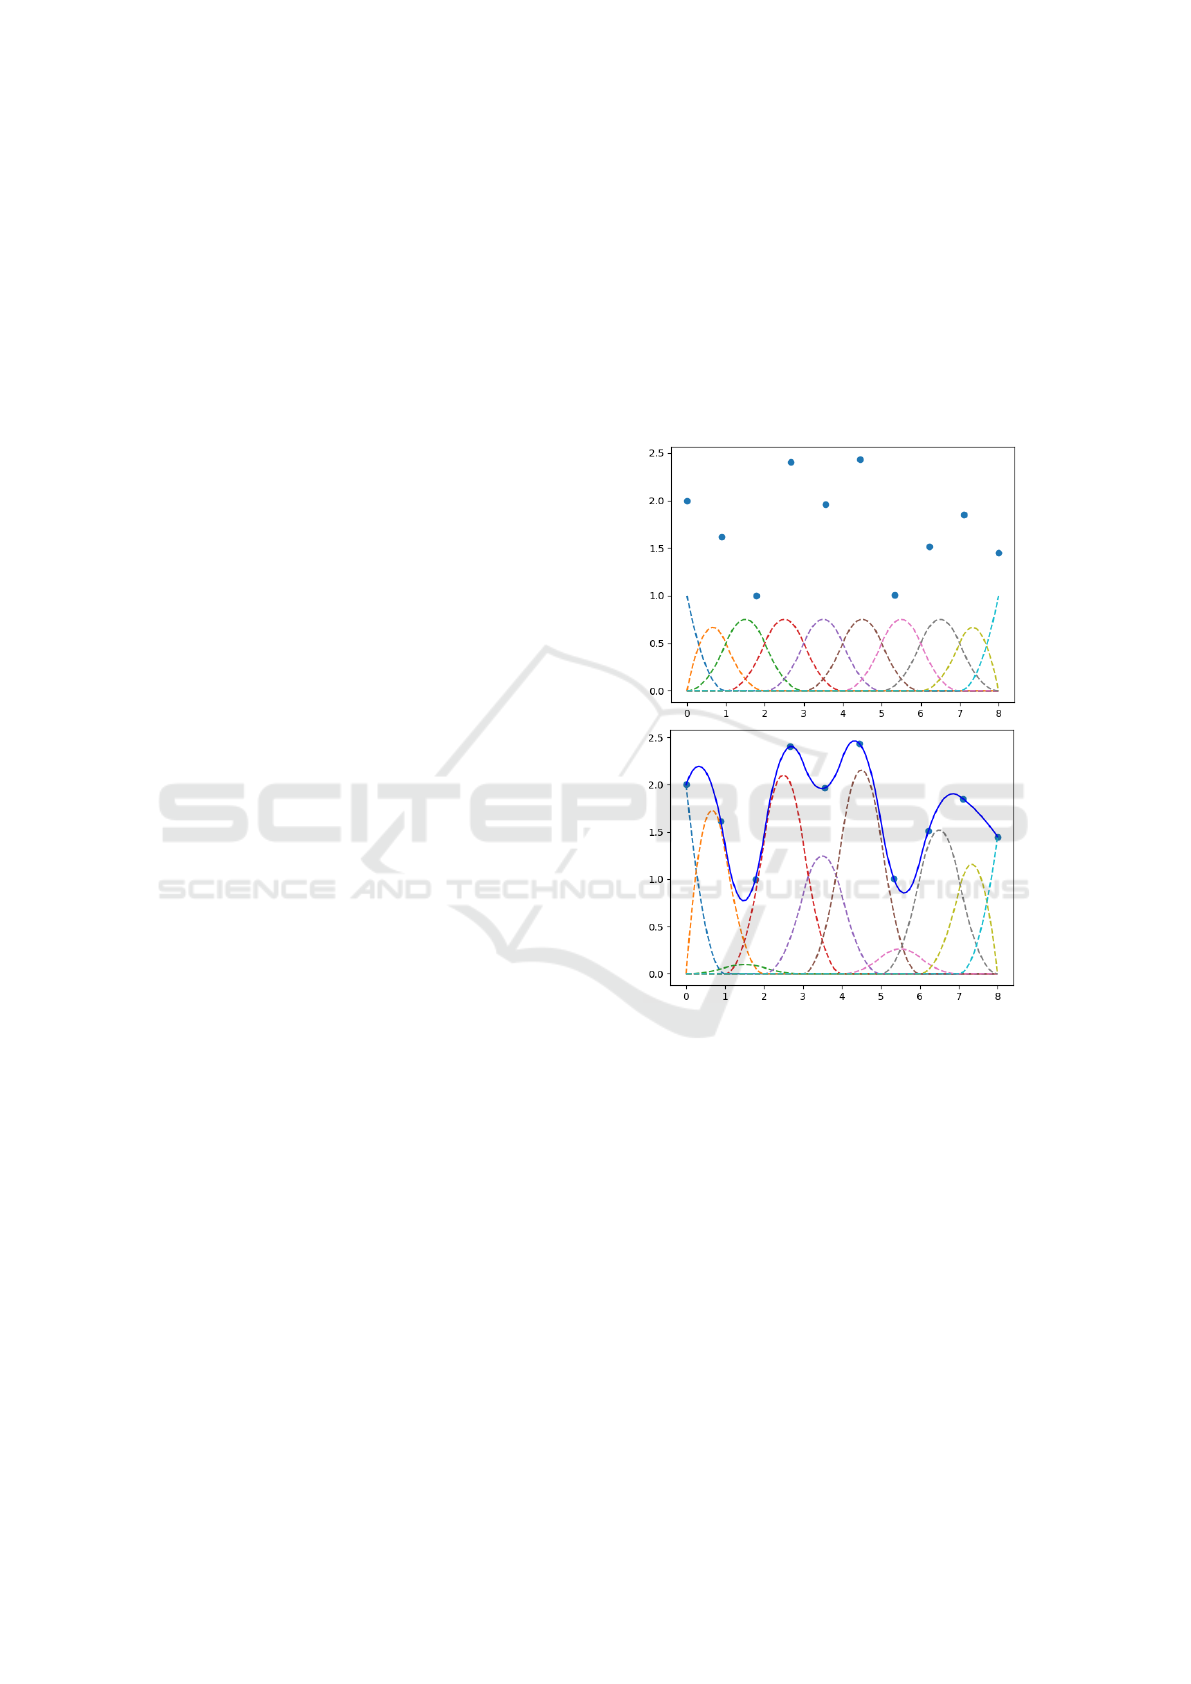
widely used basis is Basis Spline (B-spline). Figure 2
shows the initial set of the Spline basis functions that
is set to approximate the shown data points. After
tweaking the functions with the suitable coefficients
we can see how the summation of them ( the non-
dashed curve in blue ) approximates the data points.
This approach is not only applicable for one-
dimensional interpolation but also for multidimen-
sional interpolation. One important use case is spa-
tial interpolation where a phenomenon is monitored
Towards Rich Sensor Data Representation
291
against space variation i.e. with respect to location
measured using GPS units. In this interpolation case,
there are two independent variables which are geo-
graphical latitude and longitude and the resulting in-
terpolated artifact will be a 2D surface.
The framework we propose can handle such use
case by generalizing linear expansion, particularly
splines, into higher dimensions. Thin Plate Spline
(TPS) is a linear expansion function suitable for spa-
tial and multidimensional interpolation. Equation 3
below represents the TPS function. TPS works by
finding first a 2D plane that captures the data global
trend and then adding 2D splines around the measured
data to formulate the local trend.
f (x,y) = a
1
+ a
2
x + a
3
y +
N
∑
j=1
λ
j
R(r,r
j
) (3)
Where a
1
,a
2
,a
3
are the parameters that defines
the global trend.
∑
N
j=1
λ
j
R(r,r
j
) represents the lo-
cal variations where N is the number of measured
data points, R(r, r
j
) is a basis function, λ
1
,λ
2
,...,λ
j
are the to be found coefficients of the basis functions.
Similar to one dimensional interpolation a
1
,a
2
,a
3
and
λ
1
,λ
2
,...,λ
j
can be obtained by solving a certain dif-
ferential equation that fit the function to the data while
imposing a smoothing constraint.
2.3 Function Storage
After generating the functions the next step is to store
them. In our proposal, we will borrow and extend
the idea of FunctionsDB. FunctionsDB is a func-
tion database which permits the storage and retrieval
of continuous functions using a SQL-like declarative
language with the main goal of exploiting the con-
tinuous nature of functions. FunctionDBs query pro-
cessor applies queries directly to the algebraic repre-
sentation of the functions using algebraic operations.
The main enabler in FunctionDB is the function ta-
ble which is a data model that stores function in their
algebraic form. The function table is a normal rela-
tional table where the columns are the parameters of
the regressed or fitted functions along with predicates
(constraints). To emphasize, if a group of data points
that belongs to a certain interval of the independent
variable [p1, p2] is fitted to a 2
nd
degree polynomial
ax2 + bx + c, the result will be stored in a one tuple
in the form of (p1, p2, a, b, c) where the first
two columns represent the constraint where the func-
tion is defined and the others represent the function.
However, the authors of functionDB confined func-
tion representation to polynomials only and the pro-
posed table cannot represent different representations
such as Fourier and Splines without adding a flag that
can specify the type of the stored function making
things less open to new models. In our proposal, we
are willing to store functions in a less structured and
more flexible form where functions are stored as al-
gebraic statements along with the residuals (the vec-
tor of the difference between the original values and
the fitted function values) and other indices such as
the Sum of Squared Errors (SSE) and the Root-Mean
Squared Error (RMSE) along with the predicates.
Figure 2: Approximating discrete data using Basis Spline,
before and after multiplying the basis functions with the
corresponding coefficients.
2.4 High Level Query Language
FunctionDB creates, retrieve, and manipulate func-
tions by introducing a set of SQL commands that
wraps regression logic and algebraic operations.
However, the authors of this novel database confined
the regressed functions to only linear and polynomial
ones. We are willing to extend it to cover the usu-
ally used functions for interpolating discrete data such
as B-spline, Fourier, and others. For convenience,
we will point to this language as Functional-SQL or
FSQL.
GISTAM 2018 - 4th International Conference on Geographical Information Systems Theory, Applications and Management
292

2.4.1 Function Creation
FSQL’s function creation logic is a wrapper for inter-
polation and smoothing algorithms used by statisti-
cians to approximate functions to discrete data points.
The listing below introduces the set of commands that
gives a taste of how functional views of discrete data
can be created.
CREATE VIEW NO2Time
AS FIT NO2 OVER Time
USING BASIS Fourier(...)
USING ALGO LSSE(...)
USING PARTITION SplitEqually(...)
TRAINING DATA SELECT * FROM Somedata
In order to generate a functional view of some
data, this data should be already existing in a
relational form or in structured files. In example
x this data should include NO2 and Time as two
attributes or columns and it is specified by the key-
word TRAINING DATA CREATE VIEW NO2Time
will create a view of the name NO2Time.
AS FIT NO2 OVER Time specifies the dependent and
independent variable NO2 and Time.USING BASIS
specifies the basis that should be used here Fourier is
chosen that should take arguments such as the number
of basis functions and the period. USING ALGO speci-
fies the algorithm that should be used to approximate
the discrete data. It is mentioned in x that the coef-
ficients that best minimizes the difference between
the original data and the fitting function can be found
by solving a differential equation that expresses
the Least Sum of Squared Error (LSSE). However
multiple algorithms can be used such as weighted
LSSE that increases or decreases the importance
of errors along the fitting interval, penalized LSSE
can also be used to force a penalty over the fitted
function curvature. USING PARTITION specifies
how to segment the data. It is better to fit multiple
functions over large data sets as this achieves a better
fit with increased flexibility. SplitEqually(...)
divides the data set into equal parts of a given size
and then a function will be fitted on each part.
2.4.2 Function Retrieval
Although querying a database to obtain continuous
functions is useful, most of the time the user will need
to discretize the results after obtaining the continuous
function in a read query. That is why FSQL, which
is based on the FunctionDB notion, will support both
types of intentions( continuous or discrete ). And this
will not only satisfy the user’s requirements but will
also permit a database of functions to be integrable
with the current relational databases.
This distinction is achieved by introducing the
Grid keyword. The listings below emphasis this
point.
SELECT NO2 FROM NO2Time
WHERE Time = "12-6-2017 17:30:32"
SELECT NO2 FROM NO2Time
WHERE Time > "12-6-2017 17:30:32"
and Time < "15-6-2017 12:30:00"
SELECT NO2 FROM NO2Time
WHERE Time > "12-6-2017 17:30:32"
and Time < "15-6-2017 12:30:00"
GRID Time 1H
The first listing showcase a normal point-wise
query where the user is interested in the value of NO2
at one point of time and it can be achieved under
the hood by substituting the given value in the cor-
responding functional view of NO2Time. On the sec-
ond hand, the second listing will return the algebraic
form of the existing function between the queried
time. Finally the third listing showcase the GRID key-
word. In this example, the returned value will be a
table of columns Time and NO2 where the time col-
umn is projected on an hourly basis.
2.4.3 Function Aggregation
FSQL will also support aggregation clauses similar to
the ones in normal databases. However and because
of the continuous nature of the functions traditional
aggregates are not possible. The aggregation opera-
tions in FunctionDB are applied on infinite bounded
intervals where the traditional aggregates aren’t suit-
able. For example, there is no meaning in having the
aggregate COUNT, which is usually used to return the
number of rows with certain conditions specified by
WHERE clause, over a continuous function. It doesn’t
make sense to query how many points of NO2 are
above a certain threshold because they are either zero
or infinite. However, you can quantify this by sub-
stituting the COUNT clause with the continuous analo-
gous VOLUME. If we want to quantify how many NO2
data we have in a certain table it will be analogous to
the size of the time interval where the NO2 data is col-
lected in other words the VOLUME of a variable that
depends on one independent variable is the interval
length. While if this variable depends on two inde-
pendent variables the VOLUME will be the area that is
covered by these two variables and so on. The same
can be applied to the sum SUM aggregate. The contin-
uous SUM is the integral of the queried variable along
the intervals where the conditional clause is applied.
For more information about this topic, the reader is
referred to the FunctionDB paper. The following list-
Towards Rich Sensor Data Representation
293

ing provides an example where the SUM aggregate is
used.
SELECT SUM(NO2) FROM NO2Time
WHERE NO2 < 10 and Time < 20-8-2017
It is noteworthy to mention that all the retrieval
and aggregation commands are to be computed in
a symbolic manner wherever possible. We mean
by symbolic, the usage of mathematical calculations
rather numerical ones. For example, the retrieval of a
measurement below a certain threshold, as in the pre-
vious listing WHERE NO2 < 10, is not computed by
re-sampling the fitted function and then filtering it,
but by solving the inequality when the difference be-
tween the function and the threshold is below zero.
The authors of functionDB proved empirically that
using symbolic computation have performed better in
terms of time and resource utilization than using nu-
merical computation. This is one of the reasons that
support our approach.
2.5 Functional Analysis
Functional Data Analysis (FDA) is a field of statis-
tics where functions are analyzed to explore, confirm,
or predict certain knowledge statements. Unlike the
conventional data mining techniques that are applied
over vectors of discrete data, FDA works only with
functions; functions are the atomic data structure in
FDA. FDA is widely used for time series, spatial data,
and spatiotemporal data. One of our frameworks main
goals is to fasten and ease the transition from asyn-
chronous discrete data into functional views and fi-
nally into knowledge. For that, one important con-
tribution of our framework is to integrate functional
analysis operations with the high-level FSQL. In our
framework, the set of aggregates in FSQL are ex-
tended to support functional analysis operations. The
number of functional analysis operations is being in-
creased through the years by the continuous research
efforts in the field; this shows the importance of our
framework to be a platform that can incubate such ef-
forts. However, there is a group of basic and widely
used operations that are essential in any functional
analysis application.
2.5.1 Basic Operations
Functional data analysis usually starts by applying ba-
sic exploratory operations that permits to understand
the data more. Starting with the very basic statis-
tical operations such as mean, variance, covariance,
and correlation of a group of functional observations
and not ending with different transformation opera-
tions such as derivation, and registration. Derivation
helps in seeing the rate of change in the data which
gives the analyst a deeper sense of the data. Regis-
tration is the process of aligning different functional
observations with respect to function features such as
valleys and peaks; this leads to a better representation
of the data. The following listing showcase how some
of these aggregates might be used.
CREATE VIEW DerivativeMeanABCDE AS
SELECT MEAN(DERIVE(NO2TimeA, NO2TimeB,
NO2TimeC, NO2TimeD, NO2TimeE))
WHERE Time > 10-09-2017
This query creates a new continuous functional view
that represents the mean of the derivative of 5 differ-
ent NO2 observations after a certain time.
2.5.2 Advanced Operations
Advanced functional analysis operations include
Functional Principle Component Analysis (FPCA),
Functional regression and many others used in the
classification, clustering, and prediction of functional
data. FPCA is the functional version of the Princi-
ple Component Analysis (PCA) tool which is a well-
known dimensionality reduction tool used in data
mining. With FPCA functions can be projected over a
group of principal components that represents the sys-
tem where the variance between the functions projec-
tion is maximized. This type of operations might get
really complex and divers that is why we didnt con-
sider integrating them into FSQL aggregates. How-
ever, we are willing to build an external module that
acts over the algebraic representation of functions.
This module should be extensible so that researchers
can integrate their own developed algorithms and op-
erations.
3 RELEVANCE
DEMONSTRATION
Polluscope is a multidisciplinary project that aims to
measure individual’s air pollution exposure and re-
late it to health using opportunistic mobile monitor-
ing. One prior task was to asset different air pollutants
sensors. The quality assessment was done through a
novel algorithm introduced in (Fishbain et al., 2017)
that compares sensor time series with an accurate ref-
erence time series. The problem was that the sam-
pling rate of each time series was different and the al-
gorithm couldn’t be applied. To overcome this prob-
lem we developed an R language library that wraps in-
terpolation logic provided by the functional data anal-
ysis library of R fda.R (Ramsay et al., 2017). The de-
veloped library fits two functions one for the sensor
GISTAM 2018 - 4th International Conference on Geographical Information Systems Theory, Applications and Management
294

time series and one for the reference time series and
then re-sample both according to a common sampling
rate. This problem represents a relevance demonstra-
tion for one side of our work as it shows how interpo-
lation is a recurring requirement in mobile monitoring
projects.
4 DISCUSSION
Although this framework was inspired by the need to
resolve the asynchronous, noisy and multivariate na-
ture of data generated in opportunistic mobile sensing
applications, the benefits of such framework can be
generalized to cover a wider area of applications.
• Semi-automation of data preprocessing: curve fit-
ting is usually used to resolve the noise in data
through smoothing, impute the missing values and
normalize asynchronous data through interpola-
tion. Our framework inherits these actions by us-
ing functions as the atomic data structure rather
than vectors. However, curve fitting is not al-
ways straightforward and depends on the data in
hand; thus the framework should provide a bal-
ance between wrapping the fitting logic by high-
level queries and giving more control over the
logic to the user. This way the user can choose
what level of control he needs as the nature of data
diverse.
• Easy and Familiar Query Language: SQL is a
very known standard to the level it became ubiq-
uitous in data and computer scientists daily work.
Extending this language and deploying it in our
framework permits every one to utilize curve fit-
ting and functional analysis power without know-
ing the complex logic underhood. Moreover using
SQL as a wrapper for function storage, retrieval,
and aggregation permits the framework to be in-
tegrable with existing relational databases. This
was integrity was an impactful contribution by
FunctionDB and our framework inherits it.
• Raw Data Abstraction: One of the hidden po-
tentials of our framework is giving semantics to
raw data. When you represent large data sets by
a group of relations ( functions ) between dif-
ferent variables, you implicitly give semantics to
data and rise their abstraction level. The stored
functions can be even exported in a suitable data
formate and then be integrated into knowledge
bases where reasoners can be used to link these
functions with different aspects of the internet of
Things (IoT) semantics.
5 CONCLUSION
To overcome the complexity of asynchronous and
noisy spatiotemporal multivariate data generated from
opportunistic mobile monitoring we have introduced
a high-level framework that can ease the entire pre-
processing and analysis process. The Framework is
based on four cornerstones: curve fitting, algebraic
storage model, high-level query language, and an
analysis module. The introduced model is found to
be useful not only in opportunistic sensing applica-
tions but in a wide set of applications that depends
on functional analysis and deals with spatiotemporal
data. However, the proposed framework might end
to be complex under the hood and will raise multi-
ple challenges in terms of architectural design, robust-
ness, and scalability that should be solved.
ACKNOWLEDGMENT
This work is supported by the grant ANR-15-CE22-
0018 POLLUSCOPE of the French National Re-
search Agency (ANR).
REFERENCES
Fishbain, B. et al. (2017). An evaluation tool kit of air qual-
ity micro-sensing units. Science of The Total Environ-
ment, 575:639 – 648.
Ramsay, J. and Silverman, B. (2013). Functional Data
Analysis. Springer Series in Statistics. Springer New
York.
Ramsay, J. O., Wickham, H., Graves, S., and Hooker, G.
(2017). fda: Functional Data Analysis. R package
version 2.4.7.
Thiagarajan, A. and Madden, S. (2008). Querying continu-
ous functions in a database system. In Proceedings of
the 2008 ACM SIGMOD International Conference on
Management of Data, pages 791–804, New York, NY,
USA. ACM.
Van Den Bossche, J. et al. (2016). Opportunistic mobile air
pollution monitoring: A case study with city wardens
in Antwerp.
Towards Rich Sensor Data Representation
295
