
Performance and Cost Analysis Between On-Demand and Preemptive
Virtual Machines
Breno G. S. Costa, Marco Antonio Sousa Reis, Alet
´
eia P. F. Ara
´
ujo and Priscila Solis
Department of Computer Science, University of Brasilia, Bras
´
ılia/DF, Brazil
Keywords:
Cloud Computing, Transient Server, Performance Analysis, Preemptive Machines.
Abstract:
A few years ago, Amazon Web Services introduced spot instances, transient servers that can be contracted
at a significant discount over regular price, but whose availability depends on cloud provider criteria and the
instance can be revoked at any time. Google Cloud Platform offers preemptive instances, transient servers that
have similar behavior and discount level to spot instances. Both providers advertise that their transient servers
have the same performance level as servers contracted on-demand. Even with the possibility of revocation
at the provider’s discretion, some applications can benefit from the low prices charged by these servers. But
the measured performance of both models, transient and on-demand, must be similar, and the applications
must survive occasional or mass server revoking. This work compares the performance and costs of transient
and on-demand servers from both providers. Results show there is no significant difference in performance
measured, but there is real cost advantage using transient servers. On Amazon Web Services a MapReduce
cluster composed of transient servers achieved a 68% discount when compared to the same cluster based on
on-demand servers. On Google Cloud Platform, the discount achieved was 26% but it can be bigger when the
clusters are larger.
1 INTRODUCTION
Cloud providers have introduced a new class of
servers, called transient servers, which they can uni-
laterally revoke at any time (Singh et al., 2014).
Transient servers increase the utilization of a cloud
provider’s infrastructure while enabling it to retrieve
resources at any time to lease them to higher priority
users.
Due to their preemptive nature, transient servers
are not suitable for running interactive systems such
as web services, or any system that does not toler-
ate downtime caused by server revocations. Cloud
providers typically provide a brief early warning be-
fore revoking a transient server to allow the customer
to shut it down properly. Batch-oriented interrupt-
tolerant applications are particularly suitable for tran-
sient servers, as they can tolerate longer completion
times caused by occasional inactivity. A common sce-
nario is to use tens or hundreds of transient servers to
run highly CPU-intensive or data-intensive systems at
lower costs (compared to regular server prices con-
tracted on-demand).
Different cloud providers have different pricing
models for transient servers. The Google Cloud Plat-
form (GCP) transient servers, named preemptive in-
stances (Google, 2017), have a fixed discount of about
80%, a maximum lifetime of 24 hours (with the possi-
bility of preemption within lifetime) and with an alert
of revocation of only 30 seconds.
Microsoft Azure recently announced that its tran-
sient server offering, called Low-priority virtual ma-
chine (VM), changed status from public preview to
general availability. These VMs can only be used
within a specific service called Batch (Microsoft,
2017). Their pricing structure is similar to GCP, with
a fixed price and a discount of up to 80%. The Batch
service re-queues a task when a low-priority VM that
is executing the task is revoked. According to the an-
nouncement, preview pricing will be in effect for a
few months, but it will move to regional pricing —
the same as on-demand VMs — and this might cause
a slight increase in pricing, depending on the region.
In contrast, Amazon Web Services (AWS) spot in-
stances (SI) (AWS, 2017c) offer a variable discount.
The price of SIs varies continuously based on mar-
ket supply and demand for each type of server. The
customer specifies a maximum price (a bid) that he
is willing to pay when ordering SIs. AWS, based on
the proposals submitted and following market criteria,
G. S. Costa, B., Reis, M., P. F. Araújo, A. and Solis, P.
Performance and Cost Analysis Between On-Demand and Preemptive Virtual Machines.
DOI: 10.5220/0006709001690178
In Proceedings of the 8th International Conference on Cloud Computing and Services Science (CLOSER 2018), pages 169-178
ISBN: 978-989-758-295-0
Copyright
c
2019 by SCITEPRESS – Science and Technology Publications, Lda. All rights reserved
169

determines a market price for the server (Agmon Ben-
Yehuda et al., 2013). If the market price increases and
stays above the bid, the server will be revoked, but
only after the two-minute notice period. While the SI
price remains below the bid, the SI remains available
and the customer will pay only the market price, even
if his bid is higher.
Figure 1 shows the market price variation, in a
one month period, of an M4.2xlarge type SI on the
us-east-1e zone. Each availability zone is a different
market and prices can be different. In the time frame,
the SI price reached the on-demand price (US$ 0.40)
less than 10 times and for short periods.
Due to the high probability of changing prices and
even the behavior of their transient servers in the short
term, Microsoft Azure Low-priority VMs will be ex-
cluded from this analysis, but they will be included as
future work as soon as the offer becomes stabilized.
1.1 Availability of Transient Servers
The availability of transient servers (in terms of aver-
age revocation time) can also vary significantly across
server configurations and on the basis of changing
market conditions. Unfortunately, cloud platforms do
not directly expose the availability statistics of tran-
sient servers, requiring users to infer them indirectly,
for example, through price history. Thus, it is chal-
lenging for a cloud system to select the most appro-
priate server configuration based on historical price
or availability data to meet its needs. Recent research
suggests that mitigating the risk of revocation requires
a parallelized system to diversify its resource needs
across various types of transient servers, further com-
plicating decision making (Sharma et al., 2016).
The problem is exacerbated by the large number
of transient server choices available from providers:
there are over 2500 SI options in AWS Elastic Cloud
Computing (EC2) and more than 300 GCP preemp-
tive instances. This is because each availability zone
has its own market value calculation for each avail-
able virtual machine configuration.
According to (Sharma et al., 2017), choosing a
server configuration based only on price can pro-
duce sub-optimal results. The authors cite an exam-
ple where server configurations with very low prices
can also see greater market demand and consequently
higher price volatility and more revocations. Frequent
revocations generate additional verification, check-
pointing, and system recovery efforts. Instead, they
suggest that choosing a slightly more expensive server
configuration and having a lower revocation rate can
produce lower overall costs.
Due to the challenges listed, cloud providers such
as AWS have begun offering server selection tools.
Amazon SpotFleet (AWS, 2015a) automatically re-
places revoked servers. However, SpotFleet has a
limited choice in terms of the combinations of server
configurations that it offers and does not solve some
of the challenges presented. Another tool, Amazon
Spot Bid Advisor (AWS, 2015b), can help users se-
lect servers based on price, but exposes only super-
ficial volatility information such as low, medium, or
high categorization.
An important consideration is that if transient
server performance was lower than the on-demand
server, and adding up the additional complexity of
dealing with revocations, the large discounts offered
by the providers would not be worthwhile. There-
fore, this study measures the performance of transient
servers using benchmarking software and compares
them to on-demand servers to verify whether the cost
decrease advertised by cloud providers is also accom-
panied by a performance decrease. In addition, a sce-
nario in which the use of a transient server is viable
will be implemented and the costs of execution in the
two server classes will be compared on both providers
that offer them.
The remainder of this article is divided into six
sections. Section 2 presents some related work. Sec-
tion 3 describes the experiments environment. Sec-
tion 4 describes the planning and the results of the ex-
periments. Section 5 performs an analysis of the per-
formance experiments. Section 6 presents a cost com-
parison of a MapReduce workload running on both
classes of servers, and in Section 7 conclusion and fu-
ture work are presented.
2 RELATED WORK
There are, in literature, several studies regarding spot
instances. Many of them try to predict SI prices and
find an optimal bid on the the spot market. The strate-
gies undertaken by these researches are diverse. Time
series forecasting is used by (Chhetri et al., 2017),
whose results, using three specific metrics, show that
successful estimation of bid prices in AWS spot mar-
kets is an implicit function of seasonal components
and extreme spikes in the spot price history. Another
study (Khandelwal et al., 2017) uses Regression Ran-
dom Forests (RRFs) to predict spot prices. The au-
thors use a one year trace of spot market prices and
compare the results achieved by RRFs with existing
non-parametric machine learning models. The paper
reveal that RRF-based forecast accuracy outperforms
other models.
In (Wolski and Brevik, 2016) a method is pro-
CLOSER 2018 - 8th International Conference on Cloud Computing and Services Science
170
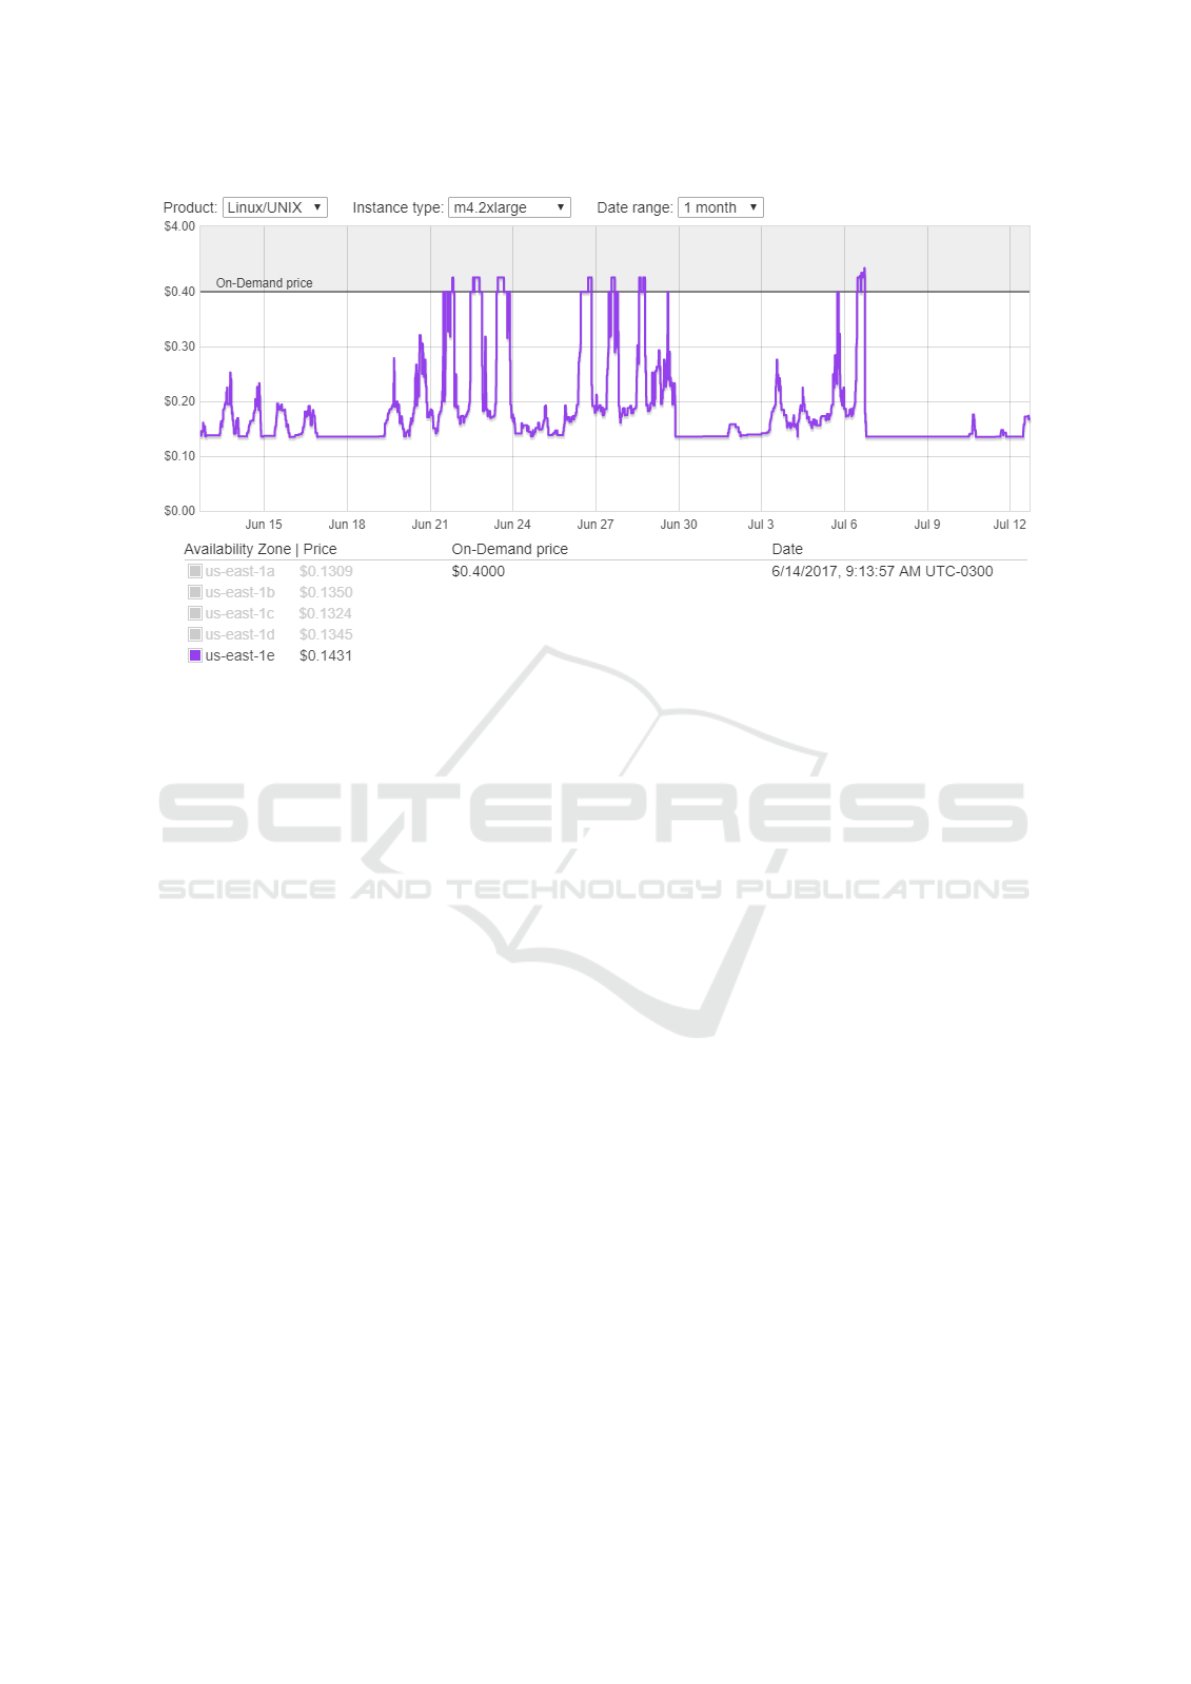
Figure 1: AWS SI price history for a one-month period in 2017.
posed to determine the probabilistic availability assur-
ance for SIs: DrAFTS, acronym of Durability Agree-
ments From Time Series. Thus, a prediction algo-
rithm has been created for bid prices that will gain
a certain SI in the AWS market. The prototype also
determines the likelihood of how long these prices re-
main the same. The prediction, in this case, shows a
combination of the maximum price of an SI and the
time that this value guarantees the termination of the
VM, considering that the termination is caused by the
increase of bid prices.
To ensure predictability, DrAFTS (Wolski and
Brevik, 2016) runs regression tests with the price his-
tory of each instance type and stores the predictions.
Each time a new prediction is generated, the method
selects a random sample of prices in the history and
re-runs the DrAFTS algorithm. The fraction of cor-
rect predictions is reported with the probability of
success.
Other studies consider also the workload that is
running on the cloud to suggest a proper amount of
resources in order to guarantee its completion. In
(Huang et al., 2013), they proposed a tool that auto-
matically profiles the application, builds a model to
predict its performance, and infers a proper cluster
size that can finish the job within its deadline while
minimizing the total cost. Based on these parameters,
the tool also chooses between on-demand or spot in-
stances. In the work of (Sabyasachi et al., 2017), the
proposal is about a framework that allows users to bid
different prices depending on their perceived urgency
and nature of the running job. It allows them to nego-
tiate the current bid price in a way that guarantees the
timely completion of their jobs.
The work of (Chohan et al., 2010) uses SIs as
the acceleration mechanism for MapReduce applica-
tions executed in benchmarks presented in the arti-
cle. However, the unexpected termination of SIs can
have adverse effects on application execution time,
and could increase the final cost. The research then
shows techniques that help mitigate these effects.
According to the authors of (Chohan et al., 2010),
an SI is suitable for batch processing of MapReduce
because of its fault tolerance characteristic. When a
VM becomes unavailable, the internal mechanism of
MapReduce automatically looks for another VM to
complete the task. With this, the research concluded
that the use of SIs accelerates processing and causes
the consequent cost decrease.
In the experiments of (Chohan et al., 2010) four
on-demand machines and one SI were used for ac-
celeration. At some loads this acceleration reaches
200%, while the cost is only increased by 42%. How-
ever, the experiments conducted showed that in cer-
tain cases, failures negatively impacted processing by
up to 27%, since SIs are less reliable than on-demand
VMs.
This work differs from the others by compar-
ing, in two cloud providers, the performance of on-
demand VMs and transient ones. CPU, Input and
Output (I/O), and network performance metrics will
be used to identify whether performance is compati-
Performance and Cost Analysis Between On-Demand and Preemptive Virtual Machines
171

ble, or whether the price decrease of the transient VM
also implies a decrease in performance. The chosen
providers were AWS and GCP, since these providers
offer both VM options and they are among the top
three public cloud providers in the Gartner Magic
Quadrant (Gartner, 2016). In addition to performance
benchmarking, the cost of an execution scenario will
be measured and compared for both VM classes from
both providers.
3 TESTBEDS
The purpose of the study is to compare the perfor-
mance of on-demand VMs with the transient versions
of these same VMs from a public cloud provider. The
on-demand version meets one of the cloud computing
features defined by NIST (Mell et al., 2011), which
is the perception that there is an infinite supply of re-
sources. That is, it will always be possible to get ad-
ditional on-demand resources at any time, from the
point of view of a single customer.
The transient VMs, on the other hand, have di-
verse availability. If there are no idle resources in a
given provider’s availability zone, one may not get
transient VMs while this scenario remains. And even
when resources are available and they are in use by a
customer, the provider can revoke them at their dis-
cretion. The counterpart to this decrease in availabil-
ity is the cost, which is much lower in the model with
possibility of preemption, and can reach up to 90%
discount in relation to the on-demand price (AWS,
2017c).
We analyze the performance relationship between
these two models of infrastructure as a service and
verify if the lower price means, in addition to lower
availability, lower performance according to three
metrics: quantity of floating point operations per
second (GFLOPS) that each vCPU supports, I/O
throughput rate and network throughput. In addi-
tion, the costs of one workload that is transient-server-
friendly will be compared, being executed in the two
scenarios: one with the use of on-demand VMs and
other with the use of transient VMs.
In public cloud providers, different availability
zones represent data centers located in different ge-
ographic locations and possibly with a different in-
frastructure as well. For this study, before running
the benchmarking software, both classes of VMs were
initiated on the same availability zone and with the
same configuration (cpu model, disk type).
Providers also offer different families of VMs and
some of them are specialized on a computational
function: processing, Input/Output (I/O), and net-
Table 1: AWS VM Configuration.
Name
Qty
vCPUs
VM Type
Storage
(GB)
Zone
On-Dem SML 1 on-demand 50 sa-east-1a
On-Dem MED 2 on-demand 50 sa-east-1a
On-Dem BIG 4 on-demand 50 sa-east-1a
SPOT SML 1 transient 50 sa-east-1a
SPOT MED 2 transient 50 sa-east-1a
SPOT BIG 4 transient 50 sa-east-1a
Table 2: GCP VM Configuration.
Name
Qty
vCPUs
VM Type
Storage
(GB)
Zone
On-Dem SML 1 on-demand 50 us-central1-a
On-Dem MED 2 on-demand 50 us-central1-a
On-Dem BIG 4 on-demand 50 us-central1-a
PREEM SML 1 transient 50 us-central1-a
PREEM MED 2 transient 50 us-central1-a
PREEM BIG 4 transient 50 us-central1-a
working, for instance. For the sake of performance
comparison, the choice was, on each provider, the
general-purpose family. This means all VMs used
on performance experiments have a balance between
the computational functions mentioned. On AWS, M-
family was the choice and on GCP, n1-standard fam-
ily. On cost experiments, the VM families that are ap-
propriate for the specific workload being tested were
used.
For comparison purposes, the experiment ran on
three VMs with different amounts of vCPUs, in or-
der to increase the evaluation sample and, therefore,
to achieve more accurate results. The most powerful
VM used in the experiment was the one with 4 vC-
PUs, referenced in the rest of this work as BIG. The
other VMs have lower amounts of vCPUs and will
be referenced as MED (for medium) and SML (for
small). For each size, an on-demand VM (referenced
as On-Dem on both providers) and a transient one
(referenced as SPOT on AWS and PREEM on GCP)
will be created, according to the tables 1 and 2. The
AWS zone where the VMs were created was sa-east-
1a and GCP availability zone used was us-central1-a.
For storage, Solid State Drive (SSD) options were
used. The providers allows the user to choose be-
tween SSD and Hard Disk Drive (HDD) based stor-
age. The SSD has higher throughput in terms of I/O
operations per second (IOPS) and data transfers, and
hence higher cost per GB of allocated space.
4 PLANNING
The study of (Coutinho et al., 2012) compared the
results of CPU performance measurements among
some available benchmark software and selected Lin-
CLOSER 2018 - 8th International Conference on Cloud Computing and Services Science
172
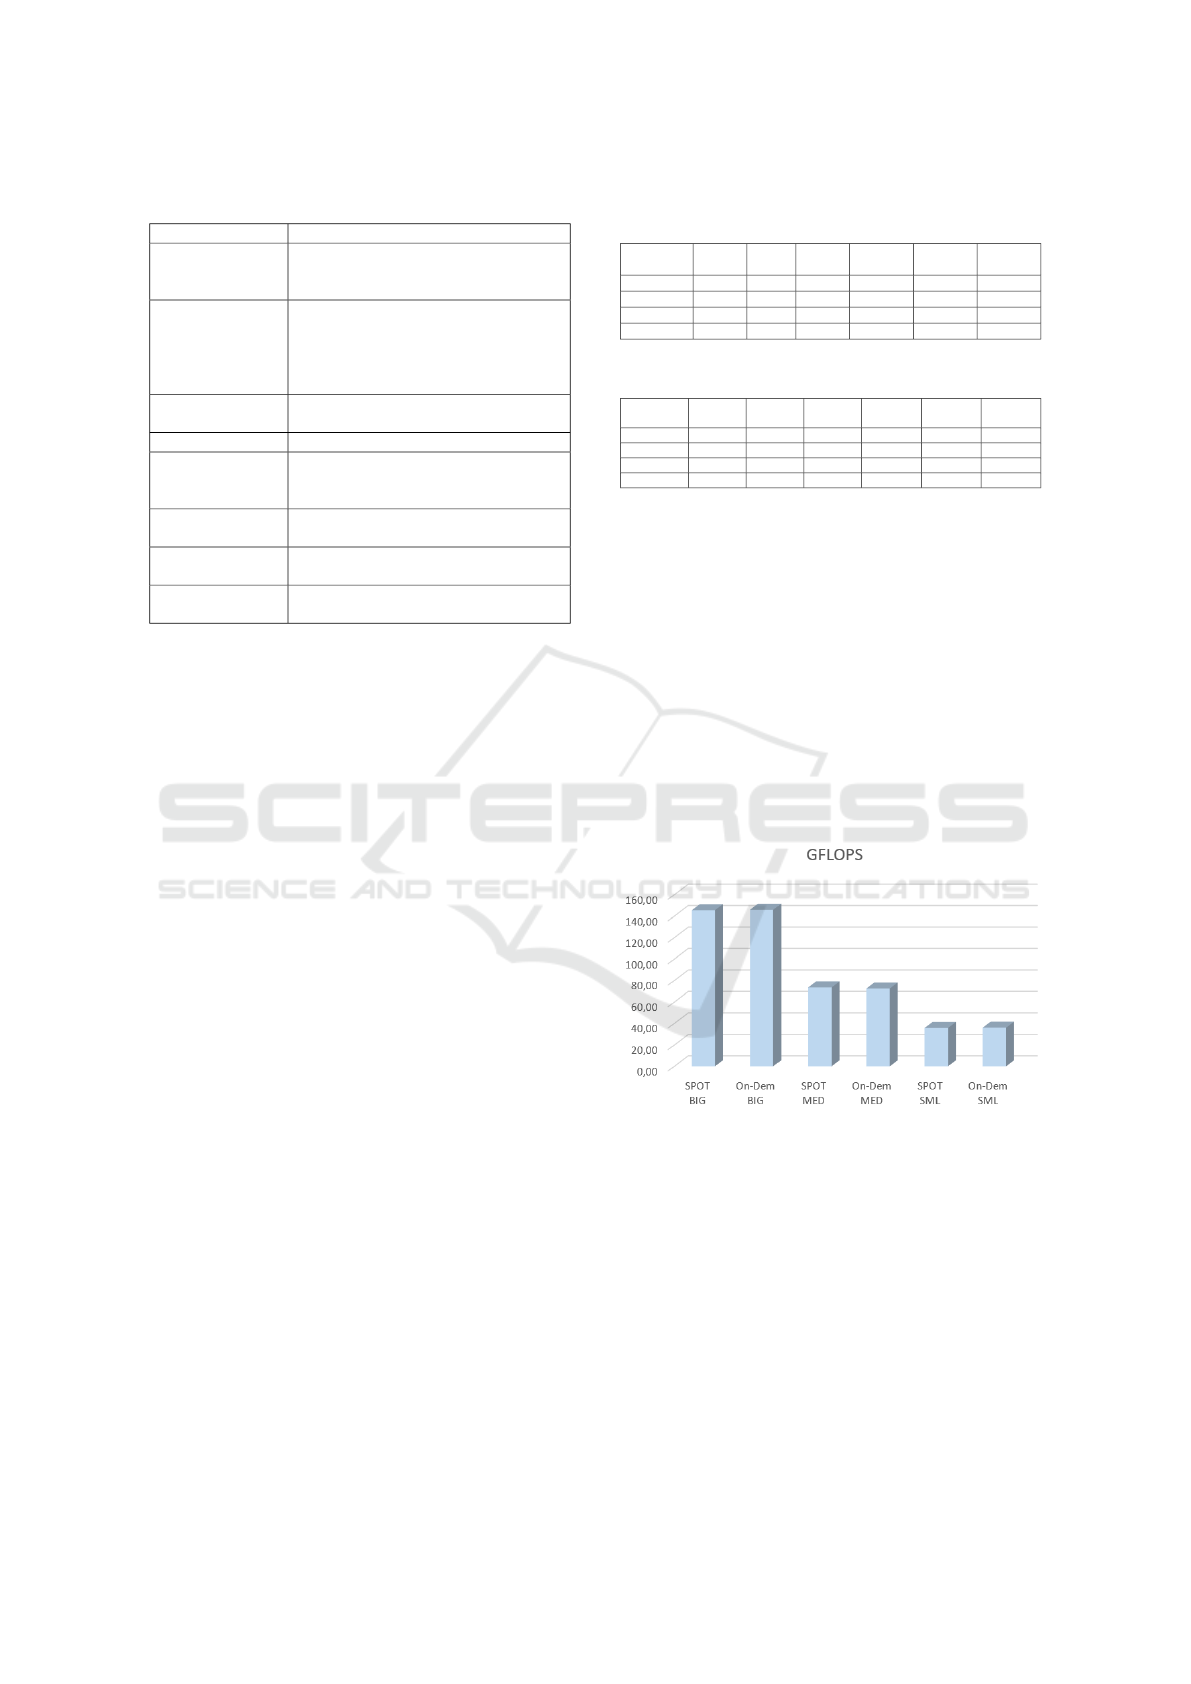
Table 3: Experiment design.
SYSTEM Virtual Machine
METRICS
CPU (GFLOPs),
I/O (throughput, in MB/s),
NETWORK (throughput, in Mbps)
PARAMETERS
For CPU, number of Linpack equations,
array size, number of runs, and total
size of data. For I/O, the size of files
and records. For NETWORK, the
load time and the amount of runs.
FACTORS
Size of VMs in amount of
vCPUs (BIG, MED and SML)
TECHNIQUE Measurement
WORKLOAD
Synthetic. Workload of benchmarks
LINPACK (CPU), IOZONE (I/O)
and IPERF (NETWORK)
DESIGN
For each VM, the benchmarks
will be executed independently
DATA
ANALYSIS
Interpretation of the results
described in tables and graphs.
PRESENTATION
OF RESULTS
Bar charts and tables
pack (Intel, 2017). They find compatible results be-
tween them when evaluating the same computing en-
vironment. Besides, Linpack uses less execution time
and has more simplified configuration. Linpack was
also the benchmark selected for the study presented
here. Regarding I/O, the benchmark chosen was IO-
Zone (Iozone, 2017), which is also widely used in
such measurements in the literature. To evaluate net-
work performance, iPerf (Iperf, 2017) was the bench-
mark software chosen.
The parameters used on CPU benchmark software
were defined by (Coutinho et al., 2012). They de-
fined as Linpack parameters 10000 equations (prob-
lem size), 10000 as matrix size, 30 repetitions and
the data size as 10KB. For IOzone, which measures
throughput in various I/O operations, the default pa-
rameters were used. IOZone varies the size of the file
to be manipulated, as well as the data records that
compose these files, in 8 different operations. For
the purpose of this comparison, we will show the
results of writing and reading operations only. For
iPerf, which measures the network throughput, stan-
dard TCP protocol parameters were used.
The methodology for performing performance
analysis is described in (Jain, 1991). It is possible
to detail characteristics related to the design of the
experiments, such as metrics and workloads, besides
the factors and parameters. The details are described
in Table 3.
4.1 Experiment 1 - vCPU
The goal of this experiment is to compare VM per-
formance results between both classes (on-demand
Table 4: AWS VMs performance measurements
(GFLOPS).
GFLOPS
SPOT
BIG
SPOT
MED
SPOT
SML
On-Dem
BIG
On-Dem
MED
On-Dem
SML
Mean 145.43 73.53 35.709 145.87 72.51 35.99
Deviation 0.21 0.14 0.15 0.52 0.52 0.16
Minimum 144.45 72.99 35.10 143.69 69.97 35.42
Maximum 145.63 73.62 35.80 146.48 72.81 36.16
Table 5: GCP VMs performance measurements (GFLOPS).
GFLOPS
PREEM
BIG
PREEM
MED
PREEM
SML
On-Dem
BIG
On-Dem
MED
On-Dem
SML
Mean 125.70 60.13 31.82 125.95 65.14 32.39
Deviation 7.26 1.01 2.08 1.96 0.76 0.47
Minimum 111.68 57.63 22.16 117.84 62.39 30.45
Maximum 131.34 62.40 33.17 127.86 65.97 32.80
an transient) for each size. Only VMs of the same
provider will be compared to each other.
Tables 4 and 5 show the values measured for each
VM, as well as the standard deviation of the sam-
ple and the maximum and minimum values. It can
be seen that in all of them the standard deviation was
very small, which demonstrates stability in the deliv-
ery of the contracted vCPU resource in both contract-
ing models.
Figure 2 compares each AWS on-demand VM size
with the similar transient VM and it is seen that the
measurement is practically the same in all cases. The
results found for GCP VMs follow the same pattern,
as seen in Table 5.
Figure 2: AWS vCPU comparative performance.
4.2 Experiment 2 - I/O
The purpose of this experiment is to measure the I/O
throughput of all VMs and compare them.
For this experiment IOZone was used. IOzone is a
benchmark for file system. It generates and measures
a variety of read and write operations on files. The
tests used in this experiment were read, indicating the
performance of reading a file that already exists in the
file system, and write, indicating the performance of
writing a new file in the file system. These tests cre-
ate temporary test files of sizes ranging from 64KB to
Performance and Cost Analysis Between On-Demand and Preemptive Virtual Machines
173
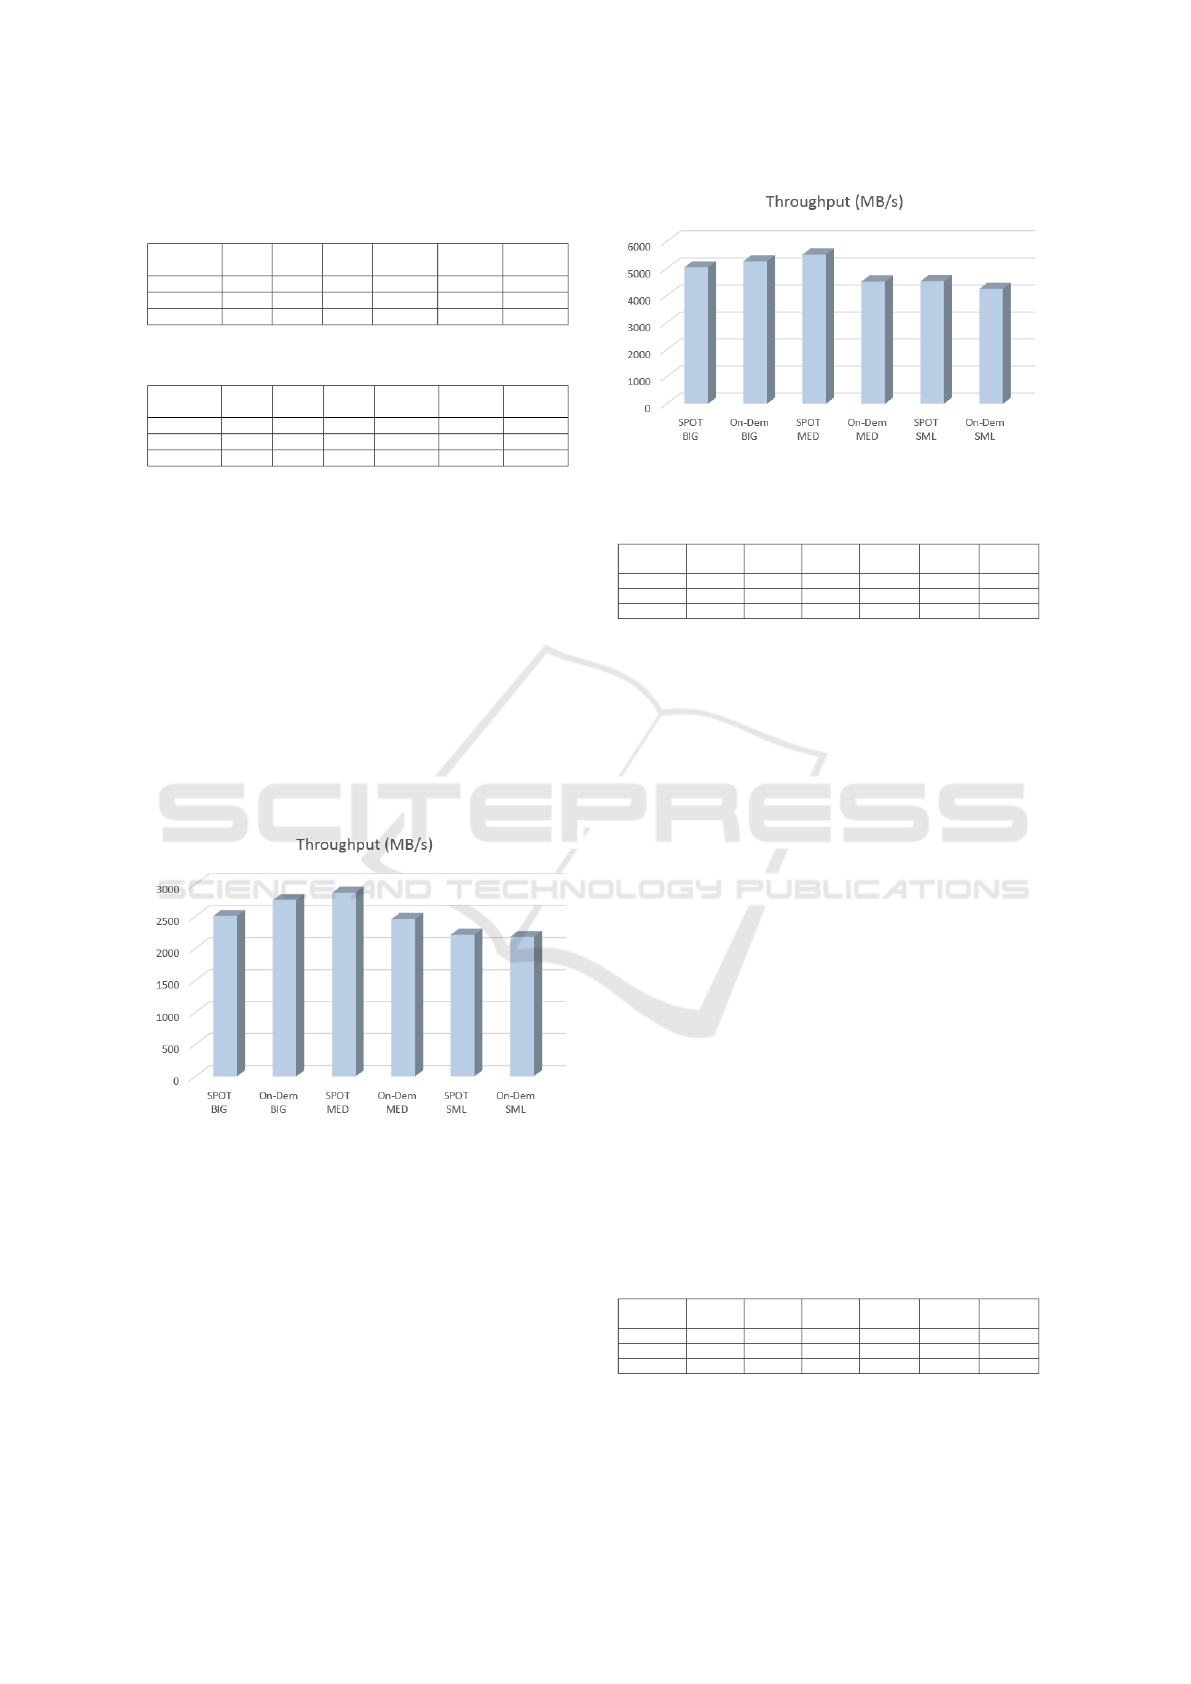
Table 6: AWS I/O throughput, in MB/s, for write opera-
tions.
SPOT
BIG
SPOT
MED
SPOT
SML
On-Dem
BIG
On-Dem
MED
On-Dem
SML
Mean 2504 2867 2211 2751 2456 2177
Minimum 497 420 506 552 458 475
Maximum 3407 3947 3070 3868 3425 2993
Table 7: AWS I/O throughput, in MB/s, for read operations.
SPOT
BIG
SPOT
MED
SPOT
SML
On-Dem
BIG
On-Dem
MED
On-Dem
SML
Mean 5042 5515 4530 5265 4519 4248
Minimum 2031 2185 1339 2128 1882 1743
Maximum 11763 11956 11403 11185 10220 10119
512MB. The size of the records varies from 4KB to
16MB. All results are in MB/s.
Tables 6 and 7 show AWS throughput values mea-
sured by IOZone for each VM for write and read oper-
ations, respectively. By the analysis of Figures 3 and
4, it can be seen that the measurements are quite simi-
lar, with a slightly higher value of On-Dem BIG com-
pared to SPOT BIG, but with slightly lower values
for both On-Dem MED, as well as for On-Dem SML,
when compared to their equivalent SPOT. The result
seems to indicate that the variation was due to the I/O
load of the infrastructure of the sa-east-1a zone at the
time of measurement rather than to an actual differ-
ence between the analyzed VMs.
Figure 3: AWS I/O throughput, in MB/s, for write opera-
tions.
As can be seen in Tables 8 and 9, which show
the results measured for the GCP provider, there was
less than a 5% average I/O performance difference be-
tween the two types of VMs. The results also seem to
indicate an expected variation on I/O load of the us-
central1-a zone at the time of measurement.
4.3 Experiment 3 - Network
The purpose of this experiment is to measure the net-
work throughput between on-demand VMs and tran-
Figure 4: AWS I/O throughput, in MB/s, for read opera-
tions.
Table 8: GCP I/O throughput, in MB/s, for write operations.
PREEM
BIG
PREEM
MED
PREEM
SML
On-Dem
BIG
On-Dem
MED
On-Dem
SML
Mean 1892 1886 2180 1858 1916 2071
Minimum 373 303 373 84 406 422
Maximum 2797 3145 2966 2917 3256 2947
sient ones on both providers. For this experiment the
benchmark IPerf was used.
SML size VM was used as the server, while the
other two VMs were used as client machines within
the same zone.
The experiment consisted of generating a stream
of TCP data on each client machine for one minute
and measuring it second by second. This throughput
was executed 40 times at different hours of the day, in
order to record the throughput variation.
As there was a close similarity between the mea-
sured values of the two VMs that served as IPerf
clients, the values were consolidated and are pre-
sented in Tables 10 and 11 with reference only to BIG
VMs. As expected, there was a relevant variability
in the measurements, which is reflected in the ratio of
the deviations from the mean, as well as in the interval
between the maximum and minimum values.
The difference between the measurements was
quite small, as can be seen in Figure 5 for GCP. AWS
has similar results as can be seen in Table 10. In
the network measurement, the GCP VMs presented
a difference of less than 1% in the throughput, which
seems to show no actual difference between the VMs,
but only a regular variability found in this type of
measurement.
Table 9: GCP I/O throughput, in MB/s, for read operations.
PREEM
BIG
PREEM
MED
PREEM
SML
On-Dem
BIG
On-Dem
MED
On-Dem
SML
Mean 3337 3006 3545 3319 3353 3802
Minimum 1443 1123 1539 1183 825 1592
Maximum 12075 12427 12075 10159 11852 10894
CLOSER 2018 - 8th International Conference on Cloud Computing and Services Science
174
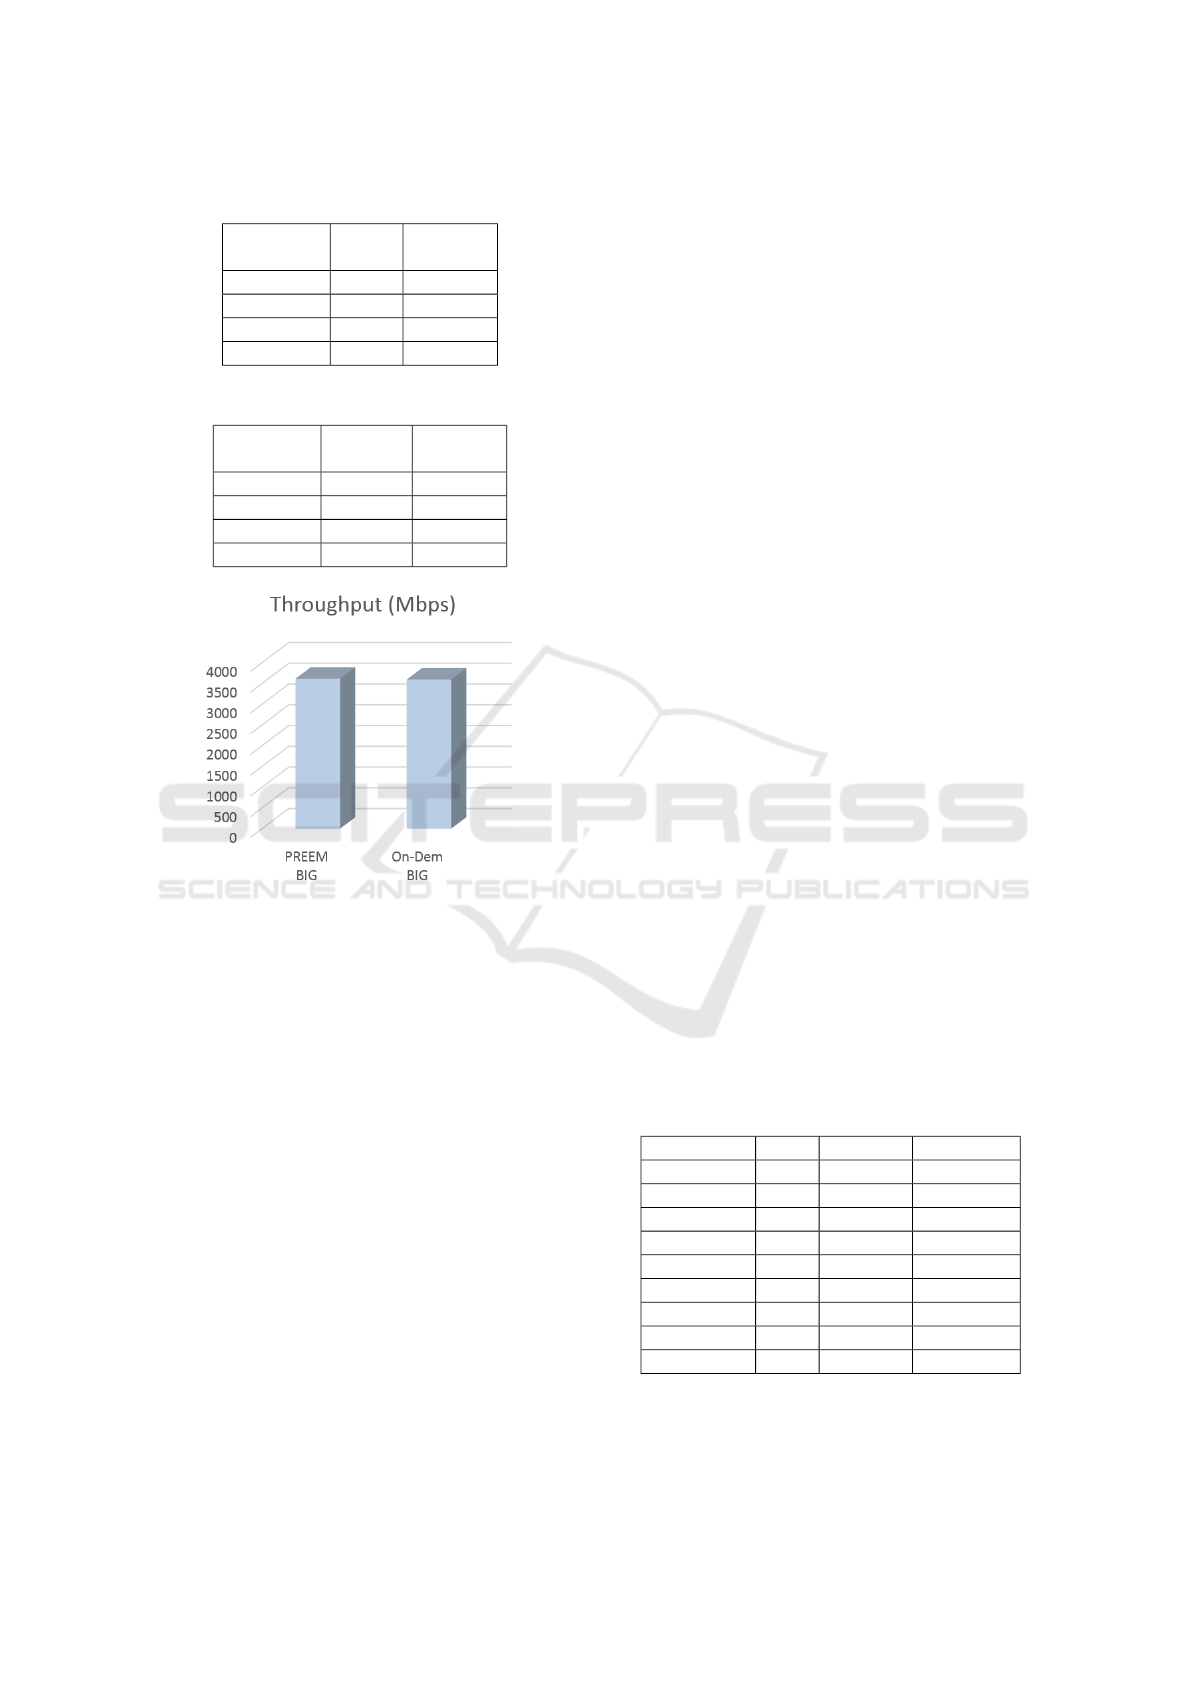
Table 10: AWS Network throughput (in Mbps).
SPOT
BIG
On-Dem
BIG
Mean 303 313
Deviation 66 94
Minimum 276 296
Maximum 635 1,001
Table 11: GCP Network throughput (in Mbps).
PREEM
BIG
On-Dem
BIG
Mean 3614 3592
Deviation 545 543
Minimum 1410 430
Maximum 4960 5100
Figure 5: GCP Network throughput (in Mbps).
5 ANALYSIS
The experiments carried out showed that, in relation
to vCPU performance, the greatest measurement dif-
ference found on AWS was small, only 1.4% in fa-
vor of VM SPOT MED. On the other hand, the On-
Dem BIG and On-Dem SML VMs performed better
than their similar ones by only 0.3% and 0.8%, re-
spectively. On GCP, all on-demand VMs performed
better than the preemptive ones. But the differences
were tiny on average: 0.2%, 8.3% and 1.8% for BIG,
MED and SML VMs, respectively.
In relation to the I/O throughput, the greatest mea-
surement difference found on AWS was 18%, in the
reading operations, in favor of VM SPOT MED. VM
On-Dem BIG had a superior result of 4.4% and VM
SPOT SML performed better than its equivalent at
6.22%. On GCP side, the greatest difference was also
on reading operations. It was 11.5% in favor of VM
On-Dem MED. VM PREEM BIG had a 0.55% better
throughput and VM On-Dem SML did 7,24% better
than its preemptive equivalent.
Regarding the network throughput, the On-Dem
BIG performed 3.3% higher when compared to its
equivalent SPOT BIG on AWS. On GCP, PREEM
BIG performed 0,61% better than On-Dem BIG.
The small differences found in measurements, as
well as the fact that the VM size that presented the
best performance varied according to the experiment
and, in some cases, varied within the same experi-
ment, allows us to state that there is no significant dif-
ference between on-demand and transient VMs from
both providers.
6 COSTS
In order to proceed to cost analysis, additional exper-
iments were performed to compare on-demand and
transient VMs from each provider.
6.1 Costs in AWS
The VMs available in AWS for use in cost experi-
ments are listed in Table 12. The AWS M family of
VMs is used for general purpose applications (AWS,
2017b), while the R family is used for memory inten-
sive applications.
Some VMs are available with Elastic Block Store
(EBS), an AWS service that adds a virtual disk to the
VMs for persistent data storage. Local SSD disks,
however, are removed when the VM is turned off.
EBS volumes preserve the data and can be copied as
a backup. They can be attached later to other VMs
(AWS, 2017a). VMs that use EBS are more robust
and suitable to perform intensive processing, espe-
cially Hadoop applications, which is the focus of the
additional experiments (AWS, 2017b).
Table 12: AWS instance types.
Type CPU Memory Storage
m3.large 2 7.5 1 x 32
m3.xlarge 4 15 2 x 40
m3.2xlarge 8 30 2 x 80
m4.large 2 8 EBS-only
m4.xlarge 4 16 EBS-only
m4.2xlarge 8 32 EBS-only
r4.large 2 15.25 EBS-Only
r4.xlarge 4 30.5 EBS-Only
r4.2xlarge 8 61 EBS-Only
The AWS prices are shown on Table 13. For
the additional experiments, EC2 instances running the
Performance and Cost Analysis Between On-Demand and Preemptive Virtual Machines
175

Elastic MapReduce (EMR) service were used. To cal-
culate the total amount to be paid per hour of use, the
columns for the hourly price of EC2 and EMR must
be added together. The values are in US dollars. AWS
us-east-1 region was used since it has the lowest price
for on-demand VMs and then provides a fair compar-
ison to SI prices.
Table 13: AWS prices for on-demand VMs (us-east-1).
Type EC2 EMR
(US$/hour) (US$/hour)
m3.xlarge 0.266 0.070
m3.2xlarge 0.532 0.140
m4.large 0.100 0.030
m4.xlarge 0.200 0.060
m4.2xlarge 0.400 0.120
m4.4xlarge 0.800 0.240
r4.xlarge 0.266 0.067
r4.2xlarge 0.532 0.133
This experiment consists of indexing a file of
26 GB of data in BZ2 (compressed) format using
MapReduce on a cluster composed of a master ma-
chine and two workers of VM type r4.xlarge, whose
family of VMs is more appropriate to execute EMR
clusters. This experiment was executed several times
and an average execution time was calculated for both
SI and on-demand EMR clusters.
In the SI mode, 3 clusters of the same config-
uration (3 VMs r4.xlarge) were created and named
HDP3, HDP4 and HDP5, according to the values used
as the SI bid: US$ 0.03, US$ 0.04 and US$ 0.05, re-
spectively. The SI market value for each zone of re-
gion us-east-1 for this VM type is shown in Table 14.
Table 14: Market value of r4.xlarge SPOT on region us-
east-1
Zone Value (US$)
us-east-1a 0.047
us-east-1b 0.033
us-east-1c 0.039
us-east-1d 0.035
us-east-1e 0.032
us-east-1f 0.027
Clusters HDP4 and HDP5 were provisioned in
300 seconds, which is the average time verified in
AWS for this type of VM. According to Table 14,
the bid values were all above the market value for
r4.xlarge in zone us-east-1f. However, HDP3 was not
provisioned.
There is a large difference between the values
of on-demand VMs and SIs. While an on-demand
r4.xlarge costs US$ 0.266 per hour, an SI r4.xlarge
costs between US$ 0.027 and US$ 0.047 at that time
in the us-east-1 region. However, as verified in the
experiment, there is no guarantee of provisioning, es-
pecially in cases where the bid value is close to the
minimum value in the SI market.
Regarding performance, the on-demand and SI
machines are similar, as seen in Section 5. The ex-
ecution time of an indexing MapReduce application
with the same dataset was, on average, between 4 and
5 hours in all EMR clusters created. The result can
be verified in Table 15, with the confirmation that the
performance does not suffer degradation during exe-
cution in SI, unless one or more instances are revoked
during the execution.
HDP4 execution time was slightly lower than the
on-demand EMR cluster execution time. HDP5 exe-
cution time was higher, in the opposite direction. This
performance loss for HDP5 probably came from SI
revocations and replenishment.
Table 15: AWS EMR cluster average execution time.
EMR cluster Time
On-demand 4 hours e 16 minutes
HDP4 4 hours e 15 minutes
HDP5 4 hours e 52 minutes
6.2 Costs in GCP
The experiments in GCP were conducted using VMs
of type ‘n1-highmem-4’, each of them with 200 GB
disk and 26 GB of RAM. The datasets had 6 GB of
data in BZ2 (compressed) format, and were processed
using MapReduce.
GCP has a service called Dataproc, where one can
create Hadoop clusters. On GCP, a Hadoop cluster
should have at least the master node and 2 workers
of on-demand VMs. Because of this, the cost experi-
ment in this provider was a little bit different. That is,
on AWS it is possible to create a cluster totally com-
posed of transient servers, but on GCP it is possible
only to create a partially composed one.
The GCP prices are showed on the table 16. On
GCP there is no price variation for preemptive VMs.
Similar to AWS, there is a fixed price for Dataproc
service that must be added to VM execution price to
achieve the total cost of cluster execution. The values
are in US dollars and refer to region us-east1.
Table 16: GCP hourly prices (US$) for n1-highmem-4 VM.
Type On-dem Preem Dataproc
n1-highmem-4 0.2696 0.0535 0.04
CLOSER 2018 - 8th International Conference on Cloud Computing and Services Science
176

Two clusters were created on GCP. The first one
was composed of 1 master node and 4 workers, all of
them on-demand. The second cluster was composed
of 1 master node, 2 on-demand workers and 2 more
preemptive workers. This cluster is therefore partially
preemptive.
As seen in Table 17, the performance in hybrid
clusters (preemptive and on-demand VMs) is similar
to cluster with only on-demand VMs.
The partially preemptive cluster executed 7%
slower on average, with a cost 26% smaller than the
totally on-demand one. Considering that each pre-
emptive VM has an 80% discount, that Dataproc ser-
vice has a fixed cost and that the cluster is composed
of at least 3 on-demand VMs, one can reach a bigger
discount when executing larger clusters with only 3
mandatory on-demand VMs and the rest of them as
preemptive VMs. For example, a cluster made of 3
on-demand VMs plus 7 preemptive VMs, executing
the same workload described in this subsection (6.2)
will reach a discount level of 52%.
Table 17: GCP cluster average execution time (seconds).
Partially Preem On-Demand
Mean 1330.00 1241.75
Deviation 32.11 32.01
Minimum 1289.00 1217.00
Maximum 1358.00 1285.00
7 CONCLUSION
This work compared the performance of on-demand
VMs with equivalent preemptive VMs (same type,
same configuration, running in the same zone). Met-
rics related to CPU, I/O and network were used, thus
comparing execution costs in specific scenarios on
each provider.
The results indicated that there were no significant
performance differences in the metrics used for CPU,
I/O and network. These results confirm that both VMs
use the same computational resource set. This is ad-
ditionally verified by a series of MapReduce appli-
cation executions. The differences between the two
modes are availability and cost. The availability of
on-demand VMs seems unlimited, since in the vast
majority of cases the VM can be started at any time
and will be interrupted only at the request of the cus-
tomer, or in case of technical failure.
The preemptive VMs, however, can be revoked
anytime by criteria that are out of control by the cus-
tomer, such as market price, lack of idle resources and
others defined by the provider. The cost of preemp-
tive VMs can reach a 90% discount, on AWS, and an
80% discount on GCP. In the scenario executed by
this study, a discount of 68% was obtained in relation
to on-demand execution on AWS and a discount of
26% on GCP.
Although the AWS discount was greater than what
was achieved on GCP, as all AWS cluster nodes were
preemptive VMs, that increased the risk of not fin-
ishing the work or that have an increase on execution
time caused by node revocations.
The performance and cost measurements per-
formed in this study add value to applications that can
benefit from the use of transient servers (AWS spot
instances and GCP preemptive instances), thereby
achieving a cost reduction, with little additional ef-
fort to automate the replenishment of instances that
are claimed by the provider, when it is the case.
Future work is intended to analyze other transient
server offers, as Microsoft Azure Low-priority VMs,
and to evaluate other execution scenarios whose ap-
plications can deal with VM revocations and could
benefit for cost reductions offered by the use of tran-
sient servers.
REFERENCES
Agmon Ben-Yehuda, O., Ben-Yehuda, M., Schuster, A.,
and Tsafrir, D. (2013). Deconstructing amazon ec2
spot instance pricing. ACM Transactions on Eco-
nomics and Computation, 1(3):16.
AWS (2015a). Ec2 spot bid advisor. [online]. available
from:. https://aws.amazon.com/ec2/spot/bid-advisor/.
2017-05-17.
AWS (2015b). Ec2 spot-fleet. [online]. available
from:. http://docs.aws.amazon.com/AWSEC2/latest/
UserGuide/spot-fleet.html. 2017-05-17.
AWS (2017a). Amazon elastic block store. [online]. avail-
able from:. https://aws.amazon.com/ebs/. 2017-06-
01.
AWS (2017b). AWS EC2 Instance Types. [Online]. Avail-
able from:. https://aws.amazon.com/ec2/instance-
types/. 2017-10-12.
AWS (2017c). AWS Free Tier. [online]. available from:.
https://aws.amazon.com/free/. 2017-05-17.
Chhetri, M. B., Lumpe, M., Vo, Q. B., and Kowalczyk,
R. (2017). On estimating bids for amazon ec2 spot
instances using time series forecasting. In Services
Computing (SCC), 2017 IEEE International Confer-
ence on, pages 44–51. IEEE.
Chohan, N., Castillo, C., Spreitzer, M., Steinder, M.,
Tantawi, A. N., and Krintz, C. (2010). See spot run:
Using spot instances for mapreduce workflows. Hot-
Cloud, 10:7–7.
Coutinho, E. F., Rego, P., Gomes, D. G., and de Souza, J. N.
(2012). An
´
alise de Desempenho com Benchmarks em
um Ambiente Publico de Computac¸ ao em Nuvem. In
Performance and Cost Analysis Between On-Demand and Preemptive Virtual Machines
177

Proc. of the X Workshop em Clouds e Aplicac¸
˜
oes. Belo
Horizonte, pages 96–109.
Gartner (2016). Magic Quadrant for Cloud Infrastruc-
ture as a Service, Worldwide. [online]. available
from:. https://www.gartner.com/doc/ reprints?id=1-
2G2O5FC&ct=150519. 2017-05-17.
Google (2017). Google preemptible instances. [online].
available from:. https://cloud.google.com/compute/
docs/instances/preemptible. 2017-01-07.
Huang, H., Wang, L., Tak, B. C., Wang, L., and Tang, C.
(2013). Cap3: A cloud auto-provisioning framework
for parallel processing using on-demand and spot in-
stances. In Cloud Computing (CLOUD), 2013 IEEE
Sixth International Conference on, pages 228–235.
IEEE.
Intel (2017). Linpack - Intel math kernel. [online]. available
from:. https://software.intel.com/en-us/mkl. 2017-05-
17.
Iozone (2017). Iozone - filesystem benchmark. [online].
available from:. http://www.iozone.org/. 2017-05-17.
Iperf (2017). Iperf. Network performance benchmark. [on-
line]. available from:. http://iperf.sourceforge.net/.
2017-05-17.
Jain, R. (1991). The Art of Computer Systems Performance
Analysis: techniques for experimental design, mea-
surement, simulation, and modeling.
Khandelwal, V., Chaturvedi, A., and Gupta, C. P. (2017).
Amazon ec2 spot price prediction using regression
random forests. IEEE Transactions on Cloud Com-
puting.
Mell, P., Grance, T., and others (2011). The NIST definition
of cloud computing.
Microsoft (2017). Azure batch low-priority vms. [online].
available from:. https://docs.microsoft.com/azure/
batch/batch-low-pri-vms. 2017-12-20.
Sabyasachi, A. S., Kabir, H. M. D., Abdelmoniem, A. M.,
and Mondal, S. K. (2017). A resilient auction frame-
work for deadline-aware jobs in cloud spot market. In
Reliable Distributed Systems (SRDS), 2017 IEEE 36th
Symposium on, pages 247–249. IEEE.
Sharma, P., Guo, T., He, X., Irwin, D., and Shenoy, P.
(2016). Flint: batch-interactive data-intensive pro-
cessing on transient servers. In Proceedings of the
Eleventh European Conference on Computer Systems,
page 6. ACM.
Sharma, P., Irwin, D., and Shenoy, P. (2017). Portfolio-
driven Resource Management for Transient Cloud
Servers. Proceedings of the ACM on Measurement
and Analysis of Computing Systems, 1(1):5.
Singh, R., Sharma, P., Irwin, D., Shenoy, P., and Ramakr-
ishnan, K. (2014). Here today, gone tomorrow: Ex-
ploiting transient servers in datacenters. IEEE Internet
Computing, 18(4):22–29.
Wolski, R. and Brevik, J. (2016). Providing statistical re-
liability guarantees in the aws spot tier. In Proceed-
ings of the 24th High Performance Computing Sym-
posium, page 13. Society for Computer Simulation In-
ternational.
CLOSER 2018 - 8th International Conference on Cloud Computing and Services Science
178
