
Mapping and Monitoring Airports with Sentinel 1 and 2 Data
Urban Geospatial Mapping for the SCRAMJET Business Networking Tool
Nuno Duro Santos
1
, Gil Gonçalves
2
and Pedro Coutinho
3
1
Bluecover Technologies, Lisboa, Portugal
2
University of Coimbra & INESC-Coimbra, Coimbra, Portugal
3
WATERDOG mobile Lda., Porto, Portugal
Keywords: Earth Observation, Satellites, Open Data, SCRAMJET, Urban Mapping, Spatial Resolution.
Abstract: SCRAMJET is an online tool that allows business travellers to connect and plan to meet in any of the
airports included in their trip. To successfully deliver, SCRAMJET needs accurate and up-to-date
worldwide airport mapping information. This paper describes an assessment of the use of Earth Observation
(EO) products, in particular the Sentinel program, for improving airport mapping and monitoring its
changes. The first step is to verify the data availability of Sentinel-1 and Sentinel-2 at a global scale, and
then evaluate its adequacy for airport mapping. For monitoring airport changes, the analysis tested
multispectral change detection methods and interferometry processing techniques. The main conclusion was
that the acquisition frequency of both Sentinels is a great benefit to assure up-to-date information at a global
scale. The recommended approach for a target of 200 airports is to do the airport mapping, assisted by
Sentinels data for validation and improvements, and monitoring changes by integrating a Sentinel-2 change
detection chain (using NIR/SWIR bands), in parallel with OpenstreetMap change detection processing.
1 INTRODUCTION
SCRAMJET is a web and mobile product to connect
business travellers at airports that is being developed
by WATERDOG at ESA BIC Portugal. One of the
key assets of the tool is to maintain reliable, updated
and accurate airport maps to ensure travellers can
agree on a meeting point while planning their trip
and, once physically at the airport, find each other.
The maps comprise both indoor and outdoor
features, including the buildings’ morphology, gates
identification and Points of Interest (shops, toilets,
etc…) as depicted in figure.
Figure 1: Outdoor and indoor mapping needs.
The typical usage scenarios of the maps are:
• The user knows his gate and the gate of the
person to meet and uses the map to choose the
meeting place, for example Gate 21 or a coffee
shop POI ;
• The user lands and a location-based tool
running on his phone provides rough indoor
guidance visually identifying the place to go.
SCRAMJET will have its own airport map
information and the research presented in this paper
is crucial for two development and maintenance
needs:
• Airport Mapping: the initial geographical
information of all airports is obtained from
OpenstreetMap (OSM) and Google Maps is
used for validation. Nonetheless, many airports
have incomplete or outdated mapping data on
these platforms that needs to be validated and
improved.
• Monitoring the Airport Changes: airports
may be subject to works, renovations and
extensions that need to be detected.
The available literature on automatic airport
mapping and monitoring from remote sensing image
data is very scarce. First, previous works on
automatic airport mapping mainly focused on the
runways detection as they are the primary
characteristic of an airport. Wang et al. (2013) used
a Hough transform to judge whether an airport exists
50
Duro Santos, N., Gonçalves, G. and Coutinho, P.
Mapping and Monitoring Airports with Sentinel 1 and 2 Data.
DOI: 10.5220/0006674000500058
In Proceedings of the 4th International Conference on Geographical Information Systems Theory, Applications and Management (GISTAM 2018), pages 50-58
ISBN: 978-989-758-294-3
Copyright
c
2019 by SCITEPRESS – Science and Technology Publications, Lda. All rights reserved

in a Very High Resolution (VHR) image. Then a
scale invariant feature transform in conjunction with
a hierarchical discriminant regression tree was
employed to detect the airport area. Aytekin et al.
(2013) used a texture-based runway detection
algorithm that uses the Adaboost machine learning
package for identifying 32x32 pixel image tiles as
runway or non-runway. Second, for automatically
monitoring the airport changes, Digital Change
Detection algorithms that provide binary land cover
“change/no-change” information, can be used
(Jensen, 2015). In fact, by automatically detecting
the spatial regions within a bi-temporal image pair
where meaningful change is likely to have occurred,
a human operator (or another process) can then
analyse the changes using his/her knowledge.
ESA’s Sentinel missions are providing us with
reliable and timely open data on land, ocean and
atmosphere with high spatial and temporal
resolutions for state-of-the-art research activities and
services, e.g., natural resources management and
urban land cover mapping (Malenovský et al.,
2012). In this context, synergetic use of Sentinel 1/2
data has been used for urban land cover mapping
and change detection (Ban et al., 2017; Haas and
Ban, 2017). Although the potential of Sentinel 1/2
data has been highlighted in the above works, the
effective use of this data in the context of mapping
and monitoring airports need to be assessed.
This study aims to confirm the needs and verify
how Earth Observation satellites, in particular the
latest Sentinels satellites, can be used to assure the
best up-to-date outdoor mapping for an initial target
of 200 world airports. The work assesses the
temporal and spatial suitability of Sentinels (or other
EO data) and defines a service chain design for
airport mapping and monitoring changes.
2 EO DATA AVAILABILTY
The first step of the analysis was to confirm the
temporal availability of EO data at a global scale, by
defining a timeframe for validation on a set of
worldwide airports.
The selected timeframe was the latest two
months before the study started, from 1st December
2016 to 31st January 2017, while nine airports were
chosen, representative of different geographical
regions from USA, Europe and Asia.
During this period, two Sentinel-1 (S1) and one
Sentinel-2 (S2) were operational. The Sentinel-1
(synthetic-aperture radar) was operating with S1A
and S1B satellites, while the Sentinel-2
(multispectral) had only the S2A satellite active
(S2B was launched just on 7 March 2017).
The data procurement results of Sentinel-1 (S1) and
Sentinel-2 (S2) on these airports are presented in the
table.
Table 1: Sentinels data availability.
Sentinel-2 Sentinel-1
Europe
Lisbon
S2A 2016-12-19
2017-01-19 (S1A
IW VV-VH)
München
None (dense cloud
coverage)
2017-01-25 (S1A
IW VV- VH)
Istanbul
S2A 2017-02-02
2017-01-14 (S1A
IW VV-VH)
Malaga *
S2A 2016-12-20
2014-11-27 (S1A
SM HH-HV)
USA
Atlanta
S2A 2016-11-28
2017-01-06 (S1A
IW VV-VH)
NYC/JFK
S2A 2016-12-04
2017-01-12 (S1A
IW VV-VH)
Miami
S2A 2017-01-06
2017-01-01 (S1A
IW VV-VH)
Asia
Ben Gurion
S2A 2017-02-10
2017-01-04 (S1A
IW_ VV-VH)
AbuDhabi
S2A 2016-12-25
2017-01-07 (S1A
IW_VV)
Shanghai
S2A 2017-01-29
20170122 (S1A IW
VV-VH)
S2A has visible data from almost all airports,
including the 4 relevant bands for this study with 10
m spatial resolution: B2, B3, B4 and B8.
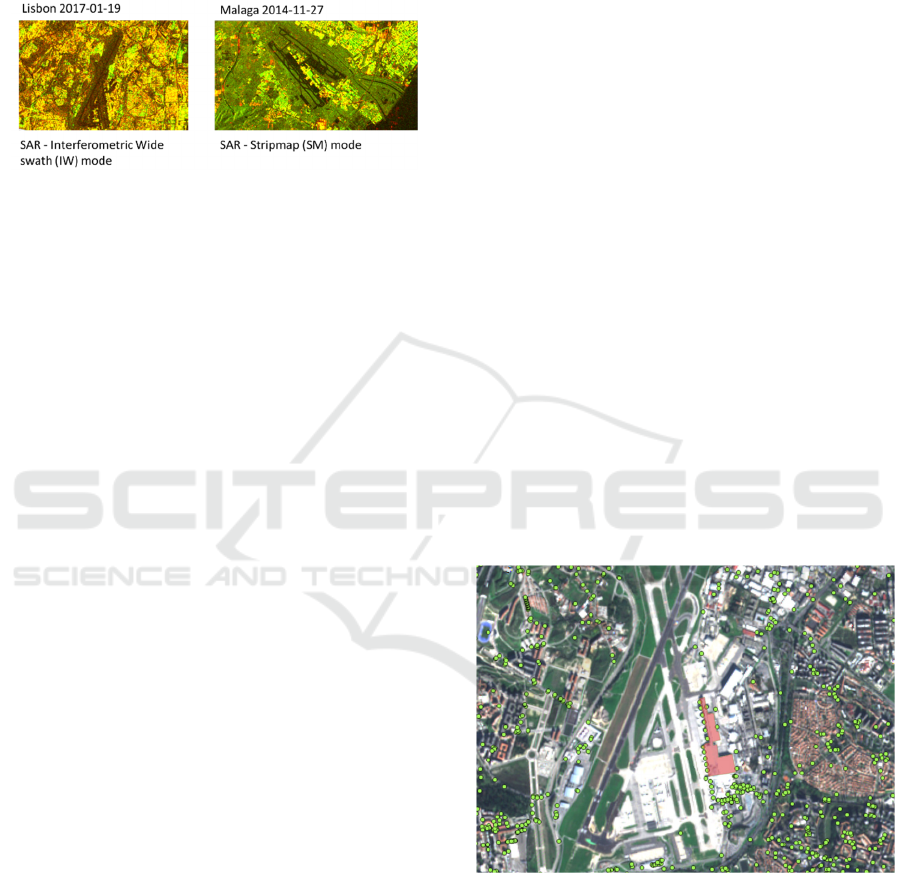
Figure 2: S2A True colour composition.
S1A and S1B were also capturing data in all
airports but using different modes. The main
operational mode for land is Interferometric Wide
(IW) High Resolution, typically using single or dual
polarization, with a spatial resolution up to 25 m.
The best resolution mode is Stripmap (SM) Full
Resolution, with a spatial resolution up to 10 m, that
is used only on request, typically on extraordinary
events, such as emergency management. Both
acquisition modes are available in the SLC product
format, needed for interferometry applications, and
GRD product format that is geo-referenced from
SLC.
Mapping and Monitoring Airports with Sentinel 1 and 2 Data
51
The acquisitions in IW mode were widely
available for all nine airports selected. Malaga*
airport was the only aerodrome found, acquired in
Stripmap mode Full Resolution and thus was added
to the baseline.
Figure 3: S1A IW VH-VV and SM HH-HV RGD
compositions.
2.1 Satellite Open Data Availability
Considering the technical specifications (namely the
spatial and temporal resolutions) of the SCRAMJET
two different open satellite data products have been
identified as the most useful: Sentinel-1 and
Sentinel-2 data. Concerning the Sentinel-2 data, it
was found that:
• Temporal frequency of Sentinel2 is fine. During
the selected timeframe S2A captured in average
1 good quality image per month, and there are
good images available in 90% of the airports.
• S2B was launched on 7 March 2017 and will
increase temporal availability.
• It may be difficult to capture images during
winter season in some airports (e.g. Munich,
Atlanta) due to high dense cloud coverage.
• Airports on the intersection of granules or tiles
need to have a special handling, such as JFK
that is right on the intersection of 4 granules.
Regarding the Sentinel 1 data, it was found that:
• IW acquisitions are available for all the 9
airports in dual polarization VV-VH excepting
in Abu Dhabi that acquisitions are done in
single VV polarization.
• Very few Stripmap (SM) Full Resolution
images are available at the archive. The ones
found were acquired from special zones, namely
the Strait of Gibraltar and a region of Germany.
• Almost all acquisitions are available in both
SLC and GRD product formats.
Other open satellite data procurement, in particular
Landsat8, was dropped since the first results pointed
that S2 has better spatial resolution.
3 AIRPORT MAPPING
The adequacy of the available data to meet the
mapping requirements was performed focusing on
spatial and spectral resolution and on the quality of
OSM data. The initial analysis covered only
Sentinels but it was later extended to analyse
commercial solutions. The three airports (Lisbon,
Istanbul, Abu Dhabi), used as analysis baseline,
were thus extended to Malaga and Malaysia in order
to address relevant data found on these areas.
3.1 Mapping with Sentinel-2
Three airports were selected for study from the
initial nine: Lisbon, Istanbul and Abdu Dhabi. The
approach was to build RBG composites with the
better resolution bands, layered with existing Points
of Interests from OpenstreetMap.
In the Lisbon airport, the S2A image was
composed with OSM data (Fig. 4), resulting on the
following findings:
• The visibility is slightly blurred. It is hard to
identify planes and gates.
• Many gates are mapped in OpenstreetMap (20
"aeroway"=>"gate, 1 "aeroway"=>"helipad")
• Infrared composition in Lisbon during winter,
(with more intense the grass) may be an
advantage to identify airport morphology
Figure 4: Lisbon S2A true colour composition with OSM.
Regarding the Istanbul airport, the S2A image
depicted on Fig. 5 highlights that:
• Although it has good visibility, additional
support photos and maps need to be used for
mapping
• The gates identified by red polygons are not
available on OSM
GISTAM 2018 - 4th International Conference on Geographical Information Systems Theory, Applications and Management
52
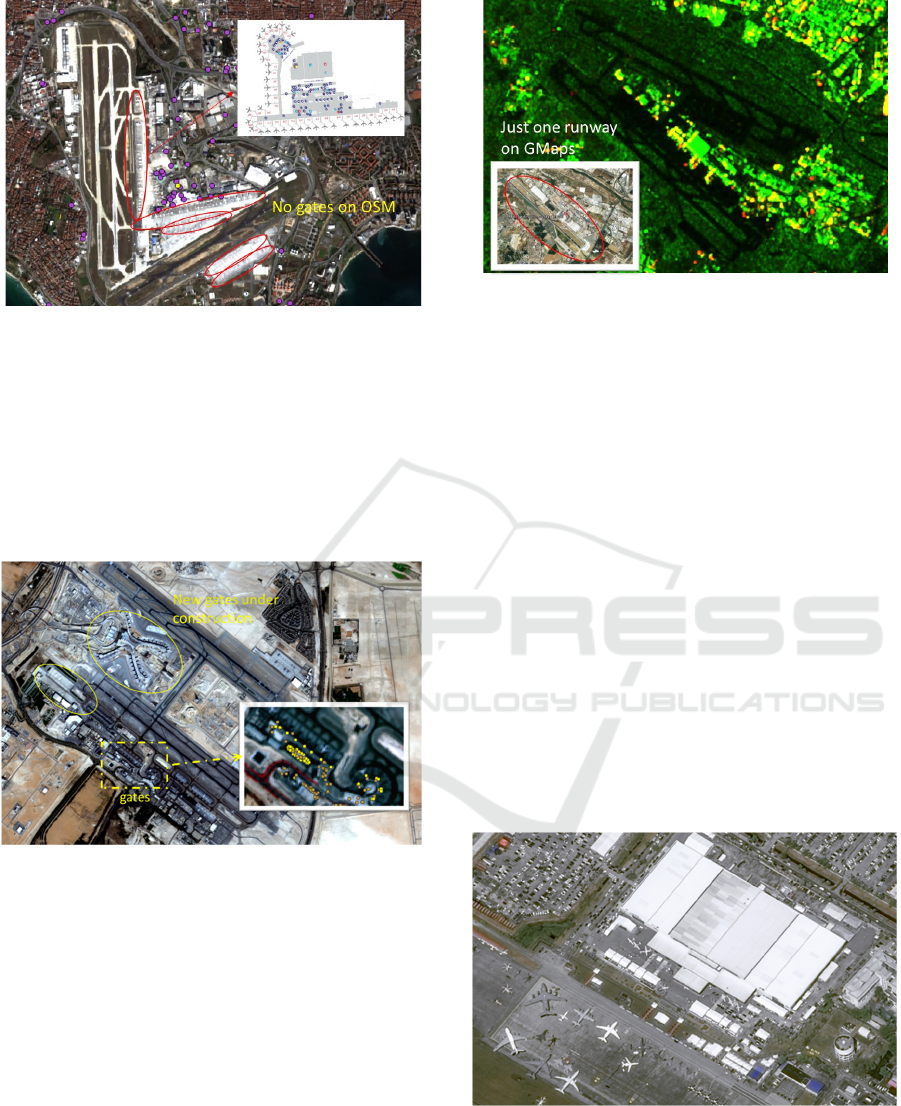
Figure 5: Istanbul S2 true colour composition with OSM.
The Abu Dhabi airport (27th in Asia) was
selected, not being as busy as Dubai International
Airport (3rd in Asia). The S2A image composition
on Figure 6 concludes that:
• It has very good visibility: parked airplanes the
new gates under construction are visible
• 41 gates are mapped in OSM (new gates were
not yet available in OSM)
Figure 6: Abu Dhabi S2 true colour composition with
OSM.
3.2 Mapping with Sentinel-1
Two study areas were analyzed: the Lisbon airport
using images acquired in the default Interferometric
Wide mode High Resolution and the Malaga airport
acquired in Stripmap mode Full Resolution. After
performing the geo-corrections of both S1A GRD
products, a RGB composite was produced with two
polarization bands (refer to Malaga RGB composite
on Fig 7).
Figure 7: Malaga S1A SM HH-HV RGB compositions.
The analysis concluded that:
• Both modes allow a good identification of
building areas and runways. It allows to easily
identify that Google Maps was showing an
outdated image of Malaga airport, with a single
runway, acquired before expansion on June
2012.
• S1A Sripmap FR (Malaga) has a more
appropriate spatial resolution than S1A IW HR
(Lisbon).
3.3 Mapping with Non-Open Eo Data
Considering that Sentinels may not have enough
spatial resolution for the needs, alternative
commercial satellite data with better resolution was
analysed. The project identified two very high-
resolution solutions from Pléiades (0.5-m) and
Deimos-2 (1m-4m) with competitive prices. An
example of Langkawi Airport at Malaysia using
Pléiades from 2017 is provided in Figure 8.
Figure 8: Malaysia Pleiades true colour composition.
The analysis concluded that:
• Pansharpened images with 50 cm resolution and
4 bands offers excellent details of the airport,
allowing recognition of the planes types
Mapping and Monitoring Airports with Sentinel 1 and 2 Data
53
• Temporal acquisition is not as flexible as
Sentinels at cost-effective prices
3.4 Mapping Sources Analysis
The analysis highlighted that there is no single
solution for all sites as presented in the table.
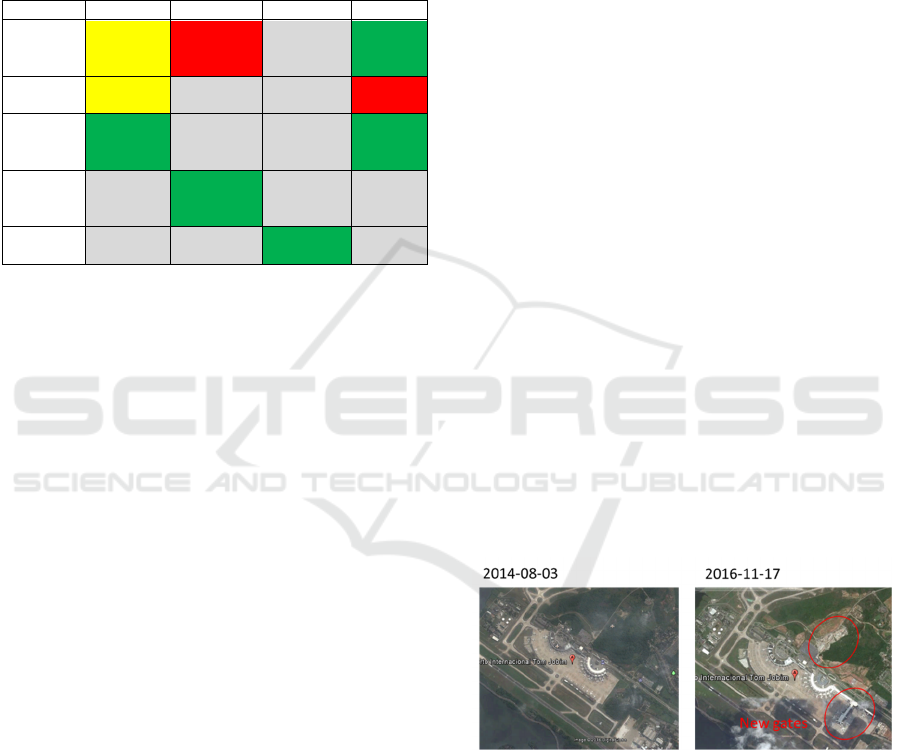
Table 2: Analysis of the airport mapping sources.
S2 S1 Pleiades OSM
Lisbon
Blurred
Low
resolution
(IW)
N/P 20 gates
Istanbul
Good
visibility
N/P N/P No gates
Abu
Dhabi
Very good
visibility
N/P N/P 41 gates
Malaga N/P
Good
resolution
(SM)
N/P N/P
Malaysia N/P N/P
V High
resolution
N/P
The best and relevant mapping sources depend
on the particularities of each site. The conclusions
per mapping source are presented below:
• Sentinel-2 images may be used to support
morphology and gates visual mapping and
validation. The spatial resolution may be just on
the limit. Acquisitions with good visibility are
fine for gates but hardly recognize airplanes.
• Sentinel-1 can also support the identification of
runways and build-up areas, but GRD IW High
Resolution products have a spatial resolution
less than 25 m.
• Some cases may need commercial very high-
resolution images.
• OSM does not offer a complete mapping
solution on all cases analysed. Not all airports
have gates identified in OSM.
• Additional support photos and maps may be
used for morphology and gates. Note that
Airport Buildings do not have clear boundaries.
They are often confused with surrounding
buildings (hotels, etc…).
The mapping conclusion is that the acquisition
frequency of Sentinel is a great benefit and the
solution shall definitely be based in a combination of
different sources.
4 MONITORING THE AIRPORT
CHANGES
The usage of the change detection methods could be
useful to trigger airport morphology changes. The
two typical binary land cover changes that we want
to detect are:
• Urban to Demolition
• Null Soil/Vacant Land/Demolition to Urban
In this context, two detections approaches were
evaluated:
a) Change detections with Sentinel-2: detect
abrupt changes using image pairs, before and after
the event, and a reasonable number of pixels
(between 9=3x3 a 25=5x5).
b) InSAR with Sentinel-1: use an InSAR
technique to detect surface deformations upon
analysis of the phase difference between two radar
signals acquired from the same area at different
times. The usage of Advanced InSAR for the
identification of hotspots subsidence at airports was
kept in standby at this stage. Although it may
resolve millimetre-scale movements of
infrastructure, the usage of multiple images was
considered having high costs (storage and
computation).
4.1 Study Area
The area selected for testing was the Rio de Janeiro
airport, which was renewed for the 2016 Olympic
Games. The works started in 2014 and finished in
Abril 2016.
Figure 9: Google Maps historical data of Rio de Janeiro
airport.
The gates were extended with a new area and
more car parks were constructed.
4.2 Detecting Changes with Sentinel-2
The pair of S2 images selected for testing were the
first cloud-free image available from this airport
(Fig. 10): one image was acquired in 2015 during
renewal, and the other in 2016 after renewal.
GISTAM 2018 - 4th International Conference on Geographical Information Systems Theory, Applications and Management
54
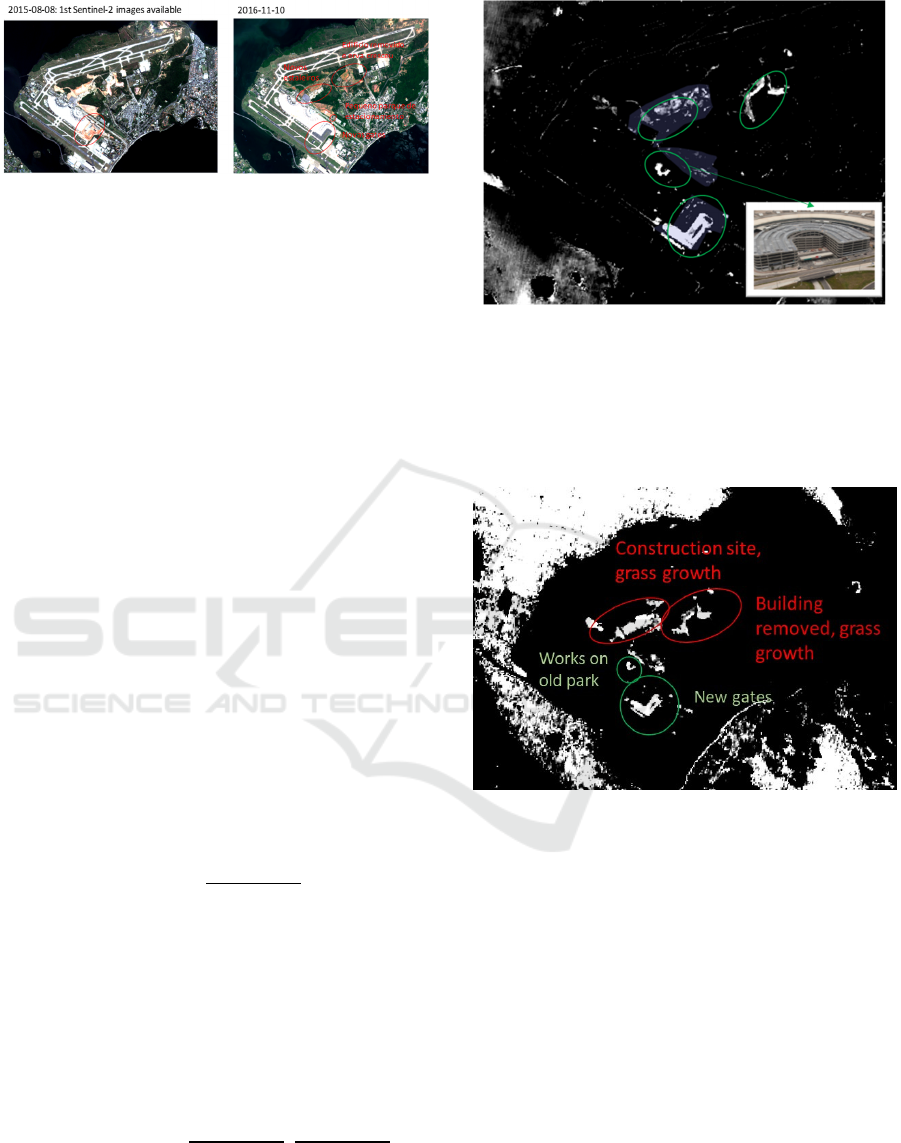
Figure 10: Sentinel-2 images used in change detection.
For change detection using a pair of images three
main categories of methods could be used:
• Simple Detection: use Mean Difference, Ratio
Of Means or Root Mean Square Differences of
the relevant bands (typically visible and near
infrared bands 2, 3, 4 and 8)
• Normalized index change detections: produce
normalized indicators related to built-in areas
(using S2 bands) and compare them. The most
relevant index is the Difference Built-up Index
(NDBI) applied in Landsat TM with SWIR1
and NIR bands (Zha et al., 2003).
• Post Classification Comparison: make
supervised classification of the pairs and
compare results (e.g. land cover comparison,
Built-up Areas comparison)
In this paper, only the first two categories were
analysed and presented hereafter. Post Classification
was abandoned since it was considered more
relevant with global and regional scales (world,
country, regions) rather than local scales such as the
airports gates details.
Ratio of Means Detection with NIR Band
This analysis started by using simple detectors. The
ratio of means was firstly used with NIR band (B8)
from Sentinel-2.
,
2015
,
2016
,
The achieved results were quite acceptable, allowing
to easily identify the new gates area and the
reconstructed car park that was not initially
identified during google maps inspection.
Although this detector was successfully applied
on Rio airport study area but it needs to be bounded
and normalized to be applied widely on other
airports:
,
1min
2015
,
2016
,
,
2016
,
2015
,
Figure 11: Change detection with NIR.
Ratio of Means Detection with SWIR Band
The second approach was the ratio of means using
the SWIR band (B11) from Sentinel-2. Although
this band has lower spatial resolution, the results
achieved are also quite acceptable.
Figure 12: Change detection with SWIR.
Note that this detector needs also an
improvement in order to be bounded and
normalized.
Root Mean Square Differences Detection with 4
Bands
The third detector was the Root Mean Square
Differences computed with the visible and near
infrared bands (B2, B3, B4 and B8). Because the
obtained results are unclear, it was dropped.
NDBI Index Detection
The last multispectral detector was the Normalized
Difference Built Index (NDBI), which is referred in
the change detection literature as a promising
method (Jensen, 2015; Zha et al., 2003). For its
Mapping and Monitoring Airports with Sentinel 1 and 2 Data
55
usage with Sentinel-2 imagery, the S2 SWIR and
NIR bands were used as follows:
,
_11
,
_8,
_11
,
_8
,
Nonetheless, the change detection results with NDBI
2015 and NDBI 2016 obtained confusing results.
Figure 13: Change detection result with NDBI 2015-2016.
The change detection conclusion was that simple
detectors with NIR and SWIR bands could solved
the problem on this study area. The usage of these
bands shall be further verified and confirmed on
other airports. The usage of spectral unmixing
techniques at pixel level with significant changes on
land cover could be an alternative approach for a
future analysis to fine-tune the detections.
4.3 Interferometry Processing with
Sentinel-1
For the analysis of the interferometry processing, a
pair of Sentinel-1 images from 2015 and 2016 were
used. Both images were acquired in IW mode with
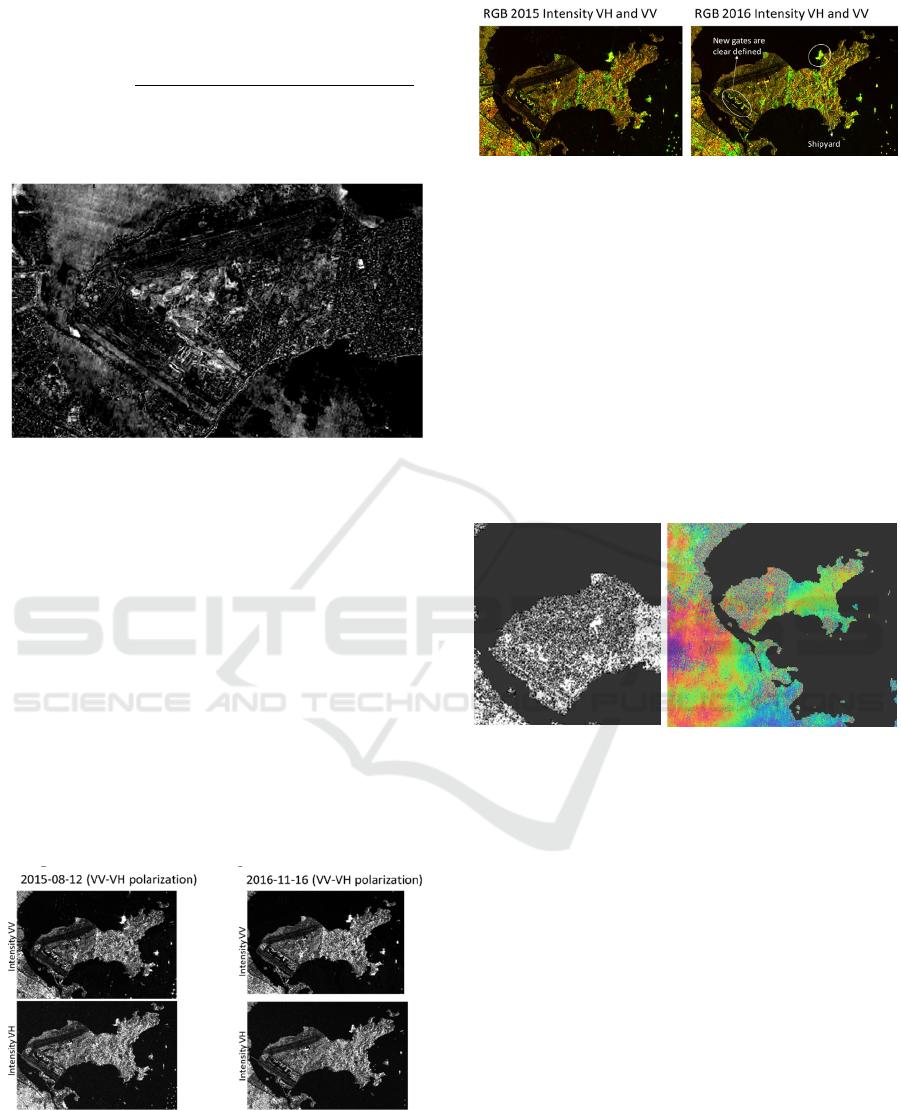
dual polarization VV-VH (Fig. 14).
Figure 14: IW product pair used in change detection.
The GRD products were used to produce a RGB
colour-composite from VH and VV polarization
images. The composites allowed to identify the
extended gates in 2016 (Fig 15).
Figure 15: RGB composition of S1A IW VV-VH pair.
The SLC products were used for the
interferometry processing. The pair of products were
captured in IW mode with three sub-swaths (IW1,
IW2 and IW3) using Terrain Observation with
Progressive Scans SAR (TOPSAR). The SNAP
(Sentinels Application Platform) tool was used,
following TOPS Interferometry Tutorial (Veci,
2015). The co-registration of IW1 relevant sub-
swath was performed, the interferogram was
produced, the topographic phase was removed and
the phase filtering was applied. The interferogram
results after the ellipsoid correction are in the figure
below.
Figure 16: Coherence and phase interferogram 2015-2016.
The results were not effective. Although the
interferogram requires a detailed interpretation, this
preliminary analysis did not spot relevant changes
on coherence and phase interferogram. Additionally,
the spatial resolution of the IW acquisitions may not
be sufficient for the monitoring cases.
5 CONCLUSIONS
The study confirmed that several OpenstreetMap
and Google Maps information of the airports are
incomplete or outdated. Although, Sentinels lacks
spatial resolution, they can be an advantage to
validate and trigger mapping improvements. The
acquisition frequency of both Sentinels is considered
a great benefit to assure up-to-date information at a
global scale.
GISTAM 2018 - 4th International Conference on Geographical Information Systems Theory, Applications and Management
56
The recommended SCRAMJET approach for a
target of 200 airports is to do mapping assisted by
Sentinels and eventually other commercial EO data,
and to monitor changes using a Sentinel-2 semi-
automatic change detection method.
Mapping
The mapping solution shall be definitely based in a
combination of multiple sources, including
OpenstreetMap, Sentinels, Google Maps, local
photos and other commercial EO data.
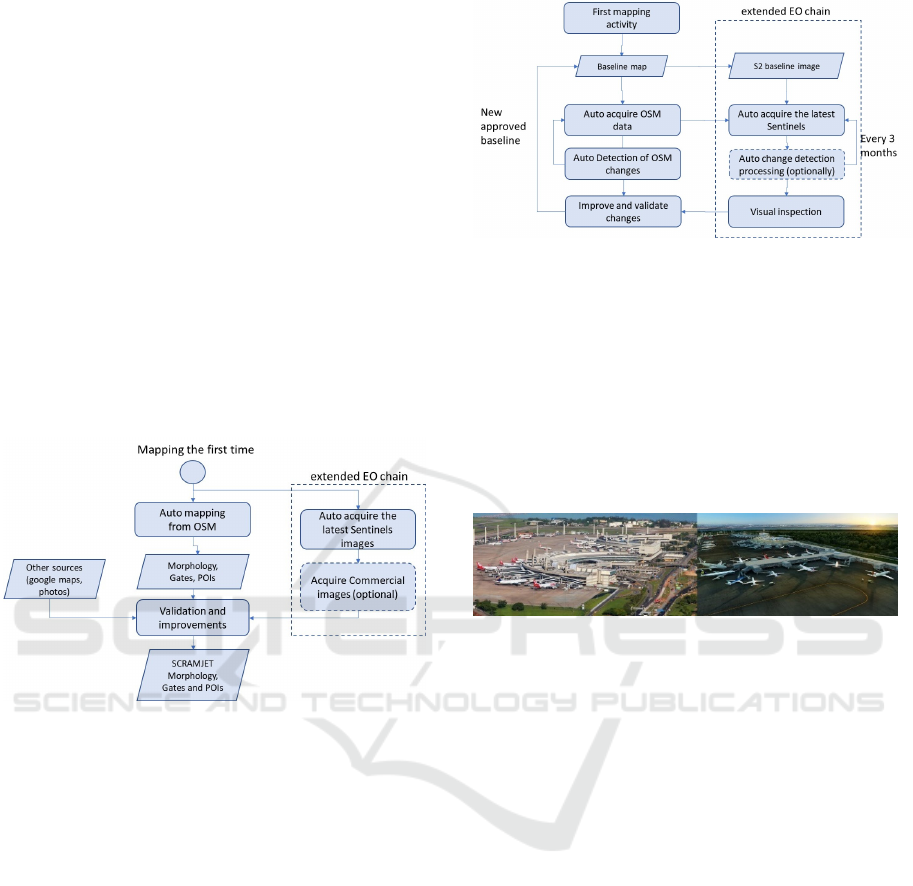
The system shall extract the relevant OSM data
to create an initial mapping information. An
extended EO chain (Figure 17) is recommended with
automatic data acquisition and pre-processing of
Sentinels data. The Sentinels data shall be used for
mapping validation and trigger improvements based
visual inspection of Sentinels and other
complementary sources.
Figure 17: Mapping solution with EO extended chain.
Monitoring Changes
The foreseen solution is also to integrate extended
EO change detection with the OSM change
detection, checking changes every 3 months as
depicted in Figure 18.
The semi-automatic change detection with
Sentinel-2 is suggested, taking advantage of its
update frequency. Implementing an automatic
detections is technically feasible to generate alerts
but it will require a visual inspection to confirm and
trigger the updates. The change detection algorithm
needs to select cloud free images, normalize the
processing and finally fine-tuned algorithm with a
wide number of airports to become fully automated.
The automation shall consider the costs of creating
EO baselines (storage) and processing EO images
(computing).
The changes detected with S2 are real and faster
but they will probably include many false positives
while the changes detected from OSM are more
accurate but more delayed.
Figure 18: Monitor changes extended with S2 detections.
An initial automated proof-of-concept to validate
the study conclusions is recommended as a next
step. A pilot with 3-4 airports shall start by
automating data acquisition and pre-processing for
mapping purposes. The change detection processing
chain with NIR and SWIR bands shall be further
analysed with alternative approaches and automated
afterwards in order to start collecting results and to
fine tune the algorithm.
Figure 19.
ACKNOWLEDGEMENTS
This work was developed by BLUECOVER to
WATERDOG under the ESA BIC Portugal contract.
The work of Gil Gonçalves at INESC-Coimbra was
supported by Foundation for Science and
Technology (FCT) of Portugal under the project
grant UID/MULTI/00308/2013.
A special thanks to WATERDOG and ESA BIC
Portugal for the publishing authorization.
REFERENCES
Aytekin, Ö., Zongur, U., Halici, U., 2013. Texture-based
airport runway detection. IEEE Geosci. Remote Sens.
Lett. 10, 471–475. doi:10.1109/LGRS.2012.2210189
Ban, Y., Webber, L., Gamba, P., Paganini, M., 2017.
EO4Urban: Sentinel-1A SAR and Sentinel-2A MSI
data for global urban services. 2017 Jt. Urban Remote
Sens. Event, JURSE 2017 0–3.
doi:10.1109/JURSE.2017.7924550
Haas, J., Ban, Y., 2017. Sentinel-1A SAR and sentinel-2A
MSI data fusion for urban ecosystem service mapping.
Mapping and Monitoring Airports with Sentinel 1 and 2 Data
57

Remote Sens. Appl. Soc. Environ. 8, 41–53.
doi:10.1016/j.rsase.2017.07.006
Jensen, J.R., 2015. Introductory Digital Image Processing:
A Remote Sensing Perspective, 4th ed. Prentice Hall
Press, Upper Saddle River, NJ, USA.
Malenovský, Z., Rott, H., Cihlar, J., Schaepman, M.E.,
García-Santos, G., Fernandes, R., Berger, M., 2012.
Sentinels for science: Potential of Sentinel-1, -2, and -
3 missions for scientific observations of ocean,
cryosphere, and land. Remote Sens. Environ. 120, 91–
101. doi:10.1016/j.rse.2011.09.026
Veci, L., 2015. SENTINEL-1 Toolbox SAR Basics
Tutorial. Esa 1–20.
Wang, X., Lv, Q., Wang, B., Zhang, L., 2013. Airport
detection in remote sensing images: A method based
on saliency map. Cogn. Neurodyn. 7, 143–154.
doi:10.1007/s11571-012-9223-z
Zha, Y., Gao, J., Ni, S., 2003. Use of normalized
difference built-up index in automatically mapping
urban areas from TM imagery. Int. J. Remote Sens.
24, 583–594. doi:10.1080/01431160304987
GISTAM 2018 - 4th International Conference on Geographical Information Systems Theory, Applications and Management
58
