
Developing a Power Efficient Private Cloud Ready Infrastructure for
Small-Medium Sized Enterprises
Emmanuel Kayode Akinshola Ogunshile
Department of Computer Science, University of the West of England, Bristol, U.K.
Keywords: Cloud Services, Solar Energy, Energy Storage, Digital Systems.
Abstract: Digital technology is advancing and the means of powering it so. For small-medium enterprise (SME) to
remain competitive in today’s economic climate it is paramount they can respond to business challenges with
agility and efficiency. Despite knowing this, many of today’s SMEs retain legacy hardware and siloed
infrastructures that are both expensive to maintain and incapable of being agile. These heterogeneous
infrastructures offer no elasticity for its consumers and act as a barrier to its own innovation. Acquiring
requisite budget to transform such digital infrastructure with high operational energy costs has proven an
uphill struggle as there is a distinct lack of perceived benefits from undergoing such transformation program.
However, amidst the various comparable options, claims, and features from different technology vendors
available in the market there are true benefits applicable to all SMEs. To demonstrate how a solution such as
moving to the cloud and or adopting solar power could benefit a SME’s infrastructure, and operational costs,
the requirements of a fictitious Marketing Agency have been analysed by a company specialised in cloud,
virtualisation and solar power to introduce a framework suitable for any SME curious of the benefits presented
by basic cloud principles, virtualised resources and renewable energy.
1 INTRODUCTION
Cloud computing is a field of study hindered by
misunderstanding and confusion. This is due to the
term Cloud being used to describe many services that
aren’t clouds. Cloud computing is more than server
virtualization and, is best described by NIST in the
following quote, "Cloud computing is a model for
enabling ubiquitous, convenient, on-demand network
access to a shared pool of configurable computing
resources (e.g., networks, servers, storage,
applications and services) that can be rapidly
provisioned and released with minimal management
effort or service provider interaction." (Brown, 2016)
To develop an understanding of cloud and its
potential benefits to a SME the Cloud Company,
“Infrastructure Revolutions Ltd”, will be analysing
the business challenges and requirements of a
fictitious SME with the view to combat and or address
these challenges using implementable Cloud
solutions and solar technology. Though this paper
pays homage to the fundamental benefits of moving
to the cloud such as “simplified management
lifecycles”, the main area of focus for this paper will
be on the everlasting benefits to an infrastructure’s
Power Consumption.
The example SME featured in this paper is a
Marketing Agency with expendable income that has
been allocated for internal growth. Its commonplace
for SMEs to invest in internal growth so deciding how
this income will be invested should outline a
repeatable framework for businesses of a similar
standing. Infrastructure Revolutions Ltd performing
the IT overhaul are experts in the virtualization, cloud
and solar market, meaning focus will go beyond
converging the SME’s Infrastructure.
To address the identified challenges and
requirements of the fictitious SME, the paper has
been organized as follows: Section one introduces the
paper, Section two researches and analyses the SME,
section three the fundamentals of cloud computing
deployments, section four the cost analysis of
implementing a private cloud solution, section five a
cost benefit analysis of supporting an IT
infrastructure via Solar power, section six the paper’s
proposed solution and section seven the conclusion.
Ogunshile, E.
Developing a Power Efficient Private Cloud Ready Infrastructure for Small-Medium Sized Enterprises.
DOI: 10.5220/0006641002990309
In Proceedings of the 8th International Conference on Cloud Computing and Services Science (CLOSER 2018), pages 299-309
ISBN: 978-989-758-295-0
Copyright
c
2019 by SCITEPRESS – Science and Technology Publications, Lda. All rights reserved
299
2 BUSINESS CASE
Throughout this paper, the research will relate back to
the fictitious business case outlined in this section.
This is done to both provide direction for the research
and to enhance the understanding of the implications
of implementing cloud computing from a siloed
infrastructure.
2.1 Business Background
The SME that will be analyzed in this paper is “Good
Impressions Ltd” (GIL). GIL is a Marketing Agency
that currently employs 80 staff members with
expansion on the horizon. Established in 2007, GIL is
a business based in Buxton (Derbyshire) that has
experienced expediential growth over its 10 years of
business. This rapid growth has resulted in much of
the business’s equipment not being updated and only
being scaled for demand. The legacy systems
currently in operation at GIL are all owned and
managed in house. Though GIL’s IT department
would like to continue to manage their datacenter
locally there is little opposition within the board of
directors in moving their datacenter offsite as running
costs are becoming too high.
Presently, an investment of £25,000 has been
allocated to GIL’s IT department for the
infrastructure overhaul. James Shaw, the Chief
Financial Officer, has advised that the main objective
of this investment should be to negate the upsurge in
running costs but has also provided no detail on the
semantics of achieving this.
Despite the given issues that accompany a siloed
infrastructure being IT Sprawl (Defined as a situation
in which multiple, under-utilized resources take up
more space and consume more resources than can be
justified by their workload), high running costs, and
problematic scalability other departments have also
expressed problems they hope the planned
remediation will resolve.
Sales Executives have raised concerns of
accessibility when at a Customer Site. GIL’s current
infrastructure doesn’t allow for its employees to
access locally stored data from a PC not on the
network. The production departments also have
problems with the current file servers having
insufficient storage (Each requires 2TB).
Furthermore, the tower server currently being used
for video rendering is expensive to enhance,
inconsistently used, and has been sporadically
rebooting since July 2016 (6 Months).
2.2 Stakeholders
In the section below, there are two tables outlining
GIL’s Organizational structure and the stakeholder’s
key comments.
Table 1: GIL Organization Structure.
Department Title Name
- CEO Frank Smith
Finance CFO James Shaw
Sales VP Harry Truman
IT CIO Jessica Cox
Production DH Jon Marston
The second table in this section, outlines how the
problems discussed in Section 2.1 are aligned to the
internal stakeholders at GIL.
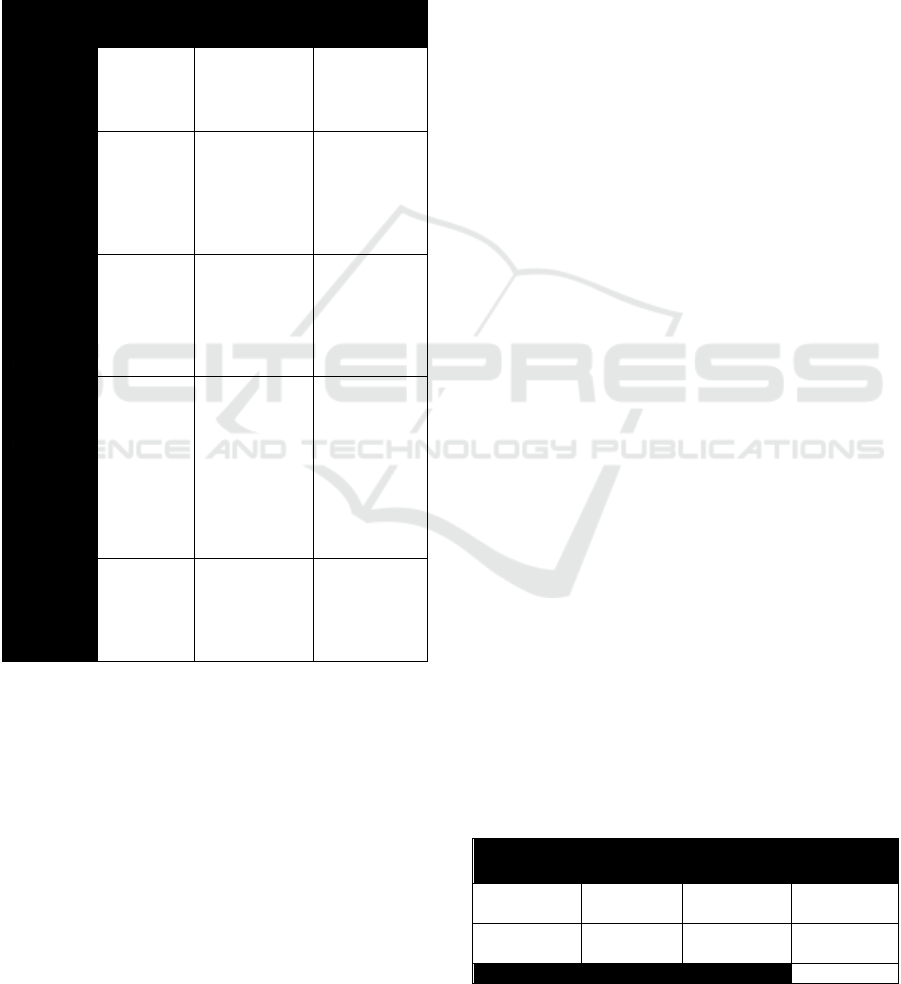
Table 2: Stakeholder’s Key Comments.
Name Comments
Frank Smith
“Create a greener infrastructure
to enhance the company’s
public image”
James Shaw
“A reduction in datacentre
operational costs”
Harry Truman
“More Support for a mobile
workforce and more storage”
Jessica Cox
“A simplification of datacentre
lifecycle management and agile
scalability”
Jon Marston
“Document Version Control
and easier file sharing”
2.3 Current Hardware
The last table below outlines all the hardware
(Personal Computers, Telephones etc. excluded) that
GIL owns and the problems currently related to them.
CLOSER 2018 - 8th International Conference on Cloud Computing and Services Science
300
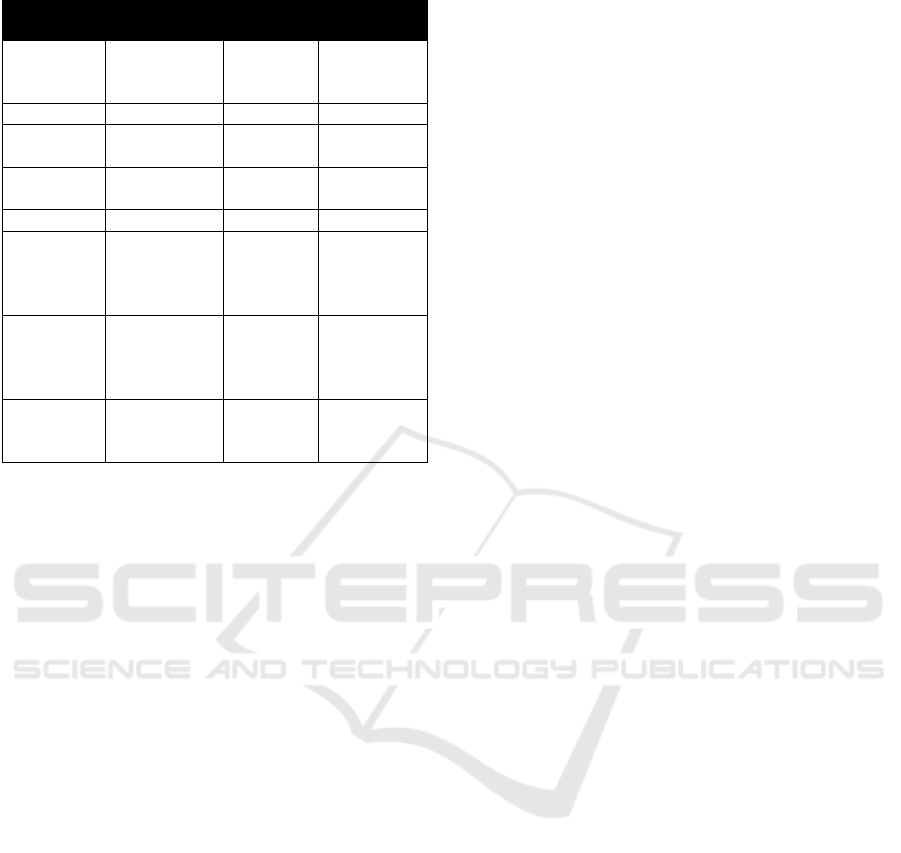
Table 3: Current Hardware & Utilization.
Server Role Dept. Problem
DNS1 AD and
DNS
Server
IT N/a
PRNTSRV Print Server IT Slow
DHCP1 DHCP
Server
IT N/a
MailSrv Exchange
Server
IT N/a
FS1 File Server Finance N/a
FS2 File Server Sales Insufficient
Data Storag
(Currently
1TB)
FS3 File Server Prod Insufficient
Data Storag
(Currently
1TB)
ProdSrv1 Rendering
Tower
Prod No back-up /
Server
Failure
2.4 Summary of Requirements
After reviewing GIL the following observations were
made:
1. The new solution must cost no more than
£25,000 to buy and implement.
2. The new solution must reduce datacenter
power consumption.
3. The new solution must resolve the following
department issues:
a. The sales and production files ser-
vers have insufficient storage and
need to be doubled (2TB each).
b. The Production rendering Server is
expensive to maintain and is
rebooting sporadically.
c. The Sales Department would like
easier Offsite Access to file stored
on the network.
d. The Print server requires more
compute power.
4. The new solution must simplify IT
management and introduce agile scalability.
5. The new solution shall produce a return on
investment within 9 years.
6. The Datacenter should remain onsite in
Buxton.
Business Objective: “To produce a greener
infrastructure that is, easier to manage, consumes
less electricity, and costs less to operate.
To measure the fit criteria of the solution
proposed in this paper each solution will reference the
requirements and business objective listed above.
3 PUBLIC CLOUD PROVIDERS
Cloud Computing is a competitive market with most
large enterprises having a stake. Many familiar names
in computing such as Adobe, Microsoft, Google and
IBM now offer a cloud service. The 3 most successful
public cloud providers are Microsoft (Azure / Office
365), Amazon and IBM (Olanubi, 2016) as they
currently provide 50% of the world’s cloud
computing services (Olanubi, 2016).
Despite all vendors competing in the same field
there is little correlation between both the services
and and how they charge for them.
In cloud computing the two most popular models
are “pay-as-you-go” and “subscription” but each of
these models have spawned sub-models for more
specific needs. The IaaS or PaaS models implemented
by Azure, Amazon AWS and BlueMix tend to be pay-
as-you-go but SaaS like Office 365 and Adobe
Creative Cloud tend to be Subscription. So with
varied choice being a fallacy, there will be five
pertinent factors affecting cost with any given
solution (Al-Roomi et al., 2013):
1. Initial Costs – The amount of money that a
service provider spends to buy the resources*.
2. Lease Period – This is the period in which the
customer pays to have those resources
allocated to them.
3. QoS (Quality of Service) – This is the set of
technologies and models offered by the
service provider to enhance the user
experience i.e data privacy, availability,
support, and redundancies; IaaS, PaaS or SaaS
service models.
4. Age of Resources – Some vendors will offer
clusters of resources pooled from legacy
hardware for a cheaper price. However, as
indicated, this also means newer resources can
be pooled and leased at a more expensive price.
5. Bandwidth – Whether a resource is turned off
or on, in high demand or low different vendors
will commonly adjust their costs accordingly.
*Becoming less common. These costs are often
liquidated and covered by the cost of the lease
When selecting a cloud computing vendor three
aspects have to be weighed: Pricing, QoS and
Utilization. A customers requirements will subjectively
Developing a Power Efficient Private Cloud Ready Infrastructure for Small-Medium Sized Enterprises
301

be used to decide what aspect yields the most benefits.
Figure 1 included below best displays the components
of each aspect and gives an idea to how a public or
hybrid cloud solution is priced.
Figure 1: The Aspects of Pricing Public Cloud.
Microsoft (Azure)
Microsoft Azure has elements of an IaaS and a PaaS
(Microsoft, 2017) as it provides Virtual Machines and
Windows products such as Windows Server 2012 on
demand. Alongside supporting IPv6, Azure also
allows a consumer to integrate Office 365,
Microsoft’s strictly SaaS hosting service for all office
suite applications. Both Office 365 and Azure can be
adopted separately or as a pair; adopting Office 365
however, is becoming one of the most popular cloud
services present in hybrid clouds.
Available in 140 different countries and boosting
a Standard Service Level Agreement of 99.95%
(Microsoft, 2017), a standard higher than an
independent SME’s, Azure is highly practical.
However, quantifying a cloud vendor such as Azure
is difficult as it includes many features that are
subjective thus unquantifiable i.e. license
management systems, flexible provisions, layer 7
Load balancing with built in HTTP.
As of 2016 Microsoft has discontinued their
subscription based service for Azure. However, the
price of the service can be measured by their “pay-as-
you-go” model. Using the Azure calculator
(Microsoft Pricing calculator, 2017) we know a basic
tier server with 1 core, ~2GB of RAM and 1TB
storage, can be provisioned with a SLA of 99.5% for
£34.12 a month; £1.14 a day or £409 a year. This
server would be an alternative to the Sales File server
currently in operation at GIL if an extra tb was added
and be easily expandable.
Amazon
“Amazon Web Services” (AWS) is both a SaaS and
an IaaS. A reliable cloud service that has been
entrusted with hosting Netflix’s Media Service.
Similar to Azure, AWS offers a pay-as-you-go service
that can be paid monthly or be paid upfront for a
reduced price. The payment model for AWS is more
complex than Azure as acquisition costs, number of
total users, and projected number of interactions a
second are all factored into pricing. However, using
the AWS calculator we know a server on a 3 year
lease with 1 core, 2GB of RAM and 1TB storage, can
be provisioned for £12.32 a month; £0.44 a day or
£147.84 a year. This server would be a cheaper
alternative to the Sales File server currently in
operation and would be easily expandable.
IBM
IBM is the third most popular cloud vendor and is the
only cloud vendor with a subscription model and the
only service to offer all three service models
(Olanubi, 2016). Their cloud Service “BlueMix”
simplifies Cloud management and makes desirable
solutions such as big data analytics easily integratable
through pre-built configurations. Much like AWS
IBM’s payment model is complex as predictable
usage can be billed as a subscription or the pay-as-
you-go service also factors in usage, bandwidth and
more. However, using the IBM calculator we know a
server on a 3 year lease with 1 core, 2GB of RAM and
1TB storage, can be provisioned for $98.45 (£78.60
with an exchange rate of 0.80) a month; $3.28 a day
(£2.63) or £943 a year. This server would be an
alternative to the Sales File server currently in
operation and be easily expandable but be much more
expensive, even without the extra storage.
Office 365
Office 365 is a SaaS, subscription based Microsoft
cloud venture. It encompasses all Microsoft office
applications
plus other productivity services such as
Skype for Business, Exchange Online and OneDrive.
For £9.40 a single employee can have access to the
aforementioned office applications and services. Office
365 would make an exchange server redundant in an
SME as 50GB is allocated to each user. With 1TB of
personal storage allocated to each user and a 1TB Team
site (incremented by 50GB per account) file servers
could also be retired. However, 80 office 365
subscriptions at £9.40 is £9,024 annually. A figure too
high for consideration.
Adobe Creative Cloud
Like Office 365, the Adobe Creative Cloud (ACC) is
strictly a SaaS. The purpose of this service is to supply
CLOSER 2018 - 8th International Conference on Cloud Computing and Services Science
302
the entire collection of Adobe products from photoshop
to Adobe XD. Joining the ACC prompts such benefits as
efficient content creation, version consistency, and cloud
storage. For an Enterprise, the ACC offers license
subscriptions for as little at £11.99 per person, per
month, per application or £38.99 per person, per month.
The business case could greatly benefit from a
subscription to this service as it would eliminate onsite
storage problems and improve collaboration efforts.
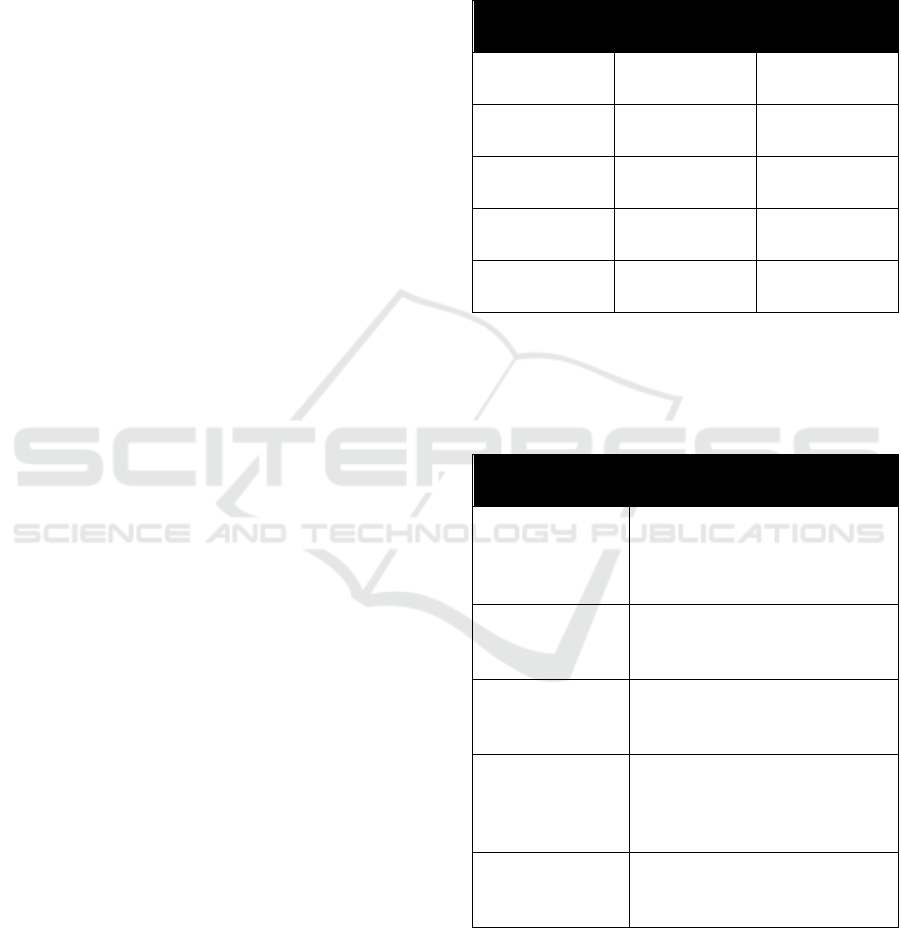
Table 4: Pros and Cons of Cloud Vendors.
Company Approach Pros Cons
Amazon
Pay-as-you-
go
Cheapest IaaS,
reliable
Small
Catalogue of
services
Microsoft
Pay-as-you-
go
Large Catalogue
of service and
integrates with
Office 365
seamlessly
Unfinished
IBM
Subscription
or
Pay-as-you-
go
Subscription
Model, offers
all 3 service
models, easy to
deploy solutions
Expensive
Office 365
Subscription Constantly
updated,
Collaborate
easily, reduces
strain on IT
departments,
work anywhere
Requires
internet, feature
set changes
forced,
underutilization
of functionality,
expensive in
bulk
Adobe
Creative
Cloud
Subscription Constantly
updated, low
initial costs,
remote access
Requires
internet,
Inconsistent
pricing history
All of the public cloud vendors mentioned above are
currently available to the general public and common in
SMEs. There are many advantages to this cloud solution
including:
1. Data availability and Resiliency
2. Technical Expertise and Support
3. Flexibility
4. Inexpensive Initial Costs
5. Resource Optimisation
The three most prominent drawbacks to a private
cloud are Data security, constant costs and the fact they
never offer a return on investment, only a reduction in
spending in some circumstances.
Recommendations
After analyzing the potential public cloud vendors, it
would appear, that for GIL, moving to a public cloud or
hybrid cloud isn’t cost efficient.
With 80 office subscription being close to £10,000
and a like for like infrastructure with AWS that doesn’t
meet the requirements being over £1,500 there is little
attraction to public cloud. Besides there being no upfront
costs or the need to remediate servers every 5-9 years,
which are a big expense not accounted for in this paper.
If the company was smaller a SaaS based public cloud
infrastructure could have been a potential solution but
not for a SME of GIL’s size.
4 CALCULATING EXISTING
POWER CONSUMPTION
4.1 Mathematical Optimisation
To propose the best cloud solution, we must first
establish the current infrastructure’s annual cost
projections. This is done by factoring in 2 reoccurring
costs. Though lighting, property (if not bought outright),
labour, and networking all effect pricing the largest
tangible factors of running a datacenter are:
1. Running Costs
2. Cooling Costs
The price of energy will vary by location but in the
interest of the business case and this paper, power will
hold the constant value of £0.14 per kWh (Average cost
per kWh of electricity in the UK according to the Energy
Saving Trust, March 2016).
As GIL is one of the many partners of Hewlett
Packard Enterprise all their servers have been bought
from HPE and can thusly have their power consumption
estimated through the “HPE Power Assist Tool”. To
apply the business case, we must calculate the total
power usage of the 7 rack servers and 1 tower server.
The rack servers currently in production are all “Proliant
DL380 G6s” and the tower server currently in operation
is a “ProLiant ML370 G6”. The Proliant DL380 G6’s
max Watt Usage per hour, is 131.11 W and the Proliant
ML370 G6’s max is 425.32.
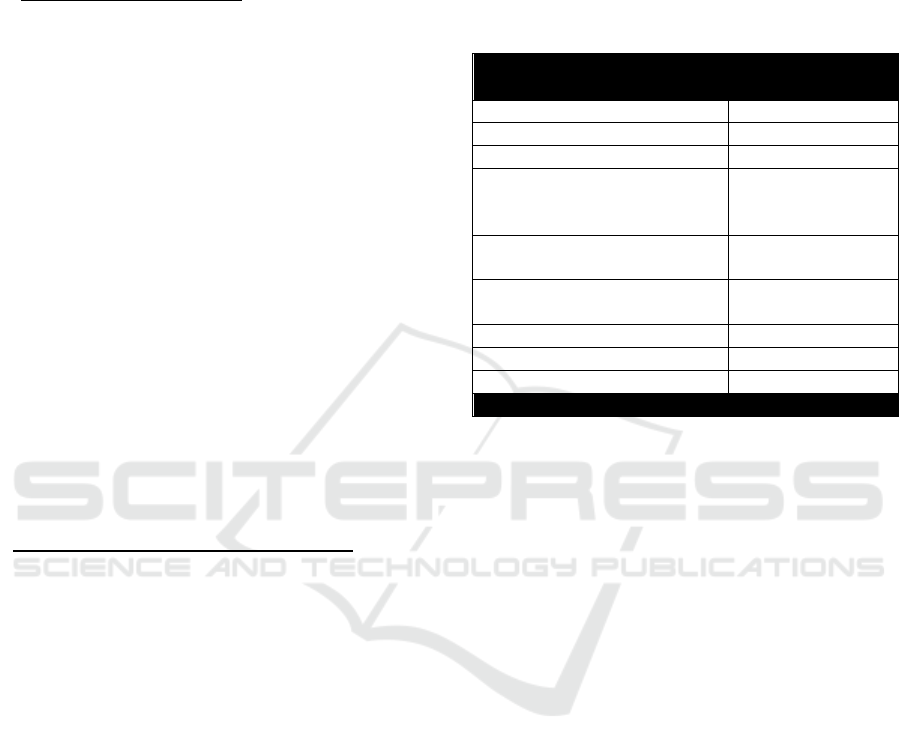
Table 5: GIL’s Total Wattage.
Model Watt Amount Total Watt
Proliant
DL380 G6
131 W 7 917.77
ProLiant
ML370 G6
425 W 1 425.32
Total 1343.09
Developing a Power Efficient Private Cloud Ready Infrastructure for Small-Medium Sized Enterprises
303
Running Costs
After receiving the datacenter’s Watt usage per hour, it
is possible to calculate the annual costs using the
formula below to convert power consumption figures
into, kilwatts and then running costs:
(
∗
1000
)=kWh*ElectricityCostperkWh
(1)
Using this formula, we can calculate the annual running
cost of the datacenter to be £1647.17.
Cooling Costs
Cooling costs are the second quantifiable factor that can
be measured to analyse a company’s operational costs.
To do this we must know how many British Thermal
Units the datacenter produces. A British Thermal Unit
(BTU) is defined as the amount of energy needed to raise
the temperature of 1 pound of water by 1 degree
Fahrenheit. The following formula can be used to
calculate a datacenters BTU:
=∗3.14(2)
(2)
Since we have already establishing that GIL uses 11,757
Kilo Watts per hour we can use the cooling cost formula
to calculate the Datacenter’s BTU; 4217.30026 BTU.
After establishing both a datacenters Watt usage and
BTU the following widely used formula can be used to
calculate, kwh then cooling costs:
(
∗ℎ
)
∗0.293
1000
=ℎ∗ℎ
(3)
Using this formula, we can estimate that a minimum of
£1515.43 a year is being spent on cooling.
Adding this figure to the running costs we can
establish that the annual cost of running and cooling
GIL’s datacenter is £3,162.59.
4.2 Creating and Costing a Private
Cloud
To create a private cloud one must attain the components
that make a private cloud possible. GIL is a partner of
HP so for this paper we will be converging their
infrastructure using HP software and hardware when
appropriate.
Converged Infrastructure Cost
To attain a private cloud GIL could virtualize and
consolidate their current infrastructure, add storage,
install relevant software and have a private cloud.
However, this project’s objective involves considering
the longevity of the datacenter and missing an
opportunity to reduce cabling, reduce consumption and
easy future scalability would be counterproductive.
For this reason, attaining the following hardware and
software displayed in table 6 has been proposed to
optimize efficiency, reduce operational costs and
enhance flexibility.
Table 6: Cost of Converged Infrastructure Cloud.
Software Cost
Windows Server 2008 R2 x 2 N/a
Convergence Tool (OneView) Free
Cloud Platform (OpenStack) Free
VSphere Essential Kit (No
Vcentre, 3 servers with 2 cores
each license)
£430.50 [30]
HPE BLc3000 Enclosure (2
Pwr, 6 fans)
£5,443 [26]
HPE ProLiant BL660c Gen9
(20 Cores, 64GB Ram, 1TB)
£10,290 [27]
HPE Storageworks D2200sb £1,368.42 [28]
9 x 1TB 6G SATA £1,251.72 [29]
Networking and Cabling N/a
£18,923 (£17,030.8 with HPE Partner discount)
GIL’s current infrastructure has 18 Cores, 18GB of
RAM, 8TB of storage and no redundancies. By having
no power or cooling redundancies GIL datacenter would
be considered a Tier I datacenter.
If GIL were to purchase the proposed technology in
table 6 their datacenter would have a resource pool of 20
Cores, 64GB of RAM and 11TB of storage, with power
and cooling redundancy. Thus, classifying the new
infrastructure as a tier II datacenter. Additional memory
has been added to host new software and give
Production and Sale an extra TB of storage. One core
has also been allocated to the print server to enhance
processing power.
Using HPE’s “Power Advisor” and the formulas
mentioned in earlier section we can calculate the private
cloud’s operational costs to be £1,843 a year (13,169
Kw), £1,318.87 less (9,420 kw less).
5 SOLAR TECHNOLOGY
As public image makes or breaks a company and the
future price of electricity becomes unpredictable
exploiting solar energy to produce electricity is
becoming a widely-adopted greener alternative to the
grid.
Breeze claims that, despite incurring few early
adopters due to high initial costs, skepticism and fears of
inefficiency, solar power has really grown in the last
three decades. However, it’s important to note that solar
CLOSER 2018 - 8th International Conference on Cloud Computing and Services Science
304
power still isn’t an all-encompassing solution to the grid.
There are four key factors that one needs to consider
outside of cost when analyzing a solar powered
infrastructure.
The first factor is, the direction/ angle of the roof,
second, any shading that could impede on production,
third, the space allocated to the solar panel installation
and finally, the time of year. In some hotter countries
temperature will also have to be considered as a fifth
factor to insure panels don’t over heat, fortunately for
the UK however, this isn’t a worry.
In this paper, the business case experiences no space
limitation and no hard shading. For this reason, an
accurate cost benefit analysis can be made from the
following main considerations: Solar panels cost &
efficiency, hours of sunlight, and the angle of the panels.
5.1 Solar Panels Cost & Efficiency
Akin to all other fields of technology there is a plethora
of hardware that all try to achieve a common goal. In
Solar Technology, there are many types of solar panels
currently in production. The three most popular panels
according to the Eco Experts are: Monocrystalline,
Polycrystalline and amorphous (“Thin Film”).
Each manufacturer should provide an in-situ
efficiency rating for what's possible on a typical
installation, called the PTC (Performance Test
Conditions) rating. Efficiency ratings are established in
a lab by projecting 100 Watts of sun light on to a solar
panel and measuring the output; normally between 10-
20%. According to the eco expert, PTC rating have an
accuracy rating of 85-95%. For this reason, all efficiency
rating in this paper will be deducted the average; 10%.
Monocrystalline
The Eco Experts defines Monocrystalline solar panels as
using wafer thin cuts of silicon crystals. Since
monocrystalline panels are made out of the highest-
grade silicon and cut under strict guidelines they’re
known to produce the highest levels of efficiency.
SunPower, a prolific manufacturer of Monocrystalline
Panels, has achieved record breaking efficiency ratings
of 21.5% PTC on their latest X21-345 model.
Described as the “cleanest panels” on the market
Monocrystalline solar panels also have the longest
warranties and take up the least space due to their high
efficiency. There would be little competition to be had in
this section of the paper if they also weren’t the most
expensive panels to manufacturer and purchase.
SunPower do not publicly publish the cost of their
solar panels so this panel will not be used in the
comparison, as a substitute the Perlight PLM-300M-60
MONO will be used instead.
Table 7: Information Taken from the Product Information
page on BuyPVDirect.
Model
PerLight PLM-300M-60
MONO
Max. Output
300w
Max. Efficiency
18.9%
Cell Count
60 (6x10)
Warranty
25 year Guarantee
Other
The most efficient panels
in this paper.
Price
£165 (£198 with VAT)
Polycrystalline
The process of producing polycrystalline panels is not as
sophisticated as producing Monocrystalline panels.
Polycrystalline Panels are made using the off cuts of
different silicon melted down into a mould to form their
semiconductor. They’re less efficient than their
monocrystalline competitor but this efficiency gap has
become less noticeable in recent years.
According to the Eco Expert, the most efficient
polycrystalline panels are produced by SunTech. In 2016
SunTech released the STP265/WEM, a polycrystalline
solar panel with 16.3% efficiency. Sadly, these panels
aren’t currently avaliable to purchase so the following
SunTech panels have been selected as a close substitute:
Table 8: Information Taken from the Product information
page on BuyPVDirect.
Model
SunTech STP280-24
Max. Output
280w
Max. Efficiency
15.4
Cell Count
72 (6x12)
Warranty
----
Other
The most cost efficient
panel on BuyPVDirect
Price
£105 (£126 with VAT)
Amorphous
Amorphous or “thin film” solar panels are a newer
technology than crystalline and polycrystalline panels.
They are made by placing several thin layers of
photovoltaic material onto a substrate. They are the
cheapest panels in this paper and the least efficient.
They’re flexible and are rarely implemented for
longevity. Depending on the technology, thin-film
module prototypes have reached efficiencies between 7–
13% and production modules operate at about 9%. Thus
proving the claim that monocrystalline panels can be
four times more efficient than Amorphous (thin-film)
based solar panels. With efficiency levels this low,
amorphous panels will not be included in price
comparisons.
Developing a Power Efficient Private Cloud Ready Infrastructure for Small-Medium Sized Enterprises
305
5.2 Hours of Sunlight (Buxton,
Derbyshire)
The United Kingdom and Sunshine are often treated as
two mutually exclusive terms. However, though solar
panels produce more power in countries such as Spain
or South Africa, solar panels still function in the UK.
Their output is hindered by rain, overcast and shorter
days but most solar panels still provide a return on
investment within seven years.
To engineer a solar powered solution to cover GIL’s
operational costs it is important to know the amount of
sunlight that is bestowed on their offices. Suitably, The
Met office has been monitoring the average amount of
sunlight in Buxton Derbyshire since 1981 to 2010; using
this data the following table has been produced.
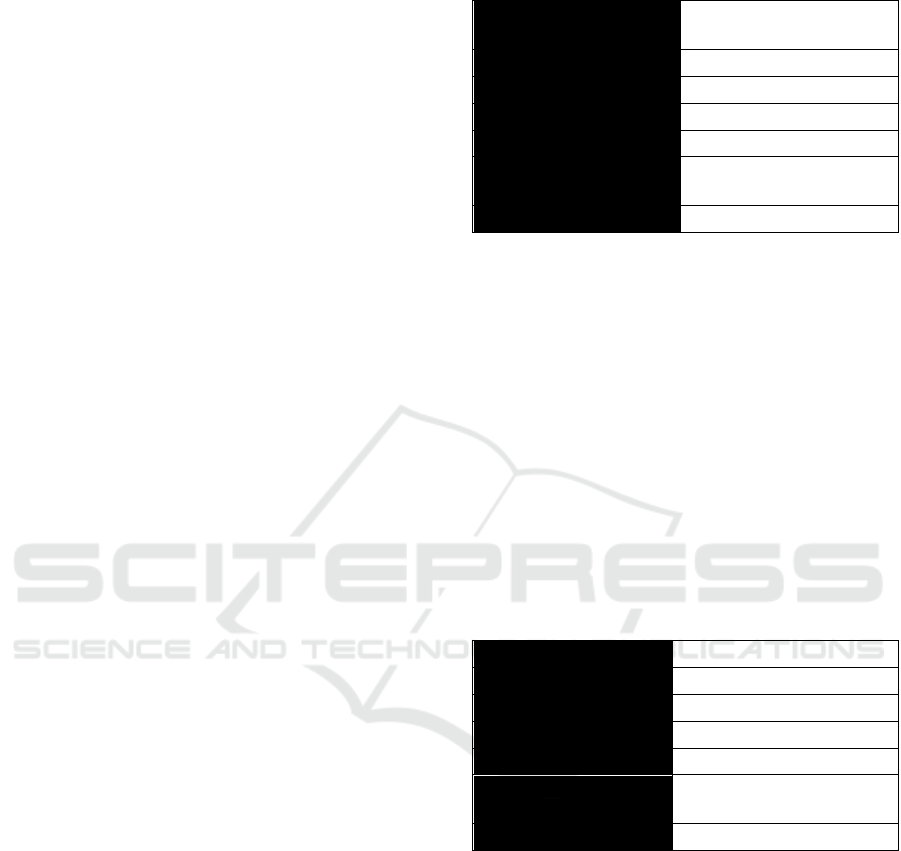
Table 9: A table to show the Annual Sunshine in Buxton,
Derbyshire.
Month Sunshine (hours)
Jan 41.2
Feb 63.1
Mar 93.8
Apr 140.2
May 180.2
Jun 166.4
Jul 178.5
Aug 167.6
Sep 123.8
Oct 91.4
Nov 51
Dec 37.7
Annual
1334.8 (1335r)
Table 9 shows us that annually we can expect 1335
hours of sunlight to be shed on GIL’s offices. This
equates to a mean of 3.71 hours of sunlight per day. This
is essential knowledge as with most solar panels
producing a test conditions efficiency rating of 10-20%,
every hour needs to be considered and consumed.
5.3 Panel Elevation
Leading us to the next section, to get the most from
solar energy, it is essential to point the panels in the
direction that captures the most sun. Though tracking
panels that follow the sun are a possible solution as
they have been proven to increase solar production by
10% in the winter and 40% in the summer when
compared to stationary panels. They’re often
expensive, unreliable, and implemented on the
ground for space efficiency. As GIL is installing their
panels on the roof of their office, require a quick
return on investment and claim space “shouldn’t be
an issue”, the best case solution in this instance are
manual tilt panels.
By analyzing the data presented to us in figure 2
we can start to understand the amount of potential
solar energy lost to inefficiencies and see the potential
benefit of adjusting panels.
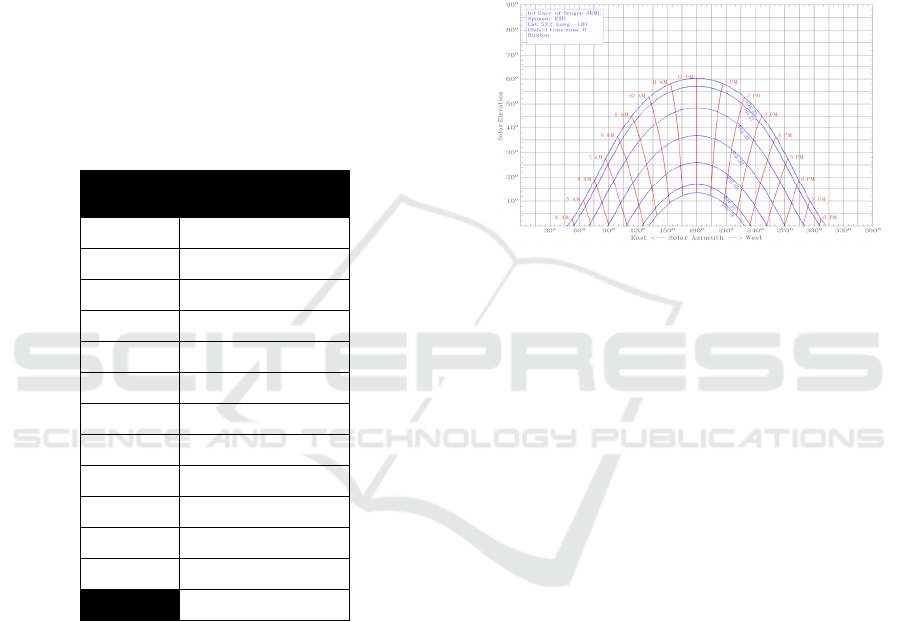
Figure 2: A graph of the sun path in Buxton, Derbyshire.
Generated using a tool from the University of Oregon.
In Figure 2 the Y axis is the suns elevation in the
sky and the X axis is the location of the sun in the sky.
Through knowing this we can clearly see there is
more sunlight in the Summer (Jun) than there is in the
Winter (Dec). Figure 2 also visualizes what may seem
obvious: the angle of the panels in relation to the
angle of the sun and time spent in its direct raise
effects power out. For an efficient implementation of
solar panels we need to establish both what angle to
install the panels and what direction. Though
establishing the direction to install panels is common
knowledge in the solar community the angle isn’t.
Like how moss grows on trees, solar panels in the
northern hemisphere will be facing true south and in
the southern hemisphere solar panels will be facing
true north. If GIL were to implement south facing
solar panels on fixed brackets their optimum
efficiency would be 71.1%. If they implemented
adjustable brackets and adjusted them once in the
summer and once in the winter, they would see a 4%
increase in their solar harvest. Adjusting the bracket
any more than twice, let’s say four times, would
increase efficiency by 0.4% but the amount of effort
required for such a diminished return means it’s rarely
implemented and won’t be implemented in this paper.
Therefore GIL’s solar panels will be adjusted twice:
once on the 30
th
of March and again on the 12
th
of
September.
The perfect angulation of the panels according to
CLOSER 2018 - 8th International Conference on Cloud Computing and Services Science
306
the data presented in Figure 2 and the information
provided from Landua’s research is 28.3 in summer
and 65.6 in winter.
Recommendation
Examining the two panels proposed in this section
one would assume that at a glance the Perlight is the
supreme panel. Though the Perlight PLM-300M-60
MONO is more efficient, has a higher max output and
takes up less space, the cost being true to
monocrystalline panels is much more expensive.
Applying simple math we can deduce that the
Perlight panels on implementation delivering a 300
watt max output for £126 a panel produce 1.51 Watts
per £1 spent. SunTech’s STP280-24 on the other hand
produce 2.2 watts per £1 spent.
After selecting the SunTech’s STP280-24 solar
panels as the preferred panel we now need to calculate
how many panels will be required to produce enough
energy for the private cloud aforementioned in
section 4.2. The private cloud infrastructure designed
in 4.2 requires 13169.4 Kw a year. To produce this
much energy from 1335 hour of sunlight, 33 Suntech
panels costing £4,143.18 will be required. At this
point however, It’s important to mention that none of
the calculations in this paper have considered labour
costs.
6 PROPOSED SOLUTION
6.1 A Cloud Ready Infrastructure
Powered via Solar Panels
As the IT department wishes to host their datacenter
locally and public cloud have proven unaffordable the
following solution has been produced. The final
solution designed in section 4.2 will be implemented
in line with the solar solution devised in section 5.
The annual energy requirements for the new
datacenter are estimated to be 13,169 kW a year. To
satisfy this requirement and attain a private cloud the
following components need to be purchased 33
SunTech STP280-24 (£4,143.18).
• Adjustable mount brackets (N/a)
• Installation Labour (N/a)
• Maintenance (N/a)
• OneView (N/a)
• OpenStack (N/a)
• VSphere Essential Kit(£430.50)
• HPE BLc3000 Enclosure (£5,443)
• HPE ProLiant BL660c Gen9 (£10,290)
• HPE Storageworks D2200sb (£1,368.42)
• 9 x 1TB 6G SATA (£1,251.72)
• Networking and Cabling (N/a)
•
L
abour (N/a)
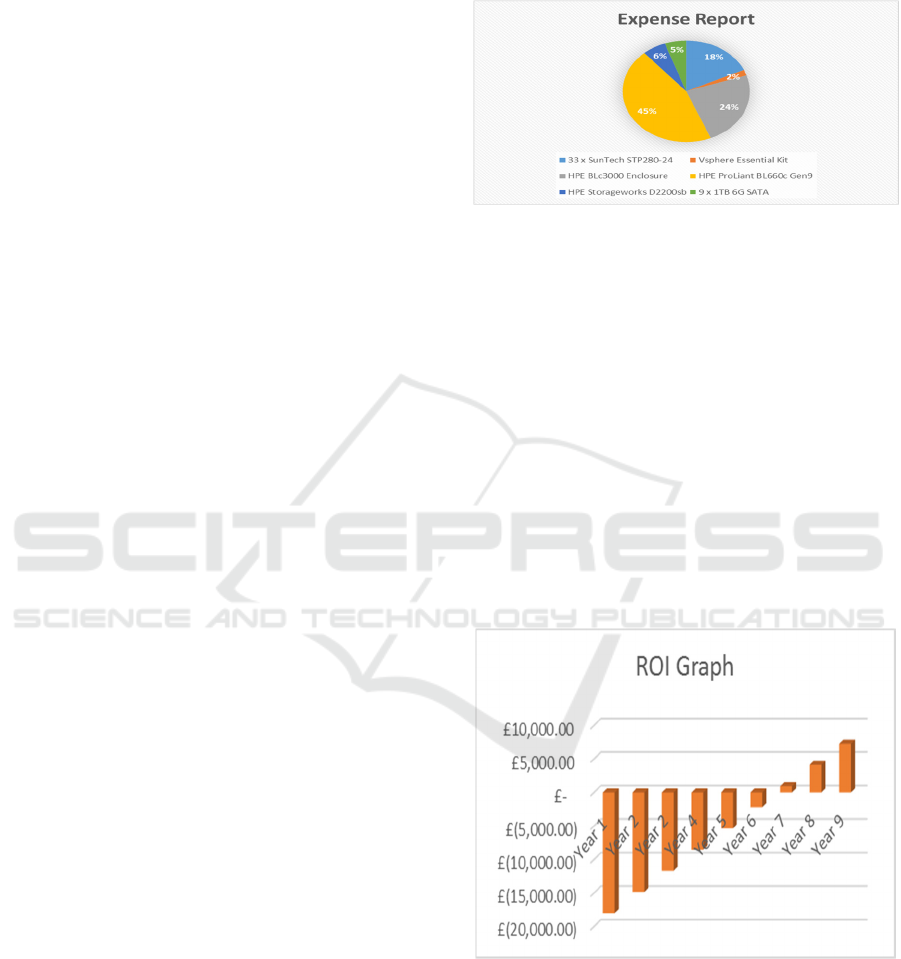
Figure 3: A graph showing the cost of each component
required to provide the solution.
With the HPE partner’s discount the total cost of
the private cloud infrastructure is £17,030.80. The
total cost of the Suntech solar panels is £4,143.18. A
total of £25,000 pounds was allocated to reducing
operational costs and achieving the requirements
mentioned in earlier section and a total of £21,173.98
is required for this solution. Despite the private cloud
infrastructure reducing power consumption by over
50% introducing it without solar power wouldn’t be
cost efficient. The following graph (Figure 4) displays
the payback period and return over the proposed 9
year limit. It is important to note that unlike many
other investments an investment in solar has
immediate return from the day it’s installed.
Figure 4: A bar chart displaying the retrun on Investment
for Solution 1.
Figure 5 was produced assuming the solar panels are
installed on the 1
st
of January 2017. At a glance an
observer would assume the solution offers a return on
invest in the last quarter of 2024, however figure 3
does not account for Net Present Value (NPV). NPV
is the difference between the present value of cash
Developing a Power Efficient Private Cloud Ready Infrastructure for Small-Medium Sized Enterprises
307

inflows and the present value of cash outflows. To put
it simply, the cash invested in 2017 will not be equal
to same amount in 2024. To calculate the NPV the
following formula has been implemented:
(4)
C
t
= net cash inflow during the period t
C
o
= total initial investment costs
r = discount rate
t = number of time periods
Using this formula we can establish that though the
project’s return on investment is £7,289.33 at the end
of the 9
th
year, the actual return on investment after
account for the NPV with a discount rate of 3.5 is
£2,886.01.
It is critical to this solution that the infrastructure
is reformed and the solar panels are installed in order
to achieve the business requirements and a return on
investment. Figure 4 shows how the savings are
divided. Showing that if either were implemented
separately there wouldn’t be a return on invest within
7 years.
Figure 5: A graph showing the cost of investment and
savings from both the cloud infrastructure and solar panels
associated with solution one.
When compared to the six requirements listed in section
2.4 we can be assured that the following requirements
have been met:
• R1: The Solution costs less than £25,000
(£21,173.98)
• R2: The Solution reduces power consumption
by 58%
• R3: The Solution provides the required
memory, a reliable virtual rendering server, the
new file servers will be running Microsoft’s
Onedrive allowing office access and file
consistency. One of the two redundant cores
could also be assigned to the print server to
resolve print issues.
• R4: The solution simplifies IT management
lifecycles through consolidating resources and
allowing for the introducing of automation.
• R5: The solution provides an undeniable
return on invest within 9 years (NPV -
£2,886.01)
• R6: The solution is installed in their Buxton
offices meeting the soft requirement presented
by the IT department.
7 CONCLUSIONS
To conclude, in this paper, we intended to develop an
understanding of cloud, virtualization, solar power
and the potential benefits they could bring to an SME
keen on reducing their operational costs. The
fictitious business featured in this paper had
requirements that were common in siloed
infrastructures and were also commonly resolved
through cloud implementation.
At first, implementing a private cloud for GIL was
an unattractive prospect as it was found to have high
initial costs and a slow return on invest. However,
with the implementation of solar panels this paper
found private clouds to offer the largest return on
investment over nine years without compromising on
scalability, consolidated management or the
customer’s requirements.
Public clouds, despite seeming like a valid option
in the beginning, appeared to be a poor investment for
an enterprise of this size. Nonetheless, the consensus
gained in this paper is that though they offer poor
return for SME they have the potential to provide
benefits to small businesses, large business and
SME’s willing to incur costs for an agile
infrastructure scalability and automated management
lifecycles.
For enterprises that, wish to retain an on-site
datacenter, demand a return on investment, and insist
on low power consumption we suggest the solution
proposed in this paper.
REFERENCES
E. Brown and G. Swenson, "Final version of NIST cloud
computing definition published," in NIST, NIST, 2016.
[Online]. Available: https://www.nist.gov/news-events/
news/2011/10/final-version-nist-cloud-computing-
definition-published. Accessed: Feb. 6, 2017.
O. T. P. Ltd, "Converged infrastructure and cloud @ Oriel,"
in Oriel, 2016. [Online]. Available: http://
www.oriel.com.au/converged_infrastructure_and_clou
d. Accessed: Feb. 6, 2017.
"Blade server systems - HPE BladeSystem blade server
technology," in HPE, 2017. [Online]. Available:
CLOSER 2018 - 8th International Conference on Cloud Computing and Services Science
308

https://www.hpe.com/us/en/integrated-systems/blade
system.html. Accessed: Feb. 6, 2017.
HPE Technology, "Your infrastructure automation engine:
HPE OneView 3.0," in YouTube, YouTube, 2016.
[Online]. Available: https://www.youtube.com/watch?
v=Tz1jAAo2H_4. Accessed: Feb. 6, 2017.
"Become a Cloud Service Broker," Hewlett Packard
Enterprise Development LP, Nov. 2015. [Online].
Available: https://www.hpe.com/h20195/v2/GetPDF.
aspx/4AA5-1140ENN.pdf. Accessed: Feb. 7, 2017.
M. J. Kavis, Architecting the cloud: Design decisions for
cloud computing service models (SaaS, PaaS, and
IaaS). United States: John Wiley & Sons, 2014.
B. Software, "Cloud Lifecycle Management," in "Cloud
Lifecycle management is transforming digital
enterprises," BMCSoftware, USA, 2005. [Online].
Available: https://www.google.co.uk/url?sa=t&rct=j&
q=&esrc=s&source=web&cd=1&cad=rja&uact=8&ve
d=0ahUKEwiEmKeBlIHSAhUI6mMKHRUKCScQF
ghHMAA&url=http%3A%2F%2Fwww.bmcsoftware.
uk%2Fit-solutions%2Fcloud-lifecycle-management.ht
ml&usg=AFQjCNGKjbDG7HfpTpvi6gaU2RCq-flAP
Q. Accessed: Feb. 8, 2017.
M. Al-Roomi, S. Al-Ebrahim, S. Buqrais, and I. Ahmad,
"Cloud computing pricing models: A survey,"
International Journal of Grid and Distributed
Computing, vol. 6, no. 5, pp. 93–106, 2013. [Online].
Available: http://www.sersc.org/journals/IJGDC/vol
6_no5/9.pdf. Accessed: Feb. 8, 2017.
S. Olanubi, "Top 5 largest cloud companies in the world -
Tharawat magazine," in Facts, Tharawat Magazine,
2016. [Online]. Available: https://www.tharawat-
magazine.com/facts/top-5-largest-cloud-companies-
world/#gs.h6H24PA. Accessed: Feb. 10, 2017.
Microsoft, "Azure purchase FAQ | Microsoft azure," 2017.
[Online]. Available: https://azure.microsoft.com/en-
us/pricing/faq/. Accessed: Feb. 11, 2017.
Microsoft, "Pricing calculator | Microsoft azure," 2017.
[Online]. Available: https://azure.microsoft.com/en-
2017.
Developing a Power Efficient Private Cloud Ready Infrastructure for Small-Medium Sized Enterprises
309
