
Design of Wireless Sensor Network in the Railway
Nagateru Iwasawa, Tomoki Kawamura, Michiko Nozue, Satoko Ryuo and Nariya Iwaki
Signalling and Transport Information Technology Division, Railway Technical Research Institute, 2-8-38,
Hikari-cho, 185-8540, Kokubunji-shi, Tokyo, Japan
Keywords: Wireless Sensor Network, Railway, Condition Monitoring System, Wi-SUN, 920 MHz, Slopes.
Abstract: In recent years, research and development on the condition monitoring systems using the wireless sensor
network in the railway have been proceeded. However, there are few cases of the wireless sensor network
design based on the features of the railway environment. In this paper, we propose the procedure to design
the wireless sensor network in the railway. And we introduce the demonstration test and the result in the
railway slope based on this procedure.
1 INTRODUCTION
The railway is the essential transportation mode in
many countries. Especially, in Japan, passenger
transport in FY2015 stood at 24.3 billion persons,
and freight transportation stood at 43.21 million tons
(Ministry of Land, Infrastructure, Transport and
Tourism, 2016). However, many Japanese railway
infrastructures were built before the 1970's, so the
average age of many tunnels and bridges is over 60
years.
To maintain and manage these aged facilities
properly is important for safe and stable operation in
railways. Therefore, regular inspections are carried
out on the structures once every two years, the
soundness of the structures is evaluated according to
the inspection results, and, if necessary, repair and
replacement and so on are carried out (Railway
Technical Research Institute, 2007).
In recently, condition monitoring by the WSN
(Wireless Sensor Network) has attracted attention,
and research on the condition monitoring system
utilizing the WSN is under way in the railway as a
matter of course. By monitoring the status all the
time with the WSN, it is expected that we can take
necessary measures based on right timing. However,
there is concern that the railway environment may
not be so created that, in there, we can collect data
frequently not enough to monitor the structure states
unless network design is properly made, since in the
railway environment, areas with different radio
environment such as urban areas and mountainous
areas are mixed and there are many metal objects.
Therefore, we propose a procedure for designing
a WSN in railway environment considering these
problems. Furthermore, based on the proposed WSN
design procedure, a WSN using the 920 MHz band
wireless communication standard Wi-SUN
(Wireless Smart Utility Network) was
experimentally introduced to an actual railway slope
and a demonstration test was conducted. In this
paper, we report the outline and results of the
verification test.
2 CONDITION MONITORING
USING THE WSN IN THE
RAILWAY
2.1 Condition Monitoring System
In the condition monitoring system using the WSN
that we are working on in this research, data is
collected by the WSN installed in the object to be
monitored, and these data are transmitted to the
M2M cloud via the Internet network and
accumulated (Fig. 1). These data can be viewed or
downloaded via the Internet network as necessary.
2.2 WSN
The WSN handled in this paper consists of a
gateway, relays, and wireless sensors. The wireless
sensor consists of a sensor for measurement and a
wireless terminal, and is attached to the object to be
122
Iwasawa, N., Kawamura, T., Nozue, M., Ryuo, S. and Iwaki, N.
Design of Wireless Sensor Network in the Railway.
DOI: 10.5220/0006638101220127
In Proceedings of the 7th International Conference on Sensor Networks (SENSORNETS 2018), pages 122-127
ISBN: 978-989-758-284-4
Copyright © 2018 by SCITEPRESS – Science and Technology Publications, Lda. All rights reserved

monitored. The data measured by the wireless sensor
is wirelessly transmitted to the gateway. If they
cannot be directly transmitted from the wireless
sensor to the gateway, they are transmitted to the
gateway via relay by multi-hop transmission. And
the collected data is sent to the cloud through a
public or private network and accumulated. In this
paper, the gateways, the relays and the wireless
sensors are collectively called nodes.
Figure 1: An example of the condition monitoring system
using the WSN.
WSNs have static and dynamic networks
(Bakaraniya and Mehta, 2012; Potdar et al., 2009).
The static network is a network for making data
transmission by a preset route. On the other hand,
the dynamic network is a network that
communicates between nodes and autonomously
composes.
The static network has the advantage that the
power load at each node can be calculated in
advance because the route is designed beforehand.
Thus, it is possible to formulate the battery design of
each node and an efficient battery replacement plan.
However, when a route change occurs due to the
addition of a node, it is necessary to change the
setting for the nodes on the route. Also, when a node
failure occurs, sensor data from that node and sensor
data passing through that node cannot be obtained
until the node is exchanged.
On the other hand, since each node
autonomously makes a route in the dynamic
network, it is not necessary to manually change the
route due to the addition of a node. Unlike the static
network, it does not always use the same route, so it
is not possible to calculate the power load of each
node in advance. So, for such a dynamic network,
we developed a method of estimating the battery
load by stochastically changing the route in time
series by the Monte Carlo method (Kawamura et al.,
2016). The details are omitted in this paper.
2.3 Problems in Designing WSN in
Railway Environment
As the features of the railway environment, it can be
cited that a wide area which urban areas and
mountainous areas between which there may be a
large difference in the radio wave environment
extends linearly and long, and that there are plenty
of metallic objects that are liable to hinder radio
wave propagation. In addition, from the viewpoint of
safety and physical conditions, restrictions may be
placed on the installation location and installation
height of nodes. For these reasons, the
communicable distance varies depending on the
installation location, and there is a concern that
communication quality for collecting necessary data
cannot be secured after their installation. Therefore,
a method of designing a network in consideration of
the environment of the installation site was
examined.
3 PROCEDURE OF WSN DESIGN
There is research on the design of WSN, but there
seems not to be found the network design
considering the railway environment as mentioned
above (Hodge et al., 2015; Tiwari et al., 2007; Xu et
al., 2005; Youssef and El-Sheimy, 2007). So we
propose a design procedure for introducing the WSN
in railway environment. It is explained below.
STEP1 Determination of objects and items to be
monitored
The railway operator decides the objects and the
items to be monitored. And it sets the collection
frequency and acceptable arrival rate of the data
required according to the monitoring item. In the
following procedure, the network is designed so as
to satisfy the required specifications set here.
STEP2 Determining the location of the wireless
sensors and gateway
It selects the location of the wireless sensor
according to the monitoring items determined in
STEP1. In addition, the location of the gateway is
selected the area of public or private network, and a
fixed power source is available, if possible.
STEP3 Survey of installation environment
In order to determine the location of the relay, it
confirms the location where the relay cannot be
installed and check the line of sight and obstruction
between the wireless sensor and the gateway. In
accordance with the installation environment, we
Sensor Data Server
Application Server
:Wireless Sensor
:Gateway
Wireless Sensor Network
Cloud
Data Representation
and Download
Internet
Internet
Sensor Data Transmittion
Design of Wireless Sensor Network in the Railway
123

appropriately select the frequency band and the
communication standard to be used. In addition, it
conducts a radio wave environment survey and so on
to derive communicable distance in the installation
environment.
STEP4 Derivation of communicable distance in
installation environment
From the result of the survey of the radio wave
environment at the installation location implemented
in STEP3, it derives the communicable distance in
this environment. The term "communicable
distance" means the distance at which the data
arrival rate between the nodes which results in
achieving the data arrival rate of STEP1 is secured.
STEP5 Determination of the installation location of
relay
If data cannot be transmitted directly from the
wireless sensor to the gateway, multi-hop
transmission is performed. If the wireless sensor can
be transmitted via another wireless sensor between
the wireless sensor and the gateway, there is no need
to take additional measures. However, if the number
is insufficient, dedicated relays should be installed.
By setting up this relay, we attain the achievement
rate set in STEP1. The details of the method of
determining the installation location of the relay
apparatus will be described Chapter 4.
STEP6 Power supply design
Since wireless sensors and relays are not necessarily
installed in locations where fixed power supply is
available, and there is a possibility that many nodes
may be installed for one monitoring location,
basically, power supply by a battery or an energy
harvesting is provided. Therefore, in accordance
with the network operation period and so on, the
design of battery capacity and energy harvesting
generation capacity and so on are properly
determined.
4 THE DETERMINATION
METHOD OF RELAY
LOCATION
We describe the method of determining the location
of the relay in STEP5 of chapter 3. This method
minimize the number of relays and satisfies
constraints given such as the specifications of the
nodes and the position of the obstacles. Also, since
various shielding objects are present along the
railway track, it is necessary to consider the
influence on the wireless communication by the
shielding object in determining the placement of the
relays. It is difficult to consider the influence of the
shielding objects in the conventional relay
placement determination method. In this paper, we
propose a method to decide the effective placement
of the relays of WSN, taking into consideration the
influence of shielding objects using mathematical
optimization. The objective function of this method
can be formulated as the minimization of the number
of relays as shown in Equation (1).
[Objective function]
min(R
num
)
(1)
[Constraints]
r
i,gat
= 1
(2)
P
i
(x,y) ≠ N
j
(x,y)
(3)
In the above equations, R
num
is the number of relays,
r
i,j
is the reachability matrix, r
i,j
=1 if there is a route
by which data can reach node j from node i, and r
i,j
=0 if there is no reachable route. Also, P
i
(x,y) is a
position (x coordinate, y coordinate) of the relay
device i, and N
j
(x,y) is the position (x coordinate, y
coordinate) where the relay cannot be installed.
Equation (2) represents the constraint relating to the
arrival of data from each wireless sensor at the
gateway, and r
i,gat
represents the reachability of the
gateway from the wireless sensor i by data. Equation
(3) represents the constraint relating to the position
of the relay.
Here, the position N
j
(x,y) where the relay cannot
be installed included in the constraint condition is
given as input, and it shall be set according to the
conditions of the environment where the WSN is
installed. In addition, the reachability matrix r
i,j
is
calculated by the following procedure by giving as
input such conditions as the position of the gateway,
the number of wireless sensors, the position of each
wireless sensor, the communication distance of the
wireless devices, and the position of the
obstructions.
STEP1 Generation of the adjacency matrix based on
the communication distance
STEP2 Updating the adjacency matrix based on
internode of line of sight
STEP3 Calculation of the reachability matrix based
on the adjacency matrix
Details of the above procedure are shown below.
SENSORNETS 2018 - 7th International Conference on Sensor Networks
124

4.1 Generation of the Adjacency
Matrix based on the
Communication Distance
In this paper, we consider the reachability matrix
showing the reachability of one of the nodes from
another by data using the adjacency matrix in the
graph theory. The adjacency matrix expresses the
presence or absence of the relationship between
nodes in the graph, and the adjacency matrix of the
graph consisting of n nodes is an n × n square
matrix.
Here, if the adjacency matrix is a
i,j
,
if there is an edge from node i to node j, a
i,j
= 1.
if there is no edge from node i to node j, a
i,j
= 0.
In this paper, the gateway, the wireless sensors, and
the relays are assumed to be the nodes in the
adjacency matrix, and the availability of
communication between each node is expressed as
an edge. That is, a
i,j
= 1 when communication from
node i to node j is possible, and a
i,j
= 0 when
communication from node i to node j is impossible.
Here, the determination of whether or not
communication is possible between the nodes is
made as follows using the communication distance
of the wireless devices of the wireless sensor or
relay given as the input condition.
if D
i,j
<= C
i
: Communication is possible (a
i,j
= 1),
if D
i,j
> C
i
: Communication is impossible (a
i,j
= 0)
Where, D
i,j
is the distance between nodes, C
i
is the
communication distance of each wireless device.
By performing the above judgment between any
pair of all the nodes, the adjacency matrix is
generated here.
4.2 Updating the Adjacency Matrix
based on Internode of Line of Sight
Here, the adjacency matrix generated in (1) is
updated based on the presence or absence of the
internode of line of sight. The presence or absence of
the internode of line of sight is determined based on
the position of the obstructions given as input. As
shown in Fig. 2, the position of the obstructions is
input as the gateways of a line segment constituting
the area where the obstructions exist like Li (x1, y1,
x2, y2). In this paper, the presence or absence of the
internode of line of sight is judged by the possibility
of intersection of a line segment constituting a
certain area of the obstructions and a line segment
connecting the nodes. Here, assuming that the two
line segments are L1 (x1, y1, x2, y2) and L2 (x3, y3,
x4, y4), the two line segments intersect when the
following equation (4) is satisfied.
tc × td < 0
(4)
Where,
tc = (x
1
- x
2
)(y
3
- y
1
)+(y
1
- y
2
)(x
1
- x
3
),
td = (x
1
- x
2
)(y
4
- y
1
)+(y
1
- y
2
)(x
1
- x
4
).
Figure 2: The coordinates of the line segment.
Here, the intersection determination is made
based on the above equation (4), and if any of the
line segments intersect each other as a result of the
judgment, it is determined that there is non-line of
sight and the adjacency matrix is updated as a
i,j
= 0
(communication is impossible).
4.3 Calculation of the Reachability
Matrix based on the Adjacency
Matrix
Here, the reachability matrix is calculated based on
the adjacency matrix calculated above. The
reachability matrix can be calculated by the
following procedure.
STEP1 Add unit matrix I to adjacency matrix A
STEP2 Under the Boolean algebra operation, A + I
is repeatedly multiplied by r times until the state
represented by the following expression (5) is
obtained
(A+I)
r-1
≠ (A+I)
r
= (A+I)
r+1
(5)
(A+I)
r+1
obtained by the above calculation is a
reachability matrix. In this way, in the method
proposed, the reachability matrix is calculated based
on the communication distance of the wireless
devices and the line of sight between the nodes.
5 THE DEMONSTRATION TEST
ON RAILWAY SLOPE
We conducted a demonstration test on the railway
X
Y
obstruction
(x1,y1) (x2,y2)
(x3,y3)
(x4,y4)
L1(x1,y1,x2,y2)
Design of Wireless Sensor Network in the Railway
125

1cell = 10m × 10m, N: the relays installation impossible, O: the obstructions,
S: the wireless sensors’ location
Figure 3: The result of survey of the installation environment.
1cell = 10m × 10m, N: the relays installation impossible, O: the obstructions,
S: the wireless sensors’ location, R: the relays’ location
Figure 4: The result of the method to determine the location of relays.
slope, in accordance with the procedure proposed in
chapter 3.
5.1 Wi-SUN
In Japan, the 920 MHz band is allocated as the ISM
band in July 2012, and the application of the band to
the WSN is progressing. Along with that, the
development of the 920 MHz band LPWA (Low
Power Wide Area) wireless module is progressing.
The LPWA includes the LoraWAN, SIGFOX, Wi-
SUN, and the like. Compared to other LPWAs in the
same 920 MHz band, the Wi-SUN has the advantage
that, although the communication distance is inferior,
the transmission speed is 200 kbps and multi-hop
transmission is possible (Harada et al., 2017).
Therefore, it can be said that it is suitable for a WSN
which requires high scalability due to such changes
as the addition of wireless sensors, or one to be
introduced sequentially. So we decided to design the
WSN for monitoring the railway slopes by using
Wi-SUN.
5.2 WSN Design on Railway Slope
First, we decided the location of the wireless sensors
on the assumption of detecting the sign of land slide
and land collapse by measuring the inclination and
the soil moisture on the slope. And we decided to
install the gateway in the location that can supply
fixed power.
Next, we conducted survey of the installation
environment, and confirmed the location where the
relay can be installed and the shielding object and so
on from topographic conditions based on
topographic map (Fig.3). Then, we applied the
proposed method in Chapter 4 to determine the
setting location of relays for the wireless sensors far
from the gateway in Fig. 3. Fig. 4 shows the location
of the relays by the proposed method. Incidentally,
the wireless sensors and relays were powered by
solar panels in this demonstration test.
5.3 The Result of the Test
We installed 5 inclination wireless sensors, 2 soil
moisture wireless sensor and 3 relays. Fig.5 shows
the state of installation the nodes on the slope.
We accumulated the sensor data by the designed
network for about 3 months. As a result, except for
some sensors, the sensor data arrival rate was more
than 99%. But some of those sensors have lost data
from one day. We know that rain and snowfall don’t
have a big influence on radio wave propagation in
the 920 MHz (ITU-R, 1998; Iwasawa et al., 2016).
One of the reasons for this may be that the plants
grew higher than the antenna of the wireless sensors
and the relays. In fact, we saw the images from the
camera on the site and confirmed that the wireless
sensors and the relays were buried with plants. Also,
we confirmed that radio waves attenuate when there
are plants between the nodes. In the future, we think
that it is necessary to design the WSN considering
such attenuation.
6 CONCLUSIONS
In this paper, we introduced the procedure for
designing the WSN in the railway environment. And
we reported the demonstration test to the railway
slope based on the procedure. As a result, we found
that the WSN design considering the change of the
N N N N O O O O O O O O O O O O O O O O O O O O O O O O O O O O O O O O O O O
S N N N N N N N N O O O O O O O O O O O O O O O O O O N N N N N
N N N N N N N N N N N N N N N N N N N N N N N N N N N N N N N N N N N N N N
C N N N N N N N N N N N N N N N N N N N
O O O O O O O O S
O O O O O O O O
R N N N N O O O O O O O O O O O O O O O O O O O O O O O O O O O O O O O O O O O
S N N N N N N N N O O O O O O O O O O O O O O O O O O N N N R N N
N N N N N N N N N N N N N N N N N N N N N N N N N N N N N N N N N N N N N N
C N N N N N N N N N N N N N N N N N N N
O O O O O O O O S
O O R O O O O O O
SENSORNETS 2018 - 7th International Conference on Sensor Networks
126
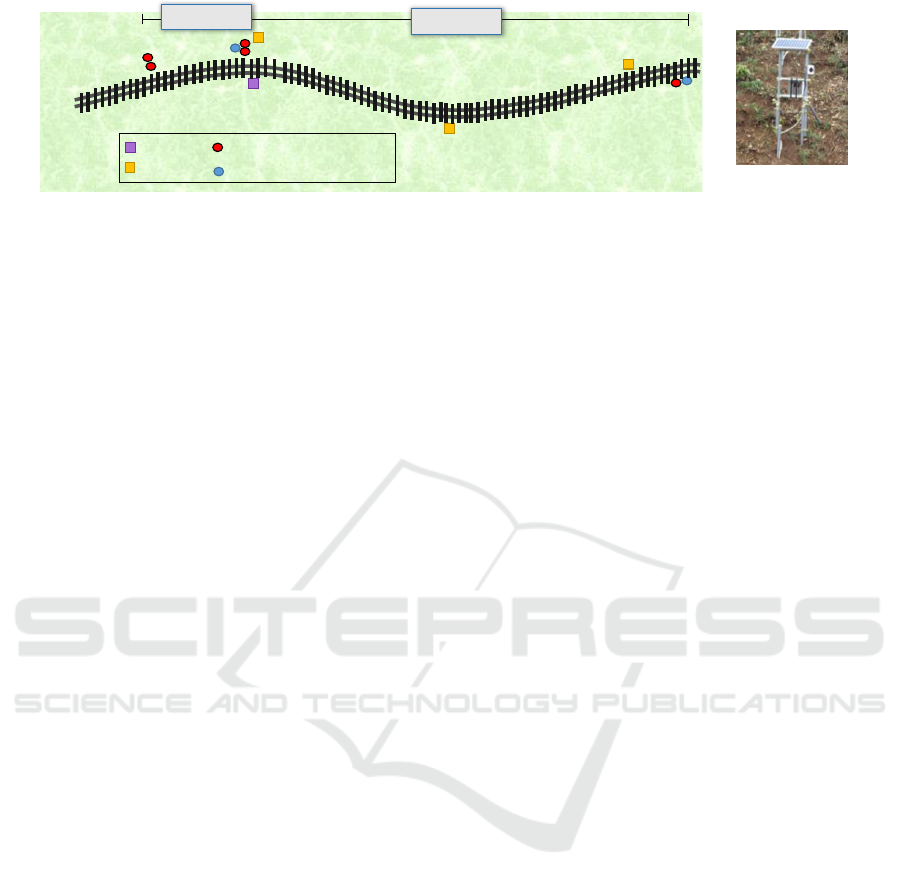
Figure 5: The state of installation the nodes on the slope.
surrounding environment is necessary. So we will
improve the procedure by organizing the idea of
margin due to environment change in the future.
And we will plan to improve the proposed method
so that we can consider the dynamic environment
such as train movement.
ACKNOWLEDGEMENTS
The research results have been achieved by
"Research and Development on Fundamental and
Utilization Technologies for Social Big Data," the
Commissioned Research of National Institute of
Information and Communications Technology
(NICT), Japan.
REFERENCES
Bakaraniya, P., Mehta, S., 2012. Features of WSN and
Various Routing Techniques for WSN: A Survey, In
International Journal of Research in Engineering and
Technology.
Harada, H., Mizutani, K., Fujiwara, J., Mochizuki, K.,
Obata, K., Okumura, R., 2017. IEEE 802.15.4g Based
Wi-SUN Communication Systems. Transactions on
Communications. IEICE.
Hodge, V. J., O’Keefe, S., Weeks, M., Moulds, A., 2015.
Wireless Sensor Networks for Condition Monitoring
in the Railway Industry: A Survey, In Transactions on
Intelligent Transportation Systems. IEEE.
Iwasawa, N., Ryuo, S., Kawamura, T., Kawasaki, K.,
Nozue, M., 2016. Transmission Performance
evaluation of Wi-SUN Wireless Sensor Network
During Snowing, In 23
rd
J-RAIL’16. IEEJ.
Kawamura, T., Ryuo, S., Iwasawa, N., 2016. Power
Consumption Prediction Method for Train-Health
Monitoring Wireless Sensor Networks, In 23
rd
J-
RAIL’16. IEEJ.
Ministry of Land, Infrastructure, Transport and Tourism,
2016. Annual report on railway transportation, MLIT,
Tokyo.
Potdar, V., Sharif, A., Chang, E., 2009. Wireless Sensor
Networks: A Survey. In AINA’09, 23
rd
International
Conference on Advanced Information Networking and
Applications Workshops. IEEE computer society.
Railway Technical Research Institute, 2007. Railway
structures maintenance standard and commentary
[earth structure] (embankment and excavation),
Maruzen, Tokyo.
ITU-R, 1998. Specific Attenuation Model for Rain for Use
in Prediction Methods, In ITU-R Recommendations,
ITU, Geneva.
Tiwari, A., Ballal, P., Lewis, L. F., 2007. Energy-Efficient
Wireless Sensor Network Design and Implementation
for Condition-Based Maintenance, In Transactions on
Sensor Networks. ACM.
Xu, K., Wang, Q., Hassanein, H., Takahara, G., 2005.
Optimal Wireless Sensor Networks (WSNs)
Deployment: Minimum Cost with Lifetime Constraint.
In WiMob’05, Wireless and Mobile Computing,
Networking and Communications. IEEE.
Youssef, M., El-Sheimy, N., 2007. Wireless Sensor
Network: Research vs. Reality Design and
Deployment Issues. In CNSR’07, 5
th
Annual
Conference on Communication Networks and Services
Research. IEEE computer society.
Gateway
Inclination wireless sensor
About 400m
About 100m
Relay
Soil moisture wireless sensor
Inclination wireless sensor
Design of Wireless Sensor Network in the Railway
127
