
Automatic Detection of a Phases for CAP Classification
Fabio Mendonça
1,2
, Ana Fred
3
, Sheikh Shanawaz Mostafa
1,2
,
Fernando Morgado-Dias
1,4
and Antonio G. Ravelo-García
5
1
Madeira Interactive Technologies Institute, Caminho da Penteada, Funchal, Portugal
2
Instituto Superior Técnico - Universidade de Lisboa, Av. Rovisco Pais, Lisboa, Portugal
3
Instituto de Telecomunicações, Instituto Superior Técnico - Universidade de Lisboa, Av. Rovisco Pais, Lisboa, Portugal
4
Centro de Ciências Matemáticas, Universidade da Madeira, Caminho da Penteada, Funchal, Portugal
5
Institute for Technological Development and Innovation in Communications,
Universidad de Las Palmas de Gran Canaria, Calle Juan de Quesada, Las Palmas, Spain
Keywords: A Phase, Cyclic Alternating Pattern, CAP, LDA.
Abstract: The aim of this study is to develop an automatic detector of the cyclic alternating pattern by first detecting
the activation phases (A phases) of this pattern, analysing the electroencephalogram during sleep, and then
applying a finite state machine to implement the final classification. A public database was used to test the
algorithms and a total of eleven features were analysed. Sequential feature selection was employed to select
the most relevant features and a post processing procedure was used for further improvement of the
classification. The classification of the A phases was produced using linear discriminant analysis and the
average accuracy, sensitivity and specificity was, respectively, 75%, 78% and 74%. The cyclic alternating
pattern detection accuracy was 75%. When comparing with the state of the art, the proposed method
achieved the highest sensitivity but a lower accuracy since the fallowed approach was to keep the REM
periods, contrary to the method that is used in the majority of the state of the art publications which leads to
an increase in the overall performance. However, the approach of this work is more suitable for automatic
system implementation since no alteration of the EEG data is needed.
1 INTRODUCTION
A variety of imaging techniques have been
developed through time to analyse the human body,
being frequently employed by modern medicine as
auxiliary diagnosis elements. Electroencephalo-
graphy is a member of the electrobiological
measurements group, reading the electrical activity
produced by the brain (created when neurons are
activated) and the electroencephalogram (EEG) is
one of the most used techniques in this field. EEG
records the alternating electrical activity at the scalp
surface using conductive media and metal electrodes
(Schomer and Silva, 2010). The scalp electrodes
distribution usually follows the 10-20 electrode
placement standardization, presented in figure 1, and
the EEG power spectrum, calculated by the Fourier
transform, is typically categorized in four bands
(Teplan, 2002), delta (0.5-4 Hz), theta (4-8 Hz),
alpha (8-13 Hz) and beta (13-30 Hz).
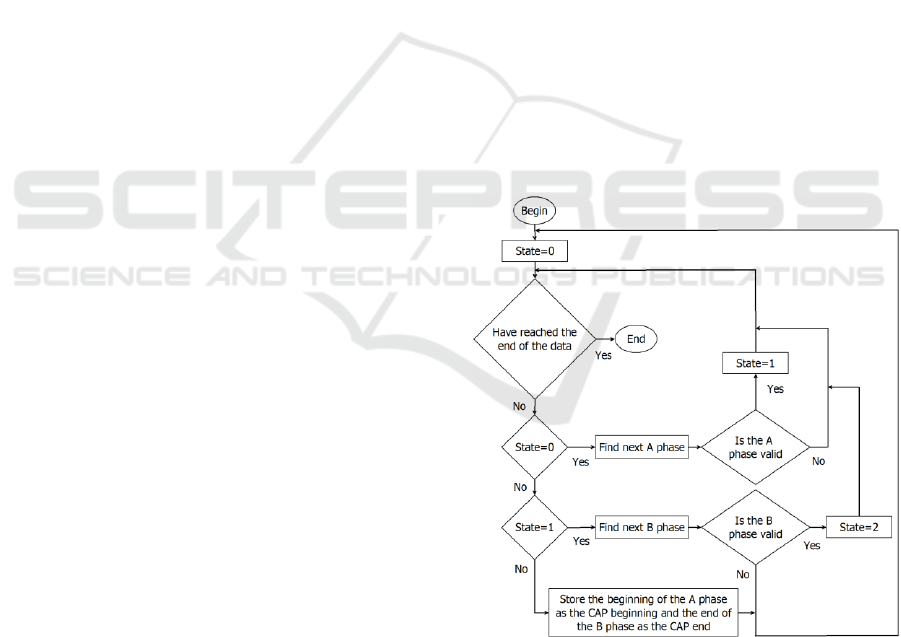
The EEG is commonly used for sleep analysis.
Two major states of sleep have been defined, the
rapid eye movement (REM) and the non-REM
(NREM). The NREM can be divided into four
stages, from S1 to S4, increasing from stage to stage
the slow-wave activity. An example of a normal
hypnogram is presented in figure 2. In the most
recent classification the third and fourth states are
combined, being named N3, the second stage is N2
and the first N1. Cyclic patterns of NREM stages
and REM define the sleep macrostructure. However,
the microstructure is characterised by transitional
states such as the cyclic alternating pattern (CAP),
characterized by a cycle of activation (A phase) and
quiescent (B phase) phases as represented in figure
3. This pattern is not defined in the REM sleep. Each
phase has a minimum duration of 2 seconds, being
60 seconds the maximum (Chokroverty, 2009).
394
Mendonça, F., Fred, A., Mostafa, S., Morgado-Dias, F. and Ravelo-García, A.
Automatic Detection of a Phases for CAP Classification.
DOI: 10.5220/0006595103940400
In Proceedings of the 7th International Conference on Pattern Recognition Applications and Methods (ICPRAM 2018), pages 394-400
ISBN: 978-989-758-276-9
Copyright © 2018 by SCITEPRESS – Science and Technology Publications, Lda. All rights reserved
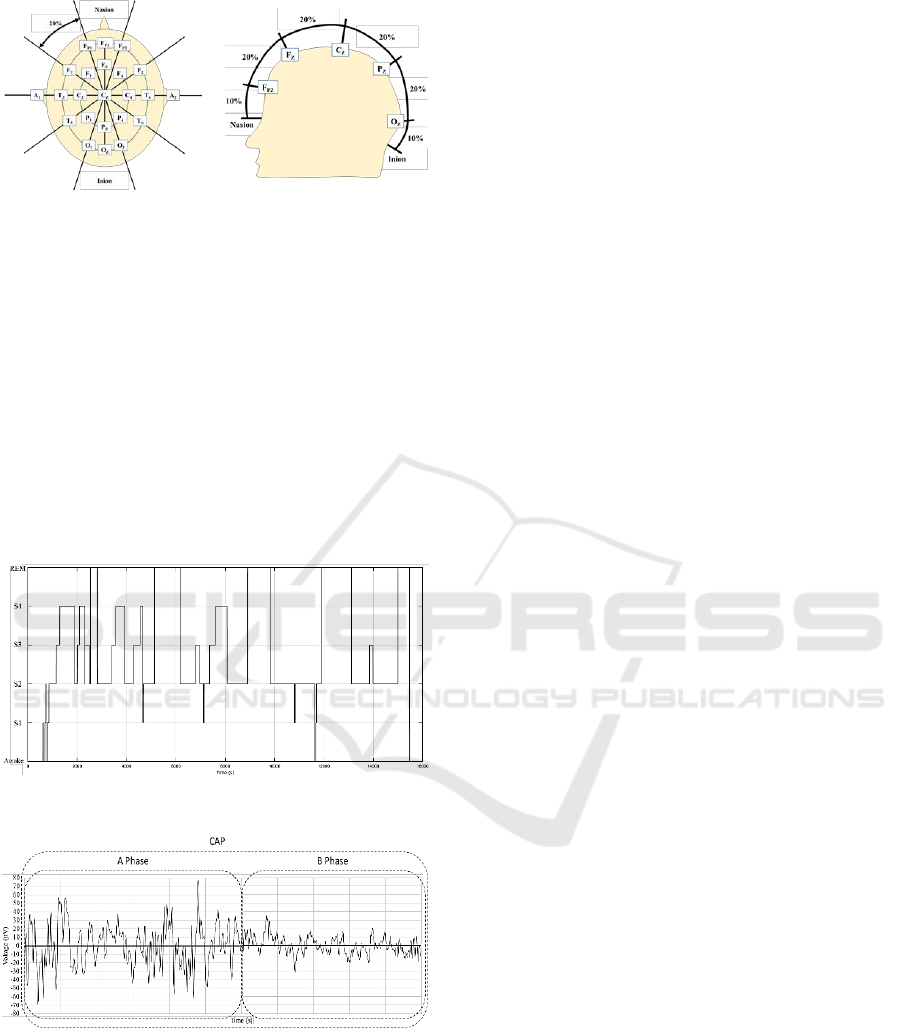
Figure 1: 10-20 electrode placement standardization.
Adapted from Schomer and Silva (2010).
The A phases can be categorised into three
subtypes, A1, A2 and A3, increasing the percentage
of rapid activities, in the alpha or the beta bands
from the A1 to A3 (Mendez et al., 2014). A non-
CAP period happens when the phase duration is
higher or lower than the specified. EEG Monopolar
derivations (C4-A1 or C3-A2) are frequently used
for CAP analysis, being the alpha and beta
frequency bands defined differently to include a new
band. Therefore, the alpha goes from 8 to 12 Hz, the
sigma from 12 to 15 Hz and the beta from 15 to 30
Hz (Mariani et al., 2011a).
Figure 2: Example of a normal hypnogram.
Figure 3: Example of a CAP using a monopolar derivation
(C4-A1) signal.
Studies have shown that the main role of CAP in
sleep is to generate, consolidate and disrupt the
macrostructure of sleep (Halász et al., 2004).
Therefore, CAP can be seen as a marker of sleep
instability. A full night of EEG sleep analysis
generates a large quantity of information making
manual CAP scoring unpractical with a high
susceptibility to miss classification, being the
expected specialist agreement, analysing the same
results, in the 69% to 78% range (Rosa et al., 2006).
Therefore, automatic CAP detection algorithms have
been proposed.
This paper has the folowing organization: the
state of the art is analysed in section 2 being the used
methods indicated in section 3; section 4 presents
the algorithms performance; comparison with related
work is performed in section 5 and the paper
conclusion is presented in the next section.
2 STATE OF THE ART
Two main approaches for CAP classification are
presented in the bibliography. The first consist in
detecting CAP from the EEG data and was used by
Karimzadeh et al. (2015), employing multiple
entropy features to feed the three tested classifiers:
linear discriminant analysis (LDA); support vector
machine (SVM); k-nearest neighbours (kNN). It was
verified that sample entropy, Shannon entropy and
Kolmogorov entropy are the most relevant features
being kNN the best classifier. The second approach
consist in using in a first step a classifier to
determine the A and B phases and then applying a
finite state machine (FSM) to classify CAP. A total
of nine articles were found, through a systematic
review, in the state of the art presenting algorithms
for A phase detection and five with algorithms to
detect each of the three subtypes of the A phase.
The usual approach consist in considering that
everything that is not an A phase is a B phase. A
simple method, based in frequency band descriptors
and thresholds was presented by Navona et al.
(2002) and Barcaro et al. (2004), producing for each
of the five bands a descriptor that consists in the
value of a short average (two seconds) subtracted by
a longer average (64 seconds) and dividing the result
by the longer average. Classification was performed
using specific thresholds. Mariani et al. (2011b)
achieved the best results for A phase detection using
the Hjorth activity, classifying with a threshold.
Niknazar et al. (2015) analysed the similarity of the
windowed signal with a database of reference A
phase windows using statistical behaviour of local
extrema (SBLE).
Mariani et al. (2010) used five band descriptors,
differential variance (difference of the current
window and the previous window variance) and the
Hjorth activity to feed the classifier, using a three-
layer neural network (NN) with Logsig activation
Automatic Detection of a Phases for CAP Classification
395

function. The same features were used by Mariani et
al. (2011a) to feed a soft-margin SVM with
Gaussian kernel and by Mariani et al. (2013), using
a variable window, to feed three LDA classifiers (the
first for the background classification, the second for
the A1 classification and the third for the A2 and A3
classification). The A phase classification was
determined by combining the classification vectors.
SVM achieved the highest average results.
Mariani et al. (2012) used the same features and
four classifiers (NN, LDA, SVM and the Adaptive
Boosting classifier, AdaBoost, with 20 weak
learners) verifying that LDA provided the best
results. Machado et al. (2016) used a macro-micro
structure descriptor, the Teager energy operator
(TEO), Lempel-Ziv complexity, Zero-Crossing,
empirical mode decomposition, Shannon entropy
and variance as features to feed three classifiers,
LDA, SVM and kNN. It was determined that SVM
produces the highest accuracy.
By analysing the A phase detection proposals it
was possible to identify the features indicated as the
most relevant: five frequency band descriptors;
Hjorth activity; differential variance; TEO; Lempel-
Ziv complexity; Zero-Crossing; Shannon entropy;
empirical mode decomposition; macro-micro
structure descriptor. It is also possible to determine
that LDA, SVM, kNN and NN are the most suited
classifiers.
The main objective of this work is to propose
new features using the LDA, since it was determined
to be the classifier that achieved the highest
performance in the state of the art analysis. A
comparison with the features indicated by Mariani et
al. (2012) was also implemented since this work
reported the highest performance of the
bibliographical analysis. The results were achieved
using the LDA.
The majority of the presented works remove the
REM periods from the analysis, increasing the
overall performance of the algorithms. In this work a
different approach was used, keeping all the sleep
data, making the developed algorithms of this work
more suitable for automatic system implementation.
3 MATERIALS AND METHODS
A systematic review was performed to determine the
best approach for CAP classification. The chosen
method first classifies the A and B phases and after
uses a FSM to determine the CAP. A public
database was used for training and testing the
classifier and the FSM in a programming
environment.
The employed features are a mix of some
identified in the state of the art as the most relevant
and some new ones proposed. The first test involved
the use of all features and sequential feature
selection (SFS) was applied in the second test to
choose the best features for the classifier.
Principal component analysis (PCA) was used in
the third test to generate the features independently
from the classifier and the final test was the use of
the features indicated by Mariani et al. (2012) in the
developed algorithm.
3.1 Database
A public database from PhysioNet (Terzano et al.,
2001), with specific annotations of the macro and
microstructure made by trained neurologists, was
employed in the tests. A total of 14 recordings were
used, being recorded using the 10-20 international
system and monopolar derivations (C4-A1 or C3-
A2). The annotations include the sleep stage, event
description and duration.
The sleep analysis varies between six hours and
thirty minutes and nine hours and fifty minutes. The
subjects age varies between 23 and 78 years, being
nine males and five females. 50000 samples were
used in average in each of the employed datasets
(data from three subjects), either for test or training.
In both cases train/test with two datasets and
validate with the left off subject, repeating multiple
times until all subjects were used at least one time
for validation. The EEG signals were imported to the
programming environment Matlab 9.0 (The
Mathworks Inc.) for the analysis.
3.2 Feature Set
The features determined in the review as the best
ones for A phase detection were tested. A two
second time window was used, chosen due to be the
minimum A phase duration.
TEO and Shannon entropy presented good
discriminatory capabilities. The five band
descriptors provided a lower accuracy when
compared to the analysis of power spectral density
(PSD) of each band. The same conclusion occur
when comparing the differential variance with the
autocovariance. The time series analysis could also
be used, since the average power and the standard
variation presented a good correlation with the
presence of the A phases. Other relevant feature
ICPRAM 2018 - 7th International Conference on Pattern Recognition Applications and Methods
396
used in other EEG analysis is the log-energy entropy
(Aydin et al., 2009).
A total of 11 features were analysed in this work.
Specifically: average power; standard variation;
Shannon entropy; autocovariance; log-energy
entropy; TEO; PSD in the delta, theta, alpha, sigma
and beta bands.
The feature selection was performed with a
classifier dependent method (the SFS using the
sequential forward selection method) and a classifier
independent method (the PCA). The seven features
used by Mariani et al. (2012) were also tested in the
developed algorithm.
3.3 Sequential Forward Selection
The implemented sequential forward selection
algorithm initiates with two sets of variables, the
first is empty and the second has all the features.
The most relevant feature is determined in the
first iteration considering the ratio Total=
(Acc+Sen+Spe)/3 and moved from the second set to
the first set.
During the second iteration the algorithm looks
for the second most relevant feature that has the best
compatibility with the first feature, providing the
highest value for Total. This feature is moved from
the second set to the first set and placed after the
first feature.
The Algorithm is repeated until all the features
were moved to the first set, being ordered according
to their relevance.
3.4 Classifier
The discriminant analysis, a supervised learning
classifier, was employed for classification. This
classification method assumes the data to be
produced based on Gaussian distributions. The linear
model (LDA) first determines the mean of each class
and then computes the covariance. Therefore, each
class has the same covariance matrix but with
different means.
The aim of the classifier is to produce a
hyperplane decision surface that divides the feature
space, maximizing the ratio of between-class
variance to within-class variance (Murphy, 2012). In
this work LDA was used in a binary classification
where the results are either an A phase or not an A
phase (considered to be a B phase).
The classifier was tested and validated using a
cross validation scheme (validate with one subject
and train with the others, being used 7 subjects for
training and 7 subjects for testing), producing the
average accuracy (Acc), sensitivity (Sen), specificity
(Spe) and area under the curve (AUC). A FSM was
used to classify the CAP, by implementing the rules
of CAP, being the accuracy (CAPacc) of the results
evaluated.
3.5 Post-processing
A post-processing procedure was introduced to
reduce the outliers of the classification, improving
the CAP accuracy. This procedure considers as a
misclassification an isolated A phase, with only two
seconds, surrounded by two b phases and an isolated
B phase, with only two seconds, surrounded by two
A phases. The misclassified data is converted into
the opposite phase (an A into a B and a B into an A).
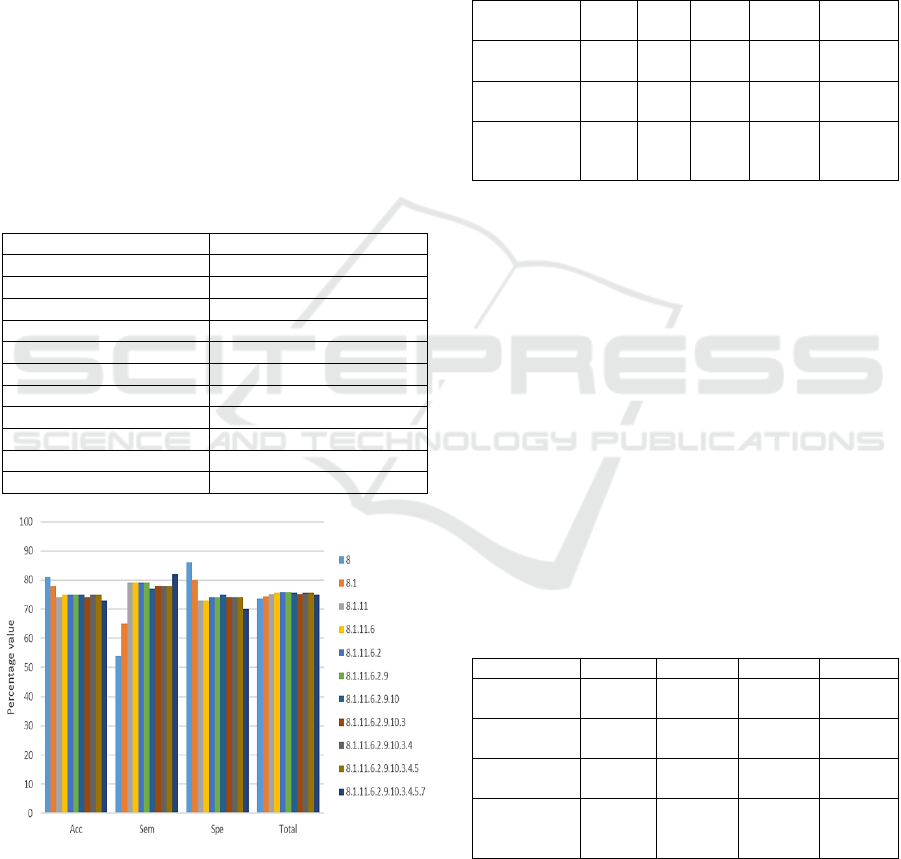
3.6 Finite State Machine
The FSM was developed to implement the two rules
of CAP: the first dictates the validity of the A and B
phases by specifying the minimum duration of 2 s
and a maximum of 60 s of each phase; second rule
indicates that a B phase needs to separate two
successive A phases. The FSM algorithm flowchart
is represented in figure 4.
Figure 4: FSM algorithm flowchart.
4 RESULTS
The influence of the sleep stage in the features was
analysed, concluding that average power, standard
Automatic Detection of a Phases for CAP Classification
397
variation, log-energy entropy and PSD in the delta
and theta bands are strongly correlated with the
sleep stage. This correlation may affect the classifier
performance since the feature behaviour changes
according to the sleep stage. It was also determined
that all features react to the presence of an A-phase
in every sleep stage. However, the highest reaction
happen in the second sleep stage.
The 11 features were used in the first test and the
classifier average accuracy was 72% with a
sensitivity of 82% and specificity of 70%. The CAP
accuracy was 67%. SFS was applied in the second
test being presented in table 1 the order of the
features by relevance (from 1 to 11) and in figure 5
the average results. The best results were achieved
using the first six features with a Total ratio of 76.
PCA was employed in the third test and the best
results were produced using the first three
components (variance of 78%).
Table 1: Features ordered according to the SFS results.
Features
Order
PSD beta
1
Average power
2
PSD theta
3
TEO
4
Standard variation
5
PSD alpha
6
PSD sigma
7
Shannon entropy
8
Log-energy entropy
9
Autocovariance
10
PSD delta
11
Figure 5: Results of the SFS. Legend: 1 - average power; 2
- standard variation; 3 - Shannon entropy; 4 - log-energy
entropy; 5 - autocovariance; 6 - TEO; 7 - PSD delta; 8 -
PSD beta; 9 - PSD alpha; 10 - PSD sigma; 11 - PSD theta.
The final test was the application of the features
used by Mariani et al. (2012) in the developed
algorithm. However, Mariani et al. (2012) used a re-
sampled training set from a different source, using
the same number of samples belonging to the A and
B phases, to avoid biasing the classifier and the
wake and REM periods were removed. The obtained
results are presented in table2.
Table 2: Results of the implemented classifier achieved
with different features.
Employed
features
Acc
(%)
Sen
(%)
Spe
(%)
AUC
CAPacc
(%)
Selected by
SFS
75 ±
5
78 ±
2
74 ±
7
0.76 ±
0.02
75 ± 7
Produced by
PCA
74 ±
6
71 ±
5
75 ±
8
0.73 ±
0.02
76 ± 6
Proposed by
Mariani et
al. (2012)
67 ±
3
79 ±
15
64 ±
4
71 ±
0.07
68 ± 6
The highest accuracy and AUC was achieved
using SFS while PCA provided the best specificity
and CAP accuracy (since the data is unbalanced,
having more B phases then A phases). The features
proposed by Mariani et al. (2012) provided the
maximum sensitivity but with a great variation in the
results.
5 DISCUSSION
Multiple approaches have been presented in the
analysed bibliography for the A-phase detection.
Table 3 summarizes the analysis of the reported
results from papers that have used LDA for
classification and compares with the average results
achieved in the work.
Table 3: Results comparison.
Paper
Method
Acc (%)
Sen (%)
Spe (%)
(Mariani et
al., 2013)
LDA
86
67
90
(Mariani et
al., 2012)
LDA
85
73
87
(Machado et
al., 2016)
LDA
68
-
-
This work
LDA
with
SFS
75
78
74
From table 3 analysis is notorious that our
method produced the highest sensitivity but a lower
accuracy then Mariani et al. (2013) and Mariani et
al. (2012) that have removed the REM periods,
leading to an increase in the overall performance of
ICPRAM 2018 - 7th International Conference on Pattern Recognition Applications and Methods
398
the proposed method. The approach of not removing
the REM periods was also employed by Machado et
al. (2016), however the reported accuracy has the
lowest value.
A more detailed comparison between the results
achieved using the features proposed by Mariani et
al. (2012) is presented in table 4. The achieved
results have a lower accuracy and specificity but a
higher sensitivity. However, the variation of the
results is similar to the variation presented by
Mariani et al. (2012), having sensitivity the more
significant variation. The difference in the results
could be due to the fact that Mariani et al. (2012)
employed a re-sampled training set to balance the
data since, usually, there are much more B phases
than A phases so a low specificity will lead to a
lower accuracy. Therefore, the AUC would provide
a better comparison but this information is not
reported by Mariani et al. (2012). The other relevant
factor is the removal of the REM periods that leads
to better results.
Table 4: Comparison between the results achieved using
the features proposed by Mariani et al. (2012).
Paper
Acc (%)
Sen (%)
Spe (%)
(Mariani et al., 2012)
85 ± 5
73 ± 11
87 ± 6
This work
67 ± 3
79 ± 15
64 ± 4
Comparing the CAP accuracy of the developed
work with the proposal of Karimzadeh et al. (2015),
consisting in classifying directly CAP from the EEG
data, is possible to verify that our results are 4%
lower when comparing with the LDA classifiers.
However, Karimzadeh et al. (2015) have also
removed the REM periods in the analysis so the
direct comparison is not appropriated. Figure 6
summarizes the results with SFS.
Figure 6: Global results with SFS.
6 CONCLUSIONS
This work was produced with the goal of developing
an algorithm capable of detecting the CAP using
first a classifier for the A phase detection and then
apply a FSM to implement the rules of CAP. It was
verified that a combination of SFS, for selecting the
best features, and a post processing procedure
produces the best results. Comparing with the
alternative approach, presented by Karimzadeh et al.
(2015), of directly classify the CAP from EEG, it
was determined that our method produces a similar
accuracy but with simple features.
By comparing with the articles in the state of the
art it was determined that the developed algorithm
has comparable performance without the need to
manually manipulate the database to remove the
REM periods, making the approach of this work
more suitable for automatic system implementation.
ACKNOWLEDGEMENTS
Acknowledgments to the Portuguese Foundation for
Science and Technology for their support through
Projeto Estratégico LA 9 - UID/EEA/50009/2013.
Acknowledgement to ARDITI - Agência
Regional para o Desenvolvimento e Tecnologia
under the scope of the Project M1420-09-5369-FSE-
000001 - PhD Studentship.
REFERENCES
Aydin, S., Saraoglu, H. and Kara, S. (2009) ‘Log Energy
Entropy-Based EEG Classification with Multilayer
Neural Networks in Seizur’, Annals of Biomedical
Engineering, 37(12), pp. 2626-2630.
Barcaro, U. et al. (2004) ‘A general automatic method for
the analysis of NREM sleep microstructure’, Sleep
Medicine, 5(6), pp. 567-576.
Chokroverty, S. (2009) Sleep Disorders Medicine: Basic
Science, Technical Considerations, and Clinical
Aspects. 3rd edn. Philadelphia, USA: Saunders.
Halász, P. et al. (2004) “The nature of arousal in sleep”,
Journal of Sleep Research, 13(1), pp. 1-23.
Karimzadeh, F. et al. (2015) ‘Presenting Efficient Features
for Automatic CAP Detection in Sleep EEG Signals’,
38th International Conference on Telecommunications
and Signal Processing. Prague, Czech Republic, 9-11
July. IEEE, pp. 448-452.
Machado, F. et al. (2016) ‘A-phases subtype detection
using different classification methods’, IEEE 38th
Annual International Conference of the Engineering in
Automatic Detection of a Phases for CAP Classification
399

Medicine and Biology Society. Florida, USA, 16-20
August. IEEE, pp. 1026-1029.
Mariani, S. et al. (2010) ‘Automatic detection of A phases
of the Cyclic Alternating Pattern during sleep’, 32nd
Annual International Conference of the IEEE
Engineering in Medicine and Biology Society. Buenos
Aires, Argentina, 31 August - 4 September. IEEE, pp.
5085-5088.
Mariani, S. et al. (2011a) ‘Automatic detection of CAP on
central and fronto-central EEG leads via Support
Vector Machines’, 33rd Annual International
Conference of the IEEE Engineering in Medicine and
Biology Society. Massachusetts, USA, 30 August - 3
September. IEEE, pp. 1491-1494.
Mariani, S. et al. (2011b) ‘Characterization of A phases
during the Cyclic Alternating Pattern of sleep’,
Clinical Neurophysiology, 122(10), pp. 2016-2024.
Mariani, S. et al. (2012) ‘Efficient automatic classifiers for
the detection of A phases of the cyclic alternating
pattern in sleep’, Medical and Biological Engineering
and Computing, 50(4), pp. 359-372.
Mariani, S. et al. (2013) ‘EEG segmentation for improving
automatic CAP detection’, Clinical Neurophysiology,
124(9), pp. 1815-1823.
Mendez, M. et al. (2014) ‘On Separability of A-Phases
during the Cyclic Alternating Pattern’, 36th Annual
International Conference of the IEEE engineering in
Medicine and Biology Society. Chicago, USA, 26-30,
August. IEEE, pp. 2253-2256.
Murphy, K. (2012) Machine Learning: A Probabilistic
Perspective. 1st edn. Massachusetts, USA: The MIT
Press.
Navona, C. et al. (2002) ‘An automatic method for the
recognition and classification of the A-phases of the
cyclic alternating pattern’, Clinical Neurophysiology,
113(11), pp. 1826-1831.
Schomer D.L. and Silva, F.L. (eds.) (2010)
Electroencephalography: Basic principles, clinical
applications and related fields. 6st edn. Philadelphia,
USA: Lippincott Williams and Wilkins.
Niknazar, H. et al. (2015) ‘A Novel Method to Detect the
A Phases of Cyclic Alternating Pattern (CAP) Using
Similarity Index’, 23rd Iranian Conference on
Electrical Engineering. Tehran, Iran, 10-14, May.
IEEE, pp. 67-71.
Rosa, A. et al. (2006) ‘Visual and automatic cyclic
alternating pattern (CAP) scoring’, Arquivos de
Neuro-Psiquiatria, 64(3), pp. 578-581.
Teplan, M. (2002) ‘Fundamentals of EEG Measurement’,
Measurement Science Review, 2(2), pp. 1-11.
Terzano, M. et al. (2001) ‘Atlas, rules, and recording
techniques for the scoring of cyclic alternating pattern
(CAP) in human sleep’, Sleep Medicine, 2(6), pp. 537-
553.
ICPRAM 2018 - 7th International Conference on Pattern Recognition Applications and Methods
400
