The Strategy Blueprint
A Strategy Process Computer-Aided Design Tool
Adina Aldea, Tania Rizky Febriani, Maya Daneva and Maria-Eugenia Iacob
University of Twenre, Drienerlolaan 5, 7522 AE Enschede, The Netherlands
a.i.aldea@bizzdesign.com, taniarizkyfebriani@student.utwente.nl,m.daneva@utwente.nl, m.e.iacob@utwente.nl
Keywords: Strategy Process, Risk Analysis, Reasoning Tree, Strategy Formulation, Strategy Visualization,
Computer-based Tool, Archimate.
Abstract: Strategy has always been a main concern of organizations because it dictates their direction, and therefore
determines their success. Thus, organizations need to have adequate support to guide them through their
strategy formulation process. The goal of this research is to develop a computer-based tool, known as ‘the
Strategy Blueprint’, consisting of a combination of nine strategy techniques, which can help organizations
define the most suitable strategy, based on the internal and external factors that influence their business. The
research methodology we adopted is design science. To visualize the Strategy Blueprint tool, we use a
spreadsheet-based implementation. Our first evaluation of the tool in real-life settings indicates that the tool
is both useful and easy to use.
1 INTRODUCTION
Nowadays, organizations are faced with continuous
and fast-paced changes in their environments, which
in turn requires them to provide quick responses. To
adapt to these changes, organizations need to design
and implement planned change at a faster rate (Burke,
2013). However, this can prove to be quite a
challenging task. A recent study on the pitfalls of
strategic alignment that organizations were
experiencing, indicated that about 50% of the
participating organizations witnessed problems
during strategy formulation, and between 50% and
90% of the organizations considered they
experienced problems with implementing their
strategies (Roelfsema et al., 2016). More often than
not, organizations experiencing problems with
strategy formulation and implementation face issues,
such as conflicting priorities regarding reaching
strategic goals. Moreover, strategy formulation and
strategy implementation are seen as separate
processes. Also, the strategy is often unsupported by
existing information systems (Roelfsema et al.,
2016). Ultimately, these problems can lead to poor
strategic alignment within an organization, which can
have a negative impact on organizational
performance. Therefore, it is important for
organisations to have a clear, unambiguous strategy
backed up by sufficiently detailed plans (Economist
Intelligence Unit, 2004; Kaplan and Norton, 2005;
Acur and Englyst, 2006; Sull, 2007; Franken,
Edwards and Lambert, 2009;).
Acknowledging the importance of organisations’
ability to formulate, align, and implement their
strategies in order to remain competitive, many tools
and techniques to support this process have already
been introduced. At an operational level, many
standards have been developed, which have been
implemented in a multitude of software solutions,
such as Business Process Management (BPM) and
Enterprise Resource Planning (ERP). Similarly, at a
tactical level, domains such as Business Intelligence
(BI) and Enterprise Architecture (EA), have been
supported by software tools.
However, when looking at a strategic level, very
few software solutions are currently available, most
of which do not support the well-known and used
strategy techniques such as, the Business Model
Canvas (BMC), the SWOT analysis, and the
Balanced Scorecard (BSC). Strategy techniques are
recognized as helpful and even necessary in
streamlining strategy development and execution
(Nohria, Joyce and Roberson, 2003). Therefore, a
software tool implementation of such techniques
could possibly prove valuable to organizations.
Teece (2010) argues, when looking at business
modelling, that there is little support for designing
and analysing business models, which can lead to
125
poor understanding of an organisation and ultimately,
to commercial failure.
The lack of support for
designing and analysing aspects pertaining to the
strategic level is also recognised by Osterwalder and
Pigneur (2013). The authors argue that Information
Systems (IS) research could provide beneficial
guidance on this topic by offering a common
language, conceptual frameworks, and visual
schemas that can help with understanding and
designing strategy techniques, by transforming the
strategy process into a design activity, and by offering
guidance for Computer-Aided Design (CAD), similar
to the one that EA has developed over the years.
Drawing on the observations of Teece (2010),
Osterwalder and Pigneur (2013), in this paper we
argue that for a software tool to be able to help
organizations with designing their strategies, it
should include well-known strategy techniques (e.g.
BMC, SWOT, BSC). As Aldea et al (2013) indicated,
these strategy techniques can also be combined and
linked to each other in order to provide
comprehensive support for the different phases of
strategy design. In this paper, we design such a
software tool, named the Strategy Blueprint. It is a
decision-making tool which includes nine well-
known strategy techniques. These are integrated
within the phases of the strategy process and are also
linked to each other.
Furthermore, we adopt the argument of
Osterwalder and Pigneur (2013) that a software tool
for strategy formulation should use guidance from IS
research. Specifically, for the Strategy Blueprint, we
use knowledge from the EA discipline, in the form of
the ArchiMate modelling language (The Open Group,
2016). ArchiMate serves as a common language
between the different strategy techniques. This
facilitates a better understanding of the role of each
technique and of how the core concepts of each
technique can be related to each other. Moreover, we
applied a qualitative concept mapping approach
(Carnot; 2006; Kinchin, 2008) in order to create a
mapping between the concepts that are used in the
selected nine strategy techniques included in our tool
(i.e. the Strategy Blueprint), and the ArchiMate
modelling language. We did this to ensure that the
results generated with the help of the Strategy
Blueprint can be reused by those practitioners in the
organization that manage the implementation of the
formulated strategy, such as Business Architects or
Enterprise Architects. Such an approach could also
provide valuable insights into how the new
ArchiMate 3.0 can relate to strategy techniques. We
make the note however that our mapping is
qualitative in nature as in the works of Carnot (2006)
and Kinchin (2008), and does not mean to provide a
(possibly automatic) translation of a strategy
described in terms of one technique into a strategy
described in terms of another technique. In the same
vein, our mapping exercise was not aiming at
establishing any transformation rules between the
descriptive concepts of each technique and
Archimate. In contrast to this, we wanted to compare
how the nine strategy techniques organize the
strategy-relevant information that they handle and
how the concepts that these techniques are using,
could possibly share meanings with the meanings of
the conceptual constructs of the ArchiMate modelling
language.
Finally, in this paper we address the need for an
appropriate visualization supporting the
combinations of strategy techniques. We do this by
designing a spread-sheet-based tool. Our main design
goal for this tool is to provide organizations a strategy
formulation instrument that can be used without prior
knowledge about the specific strategy techniques
included in the tool. From a practical standpoint, this
implies that the tool would guide managers and other
strategy-oriented practitioners while using multiple
strategy techniques for strategy formulation, without
prior knowledge.
For the purpose of this research, we follow the
design science research methodology according to
Peffers et al. (2007). This had an impact on the
organization of our paper. In what follows, Section 2
presents background and related work. Section 3
describes the development of the Strategy Blueprint
and its visualization. Sections 4 and 5 contain a
demonstration and evaluation of our proposed
approach and visualization by using a real-life case
study. We conclude with discussion, limitations,
future works, and recommendations in Section 6.
2 BACKGROUND AND RELATED
WORKS
This section provides background on three topics: (1)
strategic alignment and strategy techniques, (2)
reasoning approaches and specifically the approach
of reasoning trees that we will employ to help define
the logic behind designing our tool, the Strategy
Blueprint, and (3) Design Science as a method for
industry-relevant research.
2.1 Strategy Techniques
Strategic alignment means that all elements of a
business - the way the company is organized, the
Seventh International Symposium on Business Modeling and Software Design
126
resources it employs, its assets — are arranged in
such a way as to best support the fulfillment of its
long-term purpose (Santana Tapia, Daneva and van
Eck, 2007). While a company’s purpose is enduring,
strategy includes choices about e.g. what products
and services to offer, which markets to serve, and how
the company should best set itself apart from rivals
for competitive advantage. While a company’s
purpose does not change, strategies and
organizational structures do, which can make chasing
“alignment” between strategy and the organization
feel like chasing an elusive target. Careful
formulation, planning and re-planning of strategy is
therefore of paramount importance. According to
Aldea et al. (2013), the strategy formulation process
involves the following phases: visioning process,
environmental analysis, strategic options, strategic
choices, strategic objectives and metrics. In the
following paragraphs, we present those strategy
techniques that can be used within these phases.
Based on Aldea’s systematic literature review (2017),
we identified nine strategy techniques that we
consider as ‘good candidates’ for inclusion and
adaptation in our computer-aided tool, the Strategy
Blueprint. These techniques are: Brainstorming,
BMC, Porter’s Five Forces, PESTEL, SWOT,
Resource Base View, Confrontation Matrix, BSC,
Blue Ocean Strategy. We chose these strategy
techniques for inclusion, because of their ability to
capture the type of information that is needed for
formulating strategies. While most of these strategy
techniques are well-known (SWOT, BMC, BSC), a
few of them are relatively less popular (Resource
Based View, Six Paths Framework), however they
were selected due to their potential to connect to the
other techniques.
In order to provide support for analyzing the
potential impact of certain decisions, we also include
risk analysis concepts. According to literature, there
are four methods that are commonly used in
performing risk analysis in relation to strategy: real
option analysis (Mikaelian et al., 2011; Rowley,
1989), sensitivity analysis (Lindič et al., 2012),
scenario analysis (Ide et al., 2014), probability and
impact matrix (Project Management Institute, 2008),
and the Monte Carlo simulation (Luko, 2014).
As part of preparing this paper, we considered the
advantages and disadvantages of each type of risk
analysis put forward in these techniques. We ended
up choosing the following two for inclusion in the
Strategy Blueprint: scenario analysis, and the risk
probability and impact analysis. Last, we make the
note that in our tool, we also use the tornado diagram
(Borgonovoa and Plischke, 2016) as a graphical
visualization for opportunity and threat analysis,
instead of using it for risk analysis.
2.2 The Concept of Reasoning Tree
Scholars in psychology, cognitive science and
education define ‘reasoning’ as the process of
drawing conclusions or inferences from information
(e.g. see Lohman and Lakin, 2011). In Strategic
Management literature, however, the concept of
reasoning has so far been mostly combined with
decision-making and problem-solving. E.g., in a
recent publication (Xu, 2011), evidential reasoning is
one of the reasoning concepts addressed in
combination with decision making.
For the purpose of our research, we chose to use
the technique of reasoning trees. It has been widely
used in psychology, artificial intelligence, and
knowledge-based systems, and authors in those fields
indicated its worth. However, we make the note that
its usage in the business domain is under-represented,
especially in relation with strategy formulation.
While studying the available literature on reasoning
trees, we have identified three pairs of reoccurring
reasoning types, namely: (1) inductive and deductive
reasoning, (2) case-based reasoning and rule-based
reasoning, and (3) forward chaining and backward
chaining.
We think that, for the purpose of our research,
backward-chaining (goal-driven) and forward-
chaining (data-driven) are the most suitable reasoning
types. The main reason for this is that backward-
chaining can be very useful to users that already have
a specific goal in mind to achieve. In the case of
forward-chaining, users can take into consideration
all the available information (without a specific goal
in mind) in order to choose the alternative which
provides the highest benefit. Both of these reasoning
types are in line with our vision for the design of the
Strategy Blueprint.
2.3 The Design Science Method
Design Science is the design and investigation of
artifacts in context (Wieringa and Daneva, 2015). As
a research method, it is solution-oriented and is
focused on the interaction of a proposed solution and
the context in which the solution is used. The design
science research process starts with a study of a real-
world problem as experienced by those working in
the field (Hevner et al., 2004). It includes the
following steps (Peffers et al., 2007): problem
identification and motivation, definition of the
objectives for a solution, design and development,
demonstration, evaluation, and communication. Our
research followed these steps. Their detailed
The Strategy Blueprint - A Strategy Process Computer-Aided Design Tool
127
description is in (Febriani, 2016). Because of space
limitations, in this paper we report mostly on the
solution design, its demonstration, and its first
evaluation.
3 THE STRATEGY BLUEPRINT
This section presents our tool, the Strategy Blueprint,
which can support the strategy design process of an
organization. First, we summarize the mapping
between the concepts of the included nine strategy
techniques, and the ArchiMate modelling language.
Second, we describe how the reasoning tree helps
with designing the logic of the Strategy Blueprint.
Finally, we discuss several aspects related to the
visualization of the reasoning tree, which are further
used in the spread-sheet implementation.
3.1 Our ArchiMate Concept Mapping
To better understand and design the relationships
between the phases of the Strategy Blueprint, we have
mapped the core concepts of the nine chosen strategy
techniques to the ArchiMate 3.0 modelling language,
based on the guidelines provided by Aldea et al.
(2015). Table 1 presents our concept map. Therein,
the “x” symbol identifies the concepts included in
those techniques that generate an output usable by
another model. The “-” symbol identifies the concepts
included in those techniques that need input from
another model.
Table 1: Mapping of strategy technique concepts to
ArchiMate.
Goal
Course of Action
Capability
Resource
Actor
Value
Interface
Collaboration
Assessment
Driver
Metric
Product/Service
Vision x
M
ission x
B
M
C
x x x x x x x
SWOT - - - x -
P
ESTEL x
B
S
C
x x x
TOWS x
B
rainstormin
g
x x
P
orter’s 5
F
- x
R
isk analysis x -
B
lue Ocean x - - x - -
Based on this mapping (Table 1), the scope of the
strategy techniques, and of the phases of the strategy
formulation process, we have designed the logic of
the Strategy Blueprint. This logic is presented in the
form of a reasoning tree, which illustrates the
different routes that users can take to formulate their
strategies with the help of the Strategy Blueprint.
3.2 Our Design of the Reasoning Tree
The design of the reasoning tree draws on the work of
Aldea et al. (2013) about strategic planning and
enterprise architecture. According to these authors,
there are three main steps in the strategic planning
process: Visioning Process, Strategy Formulation,
and Strategy Implementation. As mentioned earlier,
the strategy implementation is outside the scope of
this research, and is not covered by the reasoning tree.
However, our research includes two additional phases
that are different from the work of Aldea et al. (2013),
namely, market analysis and risk analysis. These two
phases are not mandatory in strategic planning, yet we
consider them helpful for organizations, for
optimizing the results of their decisions. Based on the
method proposed in Aldea et al. (2013), and the 11
strategy techniques mentioned in Section 2, we
develop our reasoning tree for strategy formulation,
as shown in Figure 1.
The reasoning tree contains six main phases and
five alternate paths. Some phases of the reasoning tree
can generate an output which can be used, as an input
for a next phase. An example of this is the Strategy
Formulation phase which depends on the result of the
Environmental Analysis phases.
Other phases, though related, are not directly
dependent on each other. Visioning Process and
Business Modelling are examples of two phases that
are not explicitly dependent on other phases, but they
do relate to each other. An organization’s vision and
mission influence its business model, and vice versa.
The components of the business model are essential
parts for realizing the vision and for ensuring that a
mission can be accomplished.
Thus, while going through the different phases of
the reasoning tree, analysis and decisions can be made
based on the cumulative outputs of the previous
phases. As it can be seen in, each phase in the
reasoning tree consists of several strategy technique
that can be related to the each other.
3.3 Visualization
In order to visualize the Strategy Blueprint, we utilize
Numbers, the spreadsheet application provided by
Apple. Numbers has several benefits: its overall look,
Seventh International Symposium on Business Modeling and Software Design
128
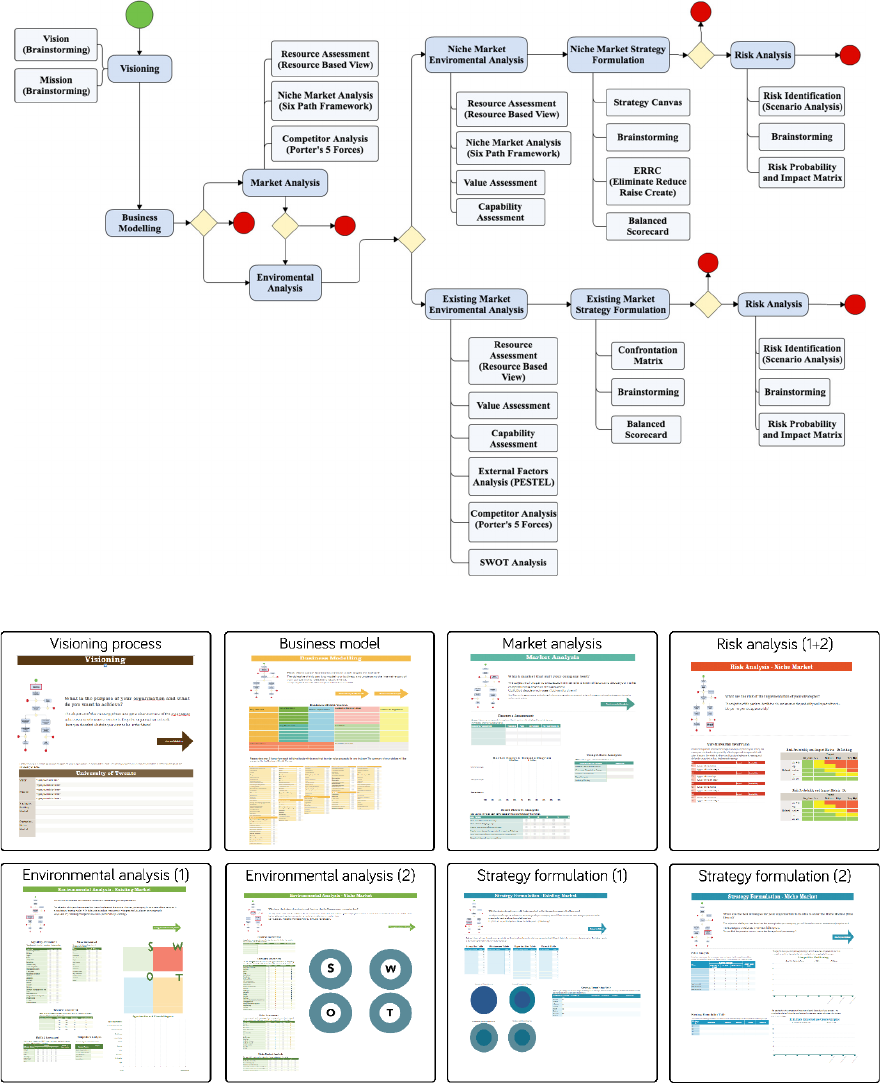
Figure 1: The reasoning tree supporting the Strategy Blueprint.
Figure 2: Overview of the phases of the Strategy Blueprint.
its user interface and its simplicity. Although,
Microsoft Excel is more powerful in terms of features
and complex data processing, we opted to use
Numbers because of its ease of use, and because we
do not need to use complex data processing. This
choice is based on the argument that users of a
strategy formulation tool do not have to possess
advanced programming or modelling skills. Using
simple formulas and the available features in
Numbers, we can visualized and implement our
The Strategy Blueprint - A Strategy Process Computer-Aided Design Tool
129
reasoning tree, mostly with the help of charts and
tables. Drawing upon the work of Eppler, Platts and
Kazancioglu (2009), our visualization offers a ready-
to-use structure for organizing and synthesizing
information (e.g., line chart, tornado diagram, matrix,
and pie chart). To generate these visualizations,
different types of inputs are used: self-type,
checkbox, stepper, and drop down list. Figure 2
illustrates an overview of the Strategy Blueprint
phases.
4 CASE STUDY AND
DEMONSTRATION
This section demonstrates the application of the
Strategy Blueprint in a real-world case study in the
context of a public organization in Europe. Because
of confidentiality agreements, we anonymized the
organization and its data. The organization is a Higher
Education institution, from here on referred to as ‘the
University’. We use the visualizations created in
Numbers to illustrate how the different phases of the
tool can be used in practice.
4.1 Our Case Description
The University is a relatively young organization,
with only half a decade of history. It has a distinctive
entrepreneurial character, and a strong focus on new
technology development and its significance for
people and society. Despite its entrepreneurial spirit,
in the past few years, the University was facing
several internal challenges (e.g. unclear profile, low
graduation rates of students, relatively undervalued
research) and external challenges (e.g. regulation
changes, decreasing market share, and reduction of
government funding) which have forced a significant
change in the overall strategic intent. Since 2008, the
University has developed a very detailed strategic
plan, which covers solutions for addressing the above
mentioned challenges. We used some of the details of
this strategic plan in order to illustrate how the
Strategy Blueprint tool can be applied.
4.2 The Case Demonstration
4.2.1 Visioning Phase
The University’s vision, which is already defined,
sets a strategic direction that needs to be followed for
the next 4 years. It describes what kind of university
they want to be and outlines what they want to do to
further develop and achieve that vision. It includes the
following statements:
• Facilitate spin-offs founded by student
entrepreneurs;
• Provide a full range of high-quality education
programs at both undergraduate and graduate
levels, with differentiation/specialization and
profiling in the Master’s phase, based on the
strengths of University’s research;
• Strengthen the University’s international,
national, and regional networks and alliances;
• Make a difference through the University’s
research and ensure that its results are used to
improve and, if possible, even save lives.
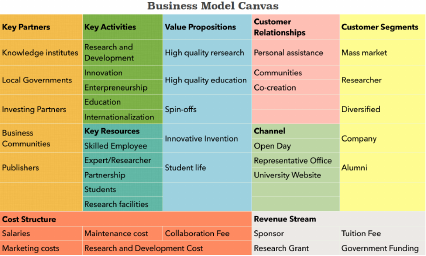
4.2.2 Business Modelling
This section defines the University’s business model
using the BMC (Osterwalder and Pigneur, 2010). The
number of items per building block of the BMC is
limited to 5 or less, so that we can focus on the most
important aspects of the organization. Based on the
vision, the available information that has been
provided, our own knowledge, and our assumptions
about how the University runs its business, the BMC
shown in Figure 3 has been created.
Figure 3: Business Model Canvas of the University.
4.2.3 Market Analysis
In this phase, we present the results of the market
analysis for the University. Three aspects are
analyzed: the competitors (Porter’s 5 Forces), the
resources, and the alternative market (Blue Ocean
Strategy). Based on the information filled in the
business model phase, for the Key Resources block,
five resources are defined: skilled employees, experts
and researchers, partnerships, students, and research
facilities. The resource assessment is performed
based on the four criteria in the Resource-Based View
of the firm, which are: rare, valuable, inimitable, and
non-substitutable (Barney, 1991).
Seventh International Symposium on Business Modeling and Software Design
130
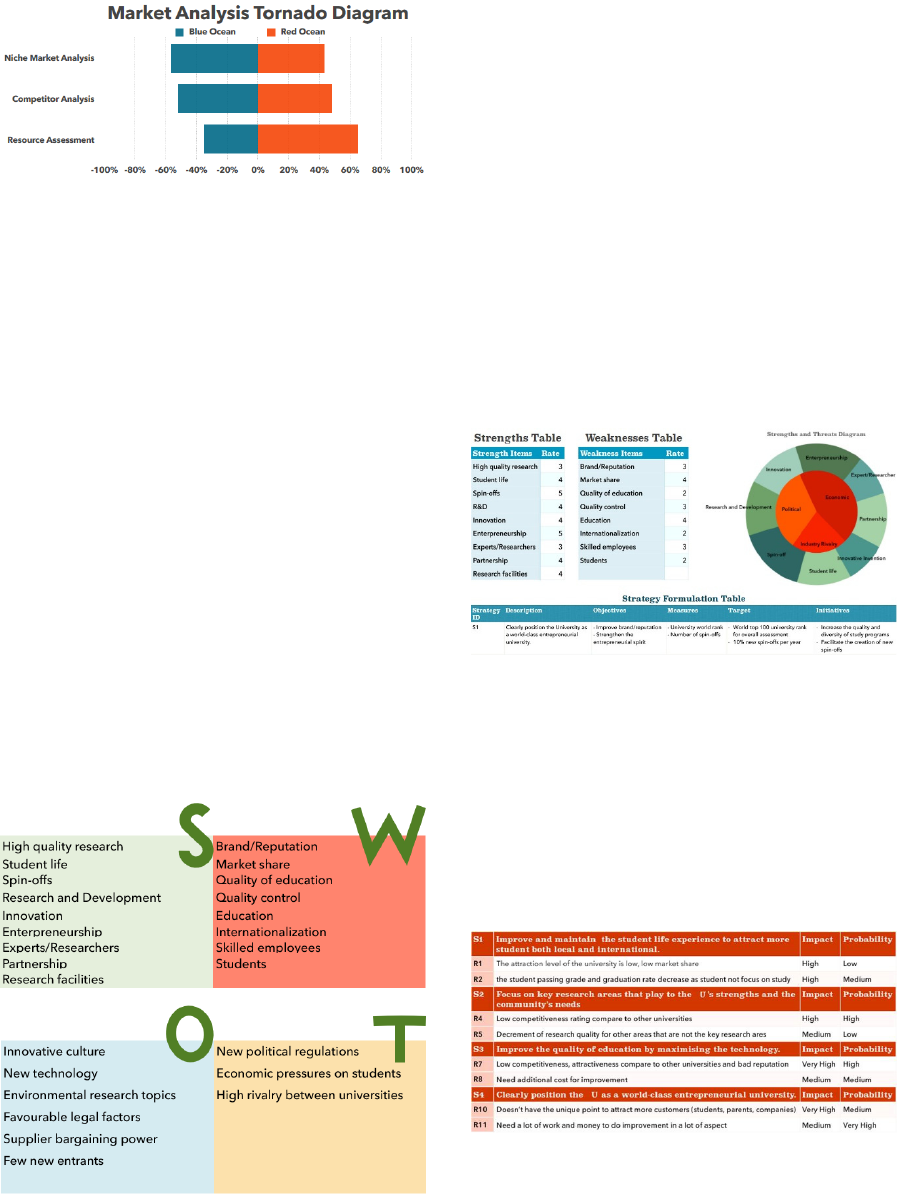
Figure 4: Market Analysis Diagram of the University.
Based on these criteria, the weaknesses of the
University are identified as the number of skilled
employees and the students. Regarding the other three
resources, the University can be considered as quite
competitive. As it can be seen in Figure 4, the overall
results of the assessment in this phase show that the
University leans more towards the existing market
rather than a niche market. Thus, the next step is the
Environmental Analysis phase, for the existing
market.
4.2.4 Environmental Analysis
In this phase, five aspects are analyzed: capabilities,
value, resources, competitors, and the macro-
environment. Capabilities, values, and resources are
the internal factors of the organization that are linked
to the Key activities, Value proposition, and Key
Resources are building blocks of the BMC. The
competitors and macro-environment are considered
as the external factors of the organization, which are
analyzed with the help of Porter’s 5 Forces and the
PESTEL analysis. The results are presented in a
SWOT matrix format (see Figure 5).
Figure 5: Internal/External factors of the University.
4.2.5 Strategy Formulation
In this phase, we detail the strategy of the University
by using the Confrontation Matrix and the BSC. The
results are presented in four pie charts, depicting the
elements of the Confrontation Matrix. Based on these
results, several alternative strategies are detailed in a
BSC, which normally consists of four perspectives
(financial, customer, internal, learning and growth).
We adjust these perspectives to facilitate a clear
connection between the Confrontation Matrix and the
BSC, hence renaming them as follows: reactive,
offensive, adjusting, and defensive strategy. Each
perspective is related to different Confrontation
Matrix pie charts. The formulated strategies are
further elaborated with the help of the BSC. Figure 6
illustrates an excerpt of the SWOT factors, the
Confrontation Matrix pie chart, and the BSC table.
Figure 6: Excerpt results of Strategy formulation.
4.2.6 Risk Analysis
In this phase, the risks of the strategies formulated in
the previous phase, are identified. To simplify this
assessment, two types of risks are identified: the risk
of not pursuing the strategy and the risk resulting
from the implementation of the strategy. These risks
are assessed based on the probability to materialize,
and the impact they would have (Figure 7).
Figure 7: Risk analysis of the formulated strategies.
The Strategy Blueprint - A Strategy Process Computer-Aided Design Tool
131
5 EVALUATION
A preliminary evaluation of our approach was
performed by means of a workshop with five
practitioners. During this workshop, we briefly
introduced our research and demonstrated its
implementation. At the end of the workshop, each
participant was asked to fill in a survey to provide
their feedback regarding our research. For this
purpose, we designed a questionnaire based on the
guidelines proposed from the Unified Theory of
Acceptance and Use of Technology (UTAUT)
(Venkatesh et al., 2003). UTAUT can be used to
understand user acceptance of technology, but can
also be adapted to methods, models, and approaches.
Since the objective of the evaluation process is to
analyze the user acceptance of our approach
regarding guiding organizations during strategy
formulation, we consider the UTAUT to be highly
suitable for this task. From the many constructs
proposed by Rowley (1989), we chose the following
six to use in our questionnaire: performance
expectancy (Q1.1 – Q1.3), effort expectancy (Q2.1 –
Q2.2), facilitating conditions (Q3.1 – Q3.4), attitude
towards using technology (Q4.1 – Q4.3), self-efficacy
(Q5.1 – Q5.4), and behavioral intention to use the
technology (Q6.1 – Q6.3). The full list of constructs
and statements used in the evaluation workshop is
shown in Table 2, where we also report four
descriptive statistics for the questionnaire statements
such as: minimum (Min) and maximum (Max)
values, average (Avg.) values, and the standard
deviation (Std. dev.). A 7-point Likert scale was used
to rate the statements of the questionnaire, with ‘1’
representing the lowest (don’t agree), ‘7’ representing
the highest (agree), and ‘4’ representing a neutral
response.
As can be seen in Table 2, the majority of the
statements from the questionnaire received an
average rating from the respondents of 4 or above.
From this, we can conclude that overall rating
provided by the respondents was at least neutral with
most statements receiving a positive average rating.
Furthermore, most the standard deviations for the
statements in the questionnaire were lower than 1.
This suggests a consensus among respondents in a
majority of cases. Therefore, we can conclude that the
opinions of the respondents were in many cases
similar and positive towards the Strategy Blueprint.
While evaluating the results of the first category
of statements relating to performance expectancy
(Q1.1 – Q1.3) we can conclude that our respondents
considered the Strategy Blueprint as a useful tool for
strategy formulation (avg. 5,8), which is easy to use
(avg. 5,6), and can increase their productivity (avg.
5,2). Therefore, we can argue that these results
support our claim that the Strategy Blueprint is a
suitable tool for strategy formulation.
In case of the effort expectancy statements (Q2.1
– Q2.2), similarly to the previous category, we can
conclude that the respondents considered that the
Strategy Blueprint is an easy to use (avg. 5,6) and
easy to learn tool (avg. 5,2). Similarly, we can
observe that the opinions of the respondents are alike,
with both statements having a standard deviation of
lower than 1. Therefore, we can argue that these
results support our claim that the Strategy Blueprint
is a tool which can be used and learned by
practitioners with ease.
The third category of statements, which focuses
on the attitude of the respondents towards the
Strategy Blueprint (Q3.1 – Q3.4), also indicates an
overall positive opinion of the respondents (avg. 5,4 -
5,8). In the case of these statements, we can also
observe a standard deviation lower than 1, which
suggests similar opinions of the respondents.
Therefore, we can argue that these results support our
claim that using the Strategy Blueprint for strategy
formulation is a good idea (avg. 5,8; std. dev. 0,44).
In terms of the statements regarding the
facilitating conditions (Q4.1 – Q4.3), the average
scores provided by the respondent were lower than in
other categories of statements (avg. 4 – 4,8).
Furthermore, the opinions of the respondents
regarding these statements are also very dispersed,
with a standard deviation between 1,3 and 2,16. This
indicates that some of the respondents consider that
the facilitating conditions needed to use the Strategy
Blueprint are sufficient, while others disagree. One of
the possible explanations for these results could be
that the choice of using Numbers as the platform for
the Strategy Blueprint is not seen as equally favorable
by all respondents (Q4.3). This is also reflected in the
statement concerning the resources need to use the
tool, where respondents also provide disparate
responses (Q4.1). Therefore, in a future iteration of
the Strategy Blueprint, an alternative to the Numbers
spreadsheet tool should be considered.
Regarding the statements concerning self-efficacy
(Q5.1 – Q5.4), we can also observe a difference in the
opinions of the respondents, with average scores
ranging from 4 to 6,2 and standard deviations ranging
from 0,44 to 1,41. Therefore, we can conclude that
the respondents consider that they can accomplish a
task using the Strategy Blueprint, provided that there
is sufficient guidance, in the form of built-in guidance
or a person to aid in this task. However, we can argue
that given more time to explore the existing built-in
guidance and semi- automation included in the Strate-
Seventh International Symposium on Business Modeling and Software Design
132

Table 2: Descriptive statistics for the evaluation workshop.
Questionnaire statements Min Max Avg Std. dev.
Q1.1: I would find the Strategy Blueprint is useful in helping me formulate the strategy. 5 6 5,8 0,4472
Q1.2: Using the Strategy Blueprint enables me to accomplish strategy formulation tasks more
quickly.
4 6 5,6 0,8944
Q1.3: Using the Strategy Blueprint increases my productivity. 4 6 5,2 0,8366
Q2.1: I would find the Strategy Blueprint is easy to use. 5 6 5,6 0,5477
Q2.2: Learning to use the Strategy Blueprint is easy for me. 4 6 5,2 0,8366
Q3.1: Using the Strategy Blueprint for strategy formulation is a good idea. 5 6 5,8 0,4472
Q3.2: The Strategy Blueprint makes strategy formulation more interesting. 4 6 5,6 0,8944
Q3.3: Working with the Strategy Blueprint is fun. 4 6 5,4 0,8944
Q3.4: I like working with the Strategy Blueprint. 5 6 5,8 0,4472
Q4.1: I have the resources necessary to use the Strategy Blueprint. 2 6 4 1,5811
Q4.2: I have the knowledge necessary to use the Strategy Blueprint. 3 6 4,8 1,3038
Q4.3: The Strategy Blueprint is compatible with other systems I use. 2 7 4,2 2,1679
Q5.1: I could complete a job or task using the Strategy Blueprint if there was no one around to tell
me what to do as I go.
2 5 4 1,4142
Q5.2: I could complete a job or task using the Strategy Blueprint if I could call someone for help if
I got stuck.
6 7 6,2 0,4472
Q5.3: I could complete a job or task using the Strategy Blueprint if I had a lot of time to complete
the job for which the method was provided.
4 7 5,4 1,1401
Q5.4: I could complete a job or task using the Strategy Blueprint if I had just the built-in guide for
assistance.
4 6 5,2 0,8366
Q6.1: I intend to use the tool in the future for helping me formulate the strategy. 4 5 4,4 0,5477
Q6.2: I predict I would use the tool in the future for helping me formulate the strategy. 3 5 4,2 0,8366
Q6.3: I plan to use the tool in the future for helping me formulate the strategy. 2 5 4 1,2247
gy Blueprint, the respondents’ opinions might
become more positive. Finally, in the case of the
statements regarding the intention to use the Strategy
Blueprint (Q6.1 – Q6.3), the average opinion of the
respondents is neutral to slightly positive (avg. 4 –
4,4), with a standard deviation ranging from 0,54 to
1,22. These results indicate that the respondents are
mostly neutral towards using the Strategy Blueprint
for strategy formulation. We argue that these results
could be motivated by the opinions of the respondents
regarding the facilitating conditions and self-efficacy
statements. This indicates that, even though the
Strategy Blueprint is seen as a useful and easy to use
strategy formulation tool, the chosen platform for its
implementation (Numbers) and the short amount of
time allotted to the built-in guidance and automation
of the tool, might have influenced their intention to
use the Strategy Blueprint in a negative manner.
6 CONCLUSION
In this paper we proposed a computer-based tool for
strategy formulation − the Strategy Blueprint. It
integrates strategy techniques, a reasoning tree, and is
implemented in a spreadsheet-based application. The
tool is meant to help the organizations by providing
guidance through the strategy formulation process, by
giving an overview of factors that influence their
organization, and by facilitating decision-making and
risk analysis. This has been achieved by combining
nine strategy techniques and a risk analysis technique.
The relationships between these techniques have been
designed with the help of a concept mapping to the
ArchiMate constructs, in order to determine those
concepts that are shared between the techniques and
also those outputs of one technique that could be used
as inputs for another technique. Furthermore, the
logic of the Strategy Blueprint has been designed with
the help of a reasoning tree. This reasoning tree
includes all the six main phases and five alternate
paths, each of them supported by several interlinked
techniques. Moreover, the Strategy Blueprint is
implemented in the spreadsheet-based application
Numbers, which includes several crucial features that
have made semi-automating the process of strategy
formulation possible.
The results of our first evaluation − the workshop
with the practitioners, indicate that the respondents
consider the Strategy Blueprint as a suitable tool for
strategy formulation, which is easy to use and learn.
However, the choice of the implementation platform
might need to be revisited in future research.
Similarly, the built-in guidance and the semi-
The Strategy Blueprint - A Strategy Process Computer-Aided Design Tool
133
automation of the Strategy Blueprint might need to be
given more attention in a future workshop in order to
ensure that the participants are able to better
experience its benefits.
6.1 Limitations and Future Work
Our research has several limitations. First, we
selected nine strategy techniques, while many more
exist in both literature and practice. In future work,
alternative combinations of strategy techniques
should be considered in order to determine those that
are the most suitable for formulating a strategy.
Second, further improvements of the Strategy
Blueprint should include implementations in
platforms compatible to Windows-based systems. We
consider that such an approach would address many
of the results regarding the facilitating conditions
statements included in the questionnaire, and possibly
even the ones regarding the intention to use.
Furthermore, in future evaluation workshops a
stronger emphasis should be made regarding the
built-in guidance and semi-automation of the Strategy
Blueprint. We argue that such an approach would
help address the results regarding the self-efficacy
statements in the questionnaire, and possibly even the
ones regarding the intention to use.
Third, following Wieringa and Daneva (2015), we
acknowledge the need for more evaluation to improve
the generalisability of the results. A central question
in this respect is evaluating the extent to which our
current results could be observable in other similar
but different organizations (e.g. other Higher
Education organizations, and in other countries).
Additionally, the participants in these future
evaluation workshops should be selected based on
their involvement in the strategy formulation process.
Finally, there are also several recommendations
regarding the tool, such as the link between the tool
and ArchiMate should be elaborated, to facilitate
automatic import/export of information to other tools
that support the ArchiMate modelling language. This
could prove very helpful for EA practitioners, as they
will be able to create strategic models with ArchiMate
in an easier and more automated manner.
Furthermore, an extension for “positive” risks
(opportunities/benefits) in the risk analysis could be
included in the tool to give a more complete overview
of all types of risk. Moreover, our tool is just a
prototype that demonstrates the concept.
Nevertheless, the design of the tool (possibly with
some adaptation) can be used to create a similar
implementation, for example using Microsoft Excel.
REFERENCES
Acur, N. and Englyst, L. 2006. Assessment of strategy
formulation: How to ensure quality in process and
outcome. Int. Journal of Oper. and Prod. Mgmt. 26(1).
Aldea, A. 2017. Enterprise Strategic Alignment Method: A
cross-disciplinary capability-driven approach. Ph.D.
Thesis, University of Twente.
Aldea, A., Iacob, M.E., Quartel, D. and Franken, H. 2013.
Strategic planning and enterprise architecture. In Proc.
of the 1st Enterprise Systems Conference, IEEE, 1-8.
Aldea, A., Iacob, M.E., van Hillegersberg, J., Quartel, D.,
Franken, H. and Bodenstaff, L. 2015. Modelling
strategy with ArchiMate. In Proc. of the 30th Symp. on
Applied Computing (SAC 2015), ACM, 1211-1218.
Barney, J. (1991). Firm resources and sustained competitive
advantage. Journal of Mgmt., 17(1).
Borgonovoa, E. and Plischke, E. 2016. Sensitivity analysis:
A review of recent advances. European Journal of
Operational Research, 248, 869-887.
Burke, W.W. 2013. Organization change: Theory and
practice. Thousand Oaks, CA: Sage Publications.
Carnot, M. J. 2006. Using concept maps to organize
information for large scale literature reviews and
technical reports: two case studies. Proc. of the 2
nd
Int.
Conf. on Concept Mapping. Retrieved from:
http://cmc.ihmc.us/cmc2006Papers/cmc2006-p225.pdf
Economist Intelligence Unit. 2004. Strategy execution:
Achieving operational excellence Retrieved from:
http://graphics.eiu.com/files/ad_pdfs/celeran_eiu
_wp.pdf
Eppler, M.J., Platts, K.,and Kazancioglu, E. 2009. Visual
strategizing: The systematic use of visualization in the
strategy process. Long Range Planning, 42(1).
Febriani, T.R. (2016) Strategic Planning Using Reasoning
Tree-Based Approach. University of Twente. Retrieved
from: http://essay.utwente.nl/70785/
Franken, A., Edwards, C. and Lambert, R. 2009. Executing
strategic change: Understanding the critical
management elements that lead to success. California
Management Review, 51(3), 49–73.
Hevner, A.R., March, S.T., Park, J., Ram, S., Design
Science in Information Systems Research. MIS
Quarterly 28(1): 75-105 (2004)
Ide, M., Kishida, T., Aoyama, M. and Kikushima, Y. 2014.
An IT-driven business model design methodology and
its evaluation. In Proc. of the 1st Int. Workshop on the
Interrelations between Req. Eng. and Business Process
Mgmt. IEEE, 1-10.
Kaplan, R.S. and Norton, D.P. 2005. Creating the office of
strategy management Retrieved from:
https://pdfs.semanticscholar.org/5d44/754da8dd15418
544ed330ff52138f35f110b.pdf
Kinchin, I.M. 2014. Concept mapping as a learning tool in
higher education: A critical analysis of recent reviews,
Journal of Continuing Higher Education, 62(1), 39-49.
Lindič, J., Bavdaž, M. and Kovačič, H. 2012. Higher
growth through the blue ocean strategy: Implications
for economic policy. Research Policy, 41(5), 928-938.
Seventh International Symposium on Business Modeling and Software Design
134
Lohman, D.F. and Lakin, J.M. 2011. Intelligence and
reasoning. In: The Cambridge Handbook of
Intelligence, Cambridge Univ. Press, Cambridge.
Luko, S.N. 2014. Reviews of standards and related
material: Risk assessment techniques. Quality
Engineering, 26, 379–382.
Mikaelian, T., Nightingale, D., Rhodes, D. and Hastings, D.
2011. Real options in enterprise architecture: A holistic
mapping of mechanisms and types for uncertainty
management. IEEE Transactions on Engineering
Management, 58(3), 457-470.
Nohria, N., Joyce, W. and Roberson, B. 2003. What really
works. Harvard Business Review, 81(7), 42–55.
Osterwalder, A. and Pigneur, Y. 2010. Business model
generation: A handbook for visionaries, game
changers, and challengers. John Wiley & Sons.
Osterwalder, A. and Pigneur, Y. 2013. Designing business
models and similar strategic objects: The contribution
of IS. Journal of the AIS, 14(5), 237–244.
Peffers, K., Tuunanen, T., Rothenberger, M. and Chatterjee,
S. 2007. A design science research methodology for
information systems research. Journal of Management
Information Systems, 24(3).
Project Management Institute. 2008. A guide to the Project
management body of knowledge (PMBOK), Project
Management Institute, 4th ed.
Roelfsema, M., Aldea, A., Lankhorst, M. and Franken, H.
2016. How about strategy? A survey into the pitfalls of
strategic alignment. Journal of Enterprise Architecture,
12(1), 7–18.
Rowley, I. 1989. Managing in an uncertain world: Risk
analysis and the bottom line. Proc. of the Coll. on Syst.
Eng. Contrib. to Increased Profitability. IEEE 3.1-3.8.
Santana Tapia, R. Daneva, M., and van Eck, P. 2007.
Validating Adequacy and Suitability of Business-IT
Alignment Criteria in an Inter-Enterprise Maturity
Model 202. In: Proc. of the 11
th
Int. Enterprise
Distributed Object Comp. Conf. (EDOC 2007), IEEE.
Sull, D.N. 2007. Closing the gap between strategy and
execution. Sloan Managem. Review, 48(4), pp. 30-38.
Teece, D. 2010. Business models, business strategy and
innovation. Long Range Planning, 43(2-3), 172–194.
The Open Group. 2016. ArchiMate® 3.0 Specification
Open Group Standard C162, 2016. Retrieved from:
https://www2.opengroup.org/ogsys/catalog/C162.
Venkatesh, V., Morris, M.G., Davis, G.B. and Davis, F.D.
(2003). User acceptance of information technology:
Toward a unified view. MIS Quarterly, 27(3).
Wieringa, R. and Daneva, M. 2015. Six strategies for
generalizing software engineering theories. Sci.
Comput. Program. 101, 136-152
Xu, D. 2011. An introduction and survey of the evidential
reasoning approach for multiple criteria decision
analysis. Annals of Operations Research, 195(1).
The Strategy Blueprint - A Strategy Process Computer-Aided Design Tool
135
