
Evaluating Open Source Business Intelligence Tools using OSSpal
Methodology
Tânia Ferreira
1
, Isabel Pedrosa
2
and Jorge Bernardino
1,3
1
Polytechnic of Coimbra, Institute of Engineering of Coimbra – ISEC,
Rua Pedro Nunes, Quinta da Nora, 3030-199 Coimbra, Portugal
2
Polytechnic of Coimbra, Coimbra Business School – ISCAC, Quinta Agrícola - Bencanta, 3040-316 Coimbra, Portugal
3
CISUC – Centre for Informatics and Systems of the University of Coimbra, Portugal
Keywords: Business Intelligence Tools, Open Source Tools, OSSpal Methodology, Birt, Jaspersoft, Pentaho, SpagoBI.
Abstract: Business Intelligence (BI) is a set of techniques and tools that transform raw data into meaningful information.
BI helps business managers to make better decisions, which reflects into a better competitive advantage. Open
source tools have the main advantage of not increasing costs for companies although it is necessary to choose
an appropriate tool to meet their specific needs. For a more precise evaluation of open source BI tools, the
OSSpal assessment methodology was applied, which combines quantitative and qualitative evaluation
measures. Using the OSSpal methodology, this paper compares four of the top business intelligence tools:
BIRT, Jaspersoft, Pentaho and SpagoBI.
1 INTRODUCTION
Business Intelligence (BI) is the transformation of
information stored in knowledge, making it possible
to provide adequate information to a particular user at
the appropriate time in order to support the decision-
making process in real time (Brandão et al., 2016).
Thus, BI integrates a set of tools and technologies that
enable the collection, integration, analysis, and
visualization of data.
For the implementation of a BI platform, it is
necessary to perform some intermediate steps that are
considered crucial for the successful implementation
of a BI system (Completo et al., 2012). BI systems
have applied the functionality, scalability, and
security of existing database management systems to
build Data Warehouses (DW) that are analyzed using
Online Analytical Processing (OLAP) and Data
Mining techniques. A Data Warehouse is a repository
for storing organization information in a valid and
consistent format, and the OLAP technology allows
the creation of quick responses to analytical queries.
Data Mining tools allow us to find patterns and
connections in a given dataset.
BI systems may reveal several advantages such as
increasing business competitiveness, increase
business knowledge, making more efficient decisions
and improving business processes (Ranjan, 2009).
To take full advantage of BI, a tool must be
chosen to meet business needs. Open source tools are
particularly suitable to SMEs (Tereso and
Bernardino, 2011; Lapa et al., 2015). In this work, in
an effort not to increase companies’ costs, only open
source BI tools are analysed.
The OSSpal open source software assessment
methodology has recently emerged as a successor of
the Business Readiness Rating (OpenBRR).
OSSpal assessment methodology combines
quantitative and qualitative evaluation measures for
software in several categories to determine which tool
has the best score.
In this paper we apply the OSSpal methodology
to the top four business intelligence tools to determine
which tool has the best score.
The present paper is organized as follows: in
Section 2 related work is presented. Section 3
describes the four open source business intelligence
tools. Section 4 presents a description of the OSSpal
methodology and Section 5 presents the evaluation of
the tools with the application of the OSSpal
methodology. Finally, Section 6 presents the
conclusions and future work.
Ferreira T., Pedrosa I. and Bernardino J.
Evaluating Open Source Business Intelligence Tools using OSSpal Methodology.
DOI: 10.5220/0006516402830288
In Proceedings of the 9th International Joint Conference on Knowledge Discovery, Knowledge Engineering and Knowledge Management (KDIR 2017), pages 283-288
ISBN: 978-989-758-271-4
Copyright
c
2017 by SCITEPRESS – Science and Technology Publications, Lda. All rights reserved
2 RELATED WORK
In (Petrinja et al., 2010) the authors researched the
quality and usability of three Free/Libre Open Source
Software assessment models: the Open Business
Readiness Rating (OpenBRR), the Qualification and
Selection of Open Source software (QSOS), and the
QualiPSo OpenSource Maturity Model (OMM).
They concluded that all the three models contain
some questions and proposed answers that are not
clear to the evaluators, therefore should be rewritten
or explained better. The critical aspects of each model
were: Functionality and Quality for OpenBRR;
Adoption, Administration/Monitoring, Copyright
owners, and Browser for QSOS; and Quality of the
Test Plan, and the Technical Environment for OMM.
Deprez and Alexandre (2008) describe the
advantages and disadvantages of each of the
methodologies, being that OpenBRR allows selecting
the criteria to adapt them to a context and that the
QSOS is ambiguous in more than half of its criteria.
In Marinheiro and Bernardino (2013), the authors
consider that evaluating open source software under
a recognized method is important to ensure its quality.
They evaluated the Open Source Business
Intelligence Suite Pentaho using OpenBRR (Business
Readiness Rating for Open Source), an open source
software assessment methodology. After applying
this methodology, the authors concluded that Pentaho
Community Edition is rated as “good” software.
Marinheiro and Bernardino (2015) compared the
last versions of the five main Open Source Business
Intelligence suites: Jaspersoft, Palo, Pentaho,
SpagoBI and Vanilla validating the existence or
nonexistence of features important to BI. They
applied the OpenBRR methodology to the SpagoBI
and Pentaho tools because they presented the most
features. The authors concluded that SpagoBI was the
tool that obtained the highest score.
To the best of our knowledge, this is one of the
first papers to use OSSpal methodology to evaluate
open source Business Intelligence tools.
3 BUSINESS INTELLIGENCE
TOOLS
To apply the OSSpal methodology, it was necessary
to find the best tools. Initially, we have done a survey
of the better business intelligence tools referred in the
tops published during this year. Each tool has been
assigned a value from 1 to 7, according to the position
in the top, in order to give a higher score to the tool
that is the first in top. Finally, the sum of the scores
were performed and the tools that were considered the
best were found. We concluded that the most
prominent tools are BIRT, Jaspersoft, Pentaho and
SpagoBI. A brief description of each of these tools
will be given in the next sections.
3.1 BIRT
First released in 2004, BIRT is an open source
business intelligence reporting platform and is part of
the Eclipse open source project.
BIRT consists of two main components: BIRT
Report Designer and BIRT Runtime. The Report
Designer is projected to be easy to use and it can be
used to create report layouts and produce XML-based
report designs. BIRT Runtime, also known as the
‘BIRT Report Engine’, is a set of Java classes and
APIs that takes the XML-based report designs,
queries the data sources, merges the query data into
the report layouts, and then produces output in
HTML, PDF, Excel or other formats (Hayhow, 2017).
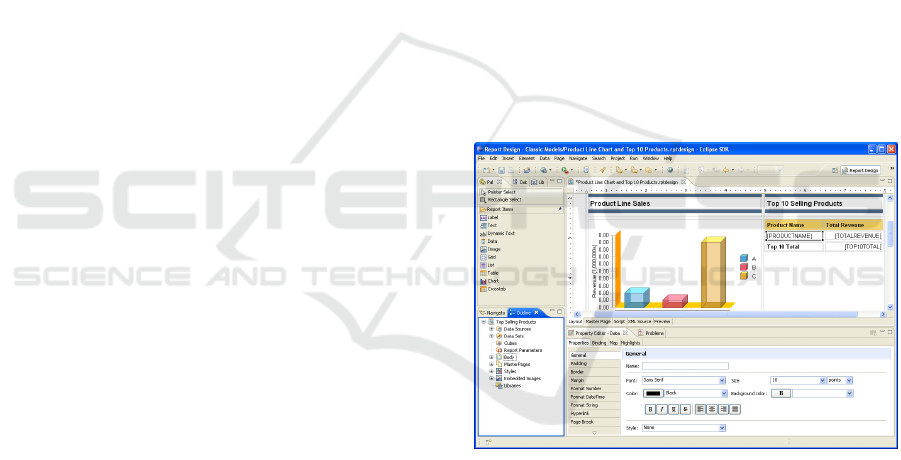
Figure 1 shows an example of data visible in
BIRT Report Designer.
Figure 1: Example of data visible in BIRT Report Designer.
BIRT is an open source software that provides the
BIRT technology platform to create data
visualizations and reports.
3.2 Jaspersoft
Jaspersoft is an open source business intelligence
platform developed in Java and Perl language.
Jaspersoft has two versions, the Enterprise version,
and the Community version.
The version of Jaspersoft BI Community consists
of six individual components: Jaspersoft iReport
Designer, Jaspersoft Studio, JasperReports Library,
JaspersoftReports Server, Jaspersoft OLAP, and
Jaspersoft ETL.
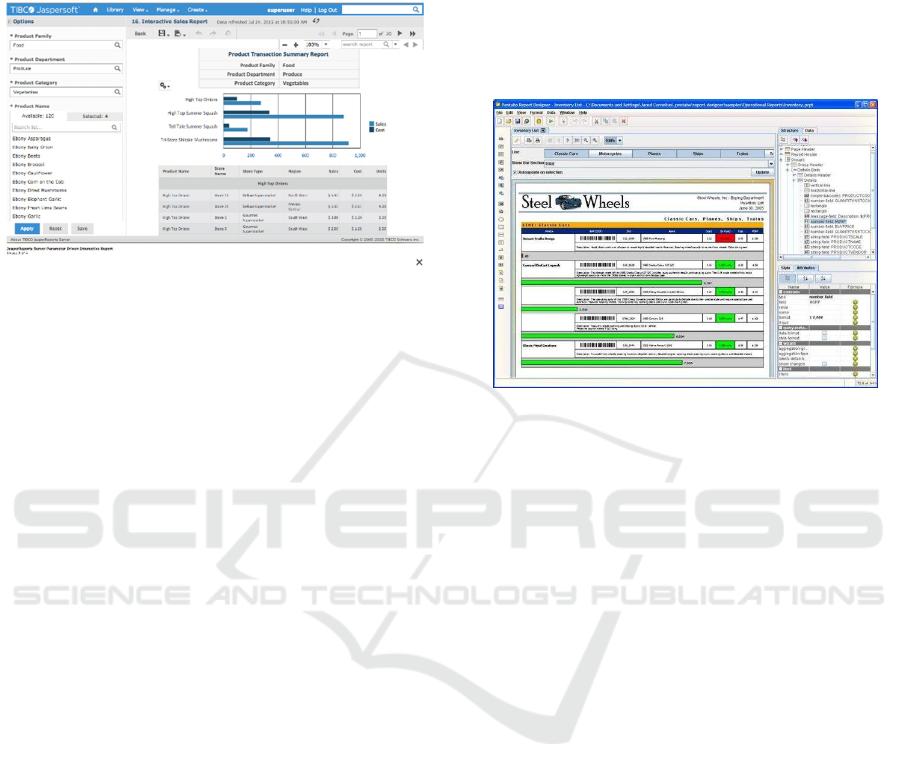
Figure 2 shows a report example provided by
JaspersoftReports Server.
Figure 2: Example of a report provided by
JaspersoftReports Server.
Jaspersoft is made of several components, that
allows creating reports and modify its design;
incorporated reports and analysis into a web page;
and components for performing ETL and OLAP.
3.3 Pentaho
Pentaho BI Suite software was developed by Pentaho
Corporation in 2001 and offers two types of licenses:
Community Edition and the Enterprise Edition.
The Pentaho BI Suite project comprises a set of
products: BI platform (server), reporting, OLAP
analysis, data integration (ETL), dashboards, and
Data Mining.
Pentaho is structured into different modules:
Pentaho BI Platform provides several services
to end users, such as subscriptions scheduling,
reporting, and integration tools, and
incorporated centralized security;
Pentaho Reporting allows the easy
development of a report, enabling
organizations to access, format, and distribute
information;
Pentaho Analysis provides an OLAP analysis,
supporting the users in the decision-making
process;
Pentaho Data Integration is a tool for ETL
process using an innovative, metadata-driven
approach;
Community Edition Dashboard provides a
graphical environment allowing users access to
critical information essential to the
understanding and optimization of
organizational performance;
Weka Pentaho Data Mining enables a
predictive analysis, providing information
about hidden patterns and relationships
between data, as well as performance indicators
(Brandão et al., 2016).
Figure 3 shows an example of a report provided
by Pentaho Report Designer.
Figure 3: Example of a report provided by Pentaho Report
Designer.
Pentaho is an open source software able to create
reports and dashboards, and it has components to
accomplish OLAP, ETL and Data Mining.
3.4 SpagoBI
The SpagoBI tool is a full open-source software, and
there is only a single version, a completely free
version.
It is a tool developed by SpagoWorld and
supported by an open source community and consists
of several modules:
SpagoBI server corresponds to the main
module and offers all the core and analytical
capabilities of the application;
SpagoBI studio allows the user to design and
modify all the analysis documents such as
reports, OLAP, dashboards, and Data Mining.
The interaction between this module and the
SpagoBI server is possible due to the SpagoBI
SDK module;
SpagoBI Meta is a module oriented towards the
management of metadata and search. Allowing
the user to edit and import from external tools
such as ETL and enriches the knowledge base
of metadata from SpagoBI server, so that they
can be easily queried through available tools,
such as OLAP;
SpagoBI SDK is the specific tool used to
integrate services provided by the server. This
module allows the integration of documents
and the publishing of documents SpagoBI on
an external portal;
SpagoBI Applications is a collection of
analytical models developed using SpagoBI
(Brandão et al., 2016).
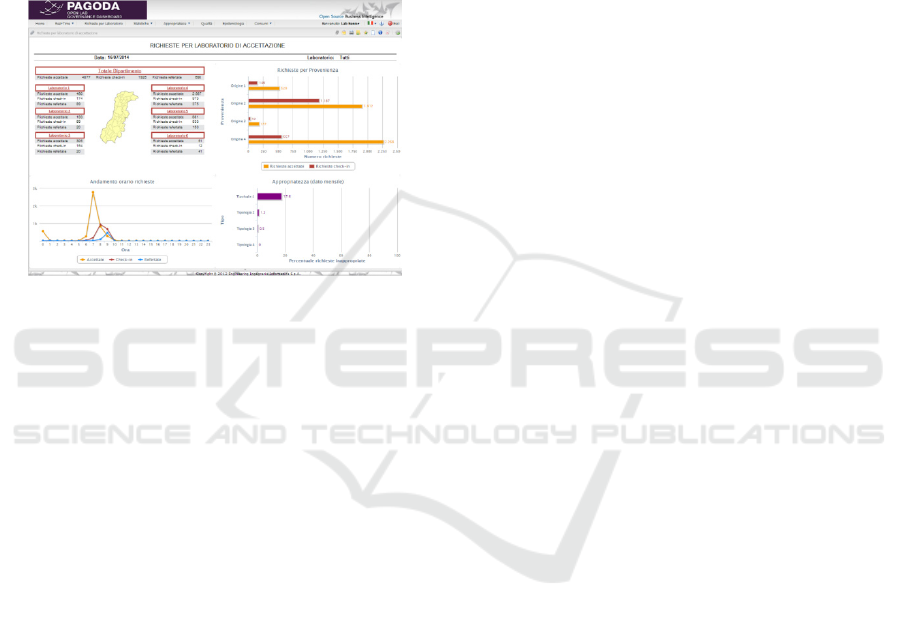
In Figure 4 is presented an example of a
dashboard created on SpagoBI.
Figure 4: SpagoBI tool dashboard.
SpagoBI is an open source software and has
several modules that allow creating reports and
dashboards, components to perform ETL, OLAP and
Data Mining.
4 OSSpal METHODOLOGY
The OSSpal project wants to help companies,
government agencies, and other organizations find
high quality Free and Open Source Software (FOSS)
to match their needs. OSSpal is a successor of the
Business Readiness Rating (BRR) methodology,
combining quantitative and qualitative evaluation
measures for software in various categories
(Wasserman et al., 2017).
The OSSpal methodology was selected for this
evaluation because it is the successor of the
OpenBRR methodology, classified in (Deprez and
Alexandre, 2008) as one of the best methodologies to
assess open source software.
The OSSpal methodology is composed of seven
categories:
Functionality:
How well will the software
meet the average user’s requirements?
Operational Software Characteristics: How
secure is the software? How well does the
software perform? How well does the software
scale to a large environment? How good is the
User Interface (UI)? How easy to use is the
software for end-users? How easy is the
software to install, configure, deploy, and
maintain?
Support and Service: How well is the
software component supported? Is there
commercial and/or community support? Are
there people and organizations that can provide
training and consulting services?
Documentation: Is there adequate tutorial and
reference documentation for the software?
Software Technology Attributes: How well
is the software architected? How modular,
portable, flexible, extensible, open, and easy to
integrate is it? Are the design, the code, and the
tests of high quality? How complete and error-
free are they?
Community and Adoption: How well is the
component adopted by community, market,
and industry? How active and lively is the
community for the software?
Development Process: What is the level of the
professionalism of the development process
and of the project organization as a whole?
This methodology is composed of four phases:
1. First phase: it is necessary to identify a
software component list to be analyzed,
measure each component in relation to the
evaluation criteria and removing from the
analysis any software component that does not
satisfy the use requirements;
2. Second phase: it should be attributed weights
for the categories and for the measures:
i. Assign a percentage of importance to each
category, totaling 100%;
ii. For each measure within a category, it is
necessary ranking the measure in
accordance to its importance;
iii. To each measure within a category assign
the importance by percentage, totaling all
the measures 100% of the category.
3. Third phase: gather data for each measure used
in each category and calculate its weighting in
a range between 1 to 5 (1 - Unacceptable, 2 -
Poor, 3 - Acceptable, 4 - Very Good, 5 -
Excellent);
4. Fourth phase: the qualification of the category
and the weighting factors should be used to
calculate the OSSpal final score.
The category ‘Functionality’ is calculated
differently from the others. In this category is

intended to analyze and evaluate the characteristics
which the tools have or should have. The method to
assess this category is as follows:
A. Set down the characteristics to analyze,
scoring them from 1 to 3 (less important to
very important);
B. Classify the characteristics in a cumulative
sum (from 1 to 3);
C. Standardize the prior result to a scale from 1
to 5.
Therefore, the Functionality category will have
the following scale:
Under 65%, Score = 1 (Unacceptable)
65% - 80%, Score = 2 (Poor)
80% - 90%, Score = 3 (Acceptable)
90% - 96%, Score = 4 (Good)
Over 96%, Score = 5 (Excellent).
5 EVALUATION
Primarily to evaluate the open source Business
Intelligence tools it is necessary to assign weights to
categories in order of importance. Based on the
authors (Marinheiro and Bernardino, 2013) and
according to the characteristics that we considered
most important in the open source tools, we selected
the weights for the different categories.
Table 1 shows the weights assigned to each
category.
Table 1: Weight assigned to each category.
Category Weight
Functionality 30%
Operational Software
Characteristics
20%
Software Technology
Attributes
15%
Support and Service 10%
Documentation 10%
Community and Adoption 10%
Development Process 5%
To evaluate a tool, the most relevant
characteristics are the functionalities that it has. Due
to this, the category ‘Functionality’ is the most
important and thus it was given the greatest weight
(30%).
In the second position, the category 'Operational
Software Characteristics' appears with 20%. This
category includes quality related areas such as
reliability, performance, scalability, usability, setup,
and security: these areas are very important to
evaluate a tool.
‘Software Technology Attributes’ is the following
category and the one that measures if the project is
designed to be extensible by third parties, the quality
of project usage and measures how fast bugs are
fixed.
The categories 'Support and Service',
‘Documentation’ and ‘Community and Adoption’ are
assigned with 10% because a good tool has a good
documentation to help in installation, configuration
and maintenance processes. ‘Support’ and
‘Community’ are essential to help users with
problems and to get feedback from people who are
using the software. The existence of books is also
helpful to use these tools and general discussion lists
are also key to sharing hesitations.
‘Community and Adoption’ and 'Development
Process' were considered less relevant in this
evaluation.
Next step is defining and evaluating important
characteristics for Business Intelligence tools to
analyze ‘Functionality’ category. The features chosen
to evaluate the tools were based on the 2017 Magic
Quadrant for Business Intelligence and Analytics
Platforms published by Gartner (Sallam et al., 2017).
Only characteristics that fit in open source tools
were selected in this phase. A relevance score was
assigned to each one (1 - slightly important to 3 - very
important).
Table 2 shows the weights assigned to each
category, according to what we consider to be most
important in a business intelligence tool.
Table 2: Weights for the characteristics of the functionality
category.
Characteristics Weight
ETL 3
OLAP 3
Dashboards 3
Reporting 3
Scorecards 3
Interactive analysis 2
Ad-hoc queries 2
Collaboration 2
Mobile BI 1
Data mining 1
After weights’ attribution to all categories, each
tool evaluation is performed to assess which is the
tool that gets the highest score.
The results of the evaluation are presented in
Table 3.

Table 3: OSSpal final score.
Category
Score
Jaspersoft Pentaho SpagoBI BIRT
Functionality 0.9 1.5 1.5 0.3
Operational
software
characteristics
0.9 0.82 0.7 0.84
Software
technology
attributes
0.51 0.46 0.36 0.48
Support and
service
0.04 0.04 0.01 0.01
Documentation 0.05 0.05 0.05 0.04
Community and
adoption
0.35 0.45 0.15 0.25
Development
process
0.15 0.15 0.15 0.15
TOTAL 2.9 3.47 2.92 2.07
With a score of 3.47 (evaluation from 1 to 5)
Pentaho was the tool that obtained the highest score
with the application of the OSSpal methodology.
Next, the SpagoBI and Jaspersoft tools occupy the
second and third place, respectively, with only 0.02
points difference. These tools are very complete and
have proven to have a lot of potential as open source
BI tools.
The BIRT presented the lowest score since it is a
tool more focused on reports and does not possess
much of the characteristics detailed in Table 2.
6 CONCLUSIONS AND FUTURE
WORK
In this paper, we analyzed the latest versions of the
best open source BI tools available in the market. The
information for the evaluation was collected on the
websites of the respective tools, in technical
documentation and through the usability of the tools.
The application of the OSSpal methodology
allowed to obtain a more precise assessment,
assigning a numeric value to each category tool,
allowing the accomplishment of comparisons.
After applying the OSSpal methodology it is
possible to conclude that the tool with the best score
was Pentaho.
SpagoBI and Jaspersoft obtained very close
scores, indicating that they are similar tools with a lot
of potentials.
BIRT presented a lower score since it is a tool more
focused on reports than other important
characteristics in Business Intelligence tools.
As future work, we intend to apply a greater number of
measures for each category and extend this study by
including a higher number of open source tools.
REFERENCES
Brandão, A. et al. (2016) ‘A Benchmarking analysis of
Open-Source Business Intelligence Tools to Healthcare
Environment’, Algoritmi Research Center, University
of Minho, Braga, Portugal, pp. 1–16. doi:
10.3390/info7040057.
Completo, J. et al. (2012) ‘Design and Implementation of a
Data Warehouse for Benchmarking in Clinical
Rehabilitation’, Procedia Technology, 5, pp. 885–894.
doi: 10.1016/j.protcy.2012.09.098.
Deprez, J. C. and Alexandre, S. (2008) ‘Comparing
Assessment Methodologies for Free/Open Source
Software: OpenBRR and QSOS’, Lecture Notes in
Computer Science, 5089 LNCS, pp. 189–203.
Hayhow, M. (2017) Top Five Open Source Business
Intelligence Tools. Available at: http://www.software
advisoryservice.com/software-solutions/bi-business-
intelligence/top-five-open-source-business-
intelligence-tools/ (Accessed: 23 June 2017).
Lapa, J., Bernardino, J., Figueiredo A., (2015) ‘A
comparative analysis of open source business
intelligence platforms’, Int. Conference on Information
Systems and Design of Communication, ISDOC 2014,
pp. 86–92.
Marinheiro, A. and Bernardino, J. (2013) ‘OpenBRR
evaluation of an open source BI suite’, Proceedings of
the Int. C* Conference on Computer Science and
Software Engineering - C3S2E. doi: 10.1145/249444
4.2494463.
Marinheiro, A. and Bernardino, J. (2015) ‘Experimental
Evaluation of Open Source Business Intelligence Suites
using OpenBRR’, IEEE Latin America Transactions,
13(3), pp. 810–817.
Petrinja, E., Sillitti, A. and Succi, G. (2010) ‘Comparing
OpenBRR, QSOS and OMM Assessment Models’,
IFIP International Federation for Information
Processing, pp. 224–238.
Ranjan, J. (2009) ‘Business Intelligence: Concepts,
Components, Techniques and Benefits’, Journal of
Theoretical and Applied Information Technology, 9, p.
60. doi: 10.2139/ssrn.2150581.
Sallam, R. L. et al. (2017) ‘Magic Quadrant for Business
Intelligence and Analytics Platforms’, Gartner, pp. 1–
126.
Tereso, M., Bernardino J., (2011) ‘Open source business
intelligence tools for SMEs’, Proceedings of the 6th
Iberian Conference on Information Systems and
Technologies, CISTI 2011.
Wasserman, A. I. et al. (2017) ‘OSSpal: Finding and
Evaluating Open Source Software’, in Balaguer, F. et
al. (eds). Springer International Publishing, pp. 193–
203.
