
Linking Knowledge Creating Capabilities, IT Business Value and
Digital Business Value: An Exploratory Study in Japanese SMEs
Christian Riera
1
and Junichi Iijima
2
1
Department of Industrial Engineering and Management, Tokyo Institute of Technology,
Ookayama 2-12-1-W9-66, Meguro, Tokyo, Japan
2
Department of Industrial Engineering and Economics, Tokyo Institute of Technology,
Ookayama 2-12-1-W9-66, Meguro, Tokyo, Japan
Keywords: Knowledge Creating Capabilities, Balanced SECI, Digital Business Value, IT Business Value.
Abstract: Aiming to address the increasing focus on digital technologies and the continuous concern of Knowledge
Management (KM) performance, this study explores the relationship between 'Knowledge Creating
Capabilities', 'IT business value' and 'Digital business value'. The latter two concepts are re-defined as the
achievement of business objectives by the use of IT or digital technologies in a balanced scorecard approach.
The concepts of 'Knowledge Creating Capabilities' and 'Balanced SECI' are leveraged. Balanced SECI
(Riera, Senoo and Iijima, 2009) refers to the balance of the four knowledge creation processes from Nonaka
and Takeuchi’s SECI model (1995). This framework is applied to Japanese small and medium enterprises.
A positive relationship between the achievement of business objectives by IT and the achievement using
digital technologies was verified. On the other hand, although a relationship of 'Balanced SECI' with 'IT
Business Value' or 'Digital Business Value' was not statistically significant; the observations showed that
higher levels of 'Balanced SECI' were negatively related to the achievement of Financial, Customer and
Business Processes types of business objectives and; positively related to Learning & Growth. Analysis
from each SECI process confirmed such behaviour.
1 INTRODUCTION
The increasing focus on Digitalization and digital
technologies, and in particular on how to gain a
competitive advantage is currently being actively
explored (Ross et al., 2016). These efforts aim to
facilitate the companies’ journeys onto Digital
Transformation. As mentioned by Ross et al. (2016),
digital technologies like the ones in SMACIT (social,
mobile, analytics, cloud and Internet of Things) are
currently available in the marketplace. Therefore
replication of the use of such technologies may not
sustain competitive advantage (Carr cited in Ross et
al.; Piccoli et al. cited in Ross et al., 2016). Also the
same study identified key elements that the
established players use to leverage the digital
technologies and integrate with the firm’s
capabilities and components such as digital strategy,
operational backbone and digital services backbone
become the key to successfully leverage the
opportunities of digital technologies (Ross et al.,
2016). This study also considers digital technologies
as part of the Digital Transformation but the real
transformation relies on the interaction with the
capabilities that already exist in the firm.
As classified by Chen and Chen (2006), in the
early years the evaluation of KM was approached
from perspectives like: qualitative, quantitative,
internal/external performance, and project/
organizational-oriented; while recently the research
mainly used the quantitative approach.
The Knowledge-based view considers
knowledge as a strategic asset of firms (Grant, 1996)
and one of the motivations for a firm to manage
knowledge is the business performance
improvement (Choi and Lee, 2003). Almost all the
different definitions of the KM processes
acknowledge some form of Knowledge Creation
(Benbya, Passiante and Belbaly, 2004; Chen and
Chen, 2006; Davenport and Prusak, 2000).
The Knowledge creation process is also
recognized as one of the most important strategic
assets of the firm (Dierickx and Cool, 1989;
Leonard-Barton, 1992; Conner and Prahalad, 1996;
Riera C. and Iijima J.
Linking Knowledge Creating Capabilities, IT Business Value and Digital Business Value: An Exploratory Study in Japanese SMEs.
DOI: 10.5220/0006487900290040
In Proceedings of the 9th International Joint Conference on Knowledge Discovery, Knowledge Engineering and Knowledge Management (KMIS 2017), pages 29-40
ISBN: 978-989-758-273-8
Copyright
c
2017 by SCITEPRESS – Science and Technology Publications, Lda. All rights reserved

Grant, 1996 cited in Lewin and Massini, 2004).
This study follows the same research path and is
aligned with other studies which are focused on the
Knowledge Creation Process (Choi and Lee, 2002;
Chou, 2005).
In terms of Knowledge Creation theory, Nonaka
and Takeuchi (1995) acknowledged tacit and
explicit knowledge types and their interaction and
transformation as key components of their
knowledge creation process under the name of
‘SECI Model’.
This study leverages the concept of 'Balanced
SECI' as a measurement of 'Knowledge Creating
Capabilities' (Riera, Senoo and Iijima, 2009). The
concept considers that a bottleneck in the knowledge
creation process may appear if a firm is over-
focused or has a lack-of focus on a particular SECI
process. It also identified a positive relationship
between Balanced SECI level and financial
performance.
Finally, there is extensive research that addresses
the concern of the IT effect on firm performance.
This concern officially started when the term IT
Productivity Paradox was coined in 1987 at the time
the economist Robert Solow mentioned that the
computer age could be seen everywhere except in
the productivity statistics (Brynjolfsson and Hitt,
1998). Together with the development of IT,
researchers have also changed their approach to this
phenomenon. Initially the analysis considered the IT
investment first independently in the form of IT
assets, Weill and Aral defined IT assets into
categories and found specific relationship between
certain types of assets with specific benefits (Weill
and Aral, 2007). Later on new theories emerged and
examined the business processes associated with the
IT utilization (Sandulli et al., 2007).
Subsequently, the research focused on organiza-
tional characteristics. Overall the results have not
been conclusive. Only some found a positive
relationship between IT and firm performance.
This study is aligned with other studies focusing
on the critical capabilities of the firms in the search
to unveil how IT enhances firm performance (Weill
and Aral, 2007; Brynjolfsson and Hitt, 1998).
Since the business value from IT has been
extensively analyzed, with the availability of digital
technologies it can be foreseen that similar concerns
will arise in the near future.
Acknowledging the individuality of each firm to
define and pursue its own goals; this study uses a
well known classification of business objectives
defined by the Balanced Scorecard (Kaplan and
Norton, 1996). It uses these to inquire the firms in
which type of business objectives the IT and digital
technologies were put into practice; while it inquires
also about the contribution obtained from IT and
digital technologies. This is not the first time that the
Balanced Scorecard concept has been linked with
KM (Cabrita, Machado and Grilo, 2010), however
no studies have tested the Balanced SECI concept
against the achievement of business goals.
In a nutshell, this study contributes to the
literature of KM performance measurement by using
Balanced SECI and considering that each firm
pursues its own objectives, while at the same time
inquiring on the level of achievement by the use of
IT and digital technologies, -defined as IT and
Digital Business Value.
The rest of the paper is organized as follows.
Section 2 presents the theoretical background.
Section 3 explains the framework and hypotheses.
Section 4 describes the data and metrics. The
analysis and findings are included on Section 5. A
discussion is included on Section 6, while the
conclusions are addressed in Section 7.
2 THEORETICAL
BACKGROUND
2.1 Knowledge Creating Capabilities
Over the years academia and scholars have studied
and developed several concepts with the aim to
explain how competitive advantage can be achieved
and sustained. It starts with the resource-based view
that considers that the organization is a collection of
resources (Amit and Shoemaker, 1993) and suggests
that competitive advantage can be achieved when an
organization is able to develop difficult-to-imitate
resources (Barney, 1986).
Later on, recognizing the dynamic nature of the
market and its changes over time, the concept of
Dynamic Capabilities was developed. This concept
states the need that the firm’s resources need to
change over a period of time to keep them relevant
(Teece and Pisano, 1997). Researchers (Grant, 1996)
explain that dynamic capabilities are the foundation
that makes managers acquire and combine resources
in order to generate value-creating strategies. To
make the difference clear between Resources and
Capabilities the academia (Amit and Schoemaker,
1993) defined that resources are converted into final
products or services, while capabilities enable a firm
to deploy resources, using organizational processes
to achieve a desired end.

The knowledge-based view considers the
knowledge as the most important resource for a firm.
Within the phases of KM, the knowledge creation
and integration phases were considered the most
important assets of the firm from a strategical point
of view (Lewin and Massini, 2004).
A very important work in the area of knowledge
was done by Nonaka and Takeuchi (1995). They
introduced the SECI Model as a model of
knowledge creation process to understand the
dynamic nature of knowledge creation, and to
manage such a process effectively. They suggested
that the most important aspect of understanding a
firm’s capabilities in terms of knowledge is the
dynamic capability to continuously create new
knowledge out of existing firm-specific capabilities,
rather than the stock of knowledge that a firm
possesses at one point in time (Nonaka, Toyama and
Takeuchi, 2000).
The concept of Balanced SECI (Riera, Senoo and
Iijima, 2009) was developed as a measure of
Knowledge Creating Capabilities (KCC) and
considers that there could be bottlenecks in the
process of knowledge creation when a firm is either
over-focused or has a lack-of focus in one of the
four processes of the SECI Model. Previously
Balanced SECI score has been linked with two
specific financial measures (Riera, Senoo and Iijima,
2009). This study also aims to expand the literature
on Balanced SECI by determining if there is a
relationship with the overall firm objective
achievement accomplished by the use of IT or
digital technologies in the categories provided by the
Balanced Scorecard.
2.2 Business Value from IT
Decades of studies have been dedicated to exploring
the effects of IT on firm performance. This
phenomenon is known as the “IT Productivity
Paradox”. Earlier studies found inconclusive results,
however as the research developed and started to
consider other firm characteristics as complements
to IT the results were more optimistic. Table 1 is
adapted from an existing study (Dedrick, Gurbaxani
and Kraemer, 2003) and shows major researches on
the topic. This research is consistent with studies
considering that the IT impact on firm performance
requires an analysis performed together with firm
capabilities such as the ones on the bottom section of
Table 1.
IT Business Value has become a term which
usually refers to the same concept as the IT
Productivity Paradox but with a more positive
perception in particular on the industry side. In this
study the definition of IT Business Value came from
the application of a concept found in the literature
relevant to IT maturity where IT Business Value is
defined as the contribution that IT resources and
capabilities make to help an organization achieve its
objectives (Curley, 2004 cited in Innovation Value
Institute, 2016).
Table 1: Key studies exploring IT, firm performance and
other firm capabilities (adapted from Dedrick, Gurbaxani
and Kraemer, 2003).
Study
Findings
Relationship among IT and firm performance
Mahmood M.A. et al. (1993), Weill
(1992), Wilson (1993), Loveman
(1994)
None or
Negative
Weill (1992), Wilson (1993), Loveman
(1994), Brynjolfsson and Hitt (1995),
Brynjolfsson and Hitt (1996), Hitt and
Brynjolfsson (1996), Brynjolfsson et
al.(1998), Greenan et al. (2001)
Positive
IT, firm performance and other firm capabilities
Bresnahan et al. (2002),
Brynjolfsson et al. (1998), Ramirez
et al.(2001), Francalanci and Galal
(1998), Devaraj and Kohli
(2002),Tallon et al. (2000), Weill et
al. (2004, 2005)
Positive
2.3 Business Value from Digital
Technologies
The development and availability of digital
technologies like social, mobile, analytics, cloud and
Internet of Things bring opportunities as well as
threats for established companies (Ross et al., 2016).
The definition of Digital Business Value is
derived in a similar way than the definition of IT
Business value and it is described as the contribution
that digital technologies make to help an
organization achieve its objectives.
3 FRAMEWORK AND
HYPOTHESES
This study explores the relationship between
Knowledge Creating Capabilities on one side, and
the business value of IT and digital technologies
measured as the level of achievement of 4 types of
business objectives on the other side. The model is
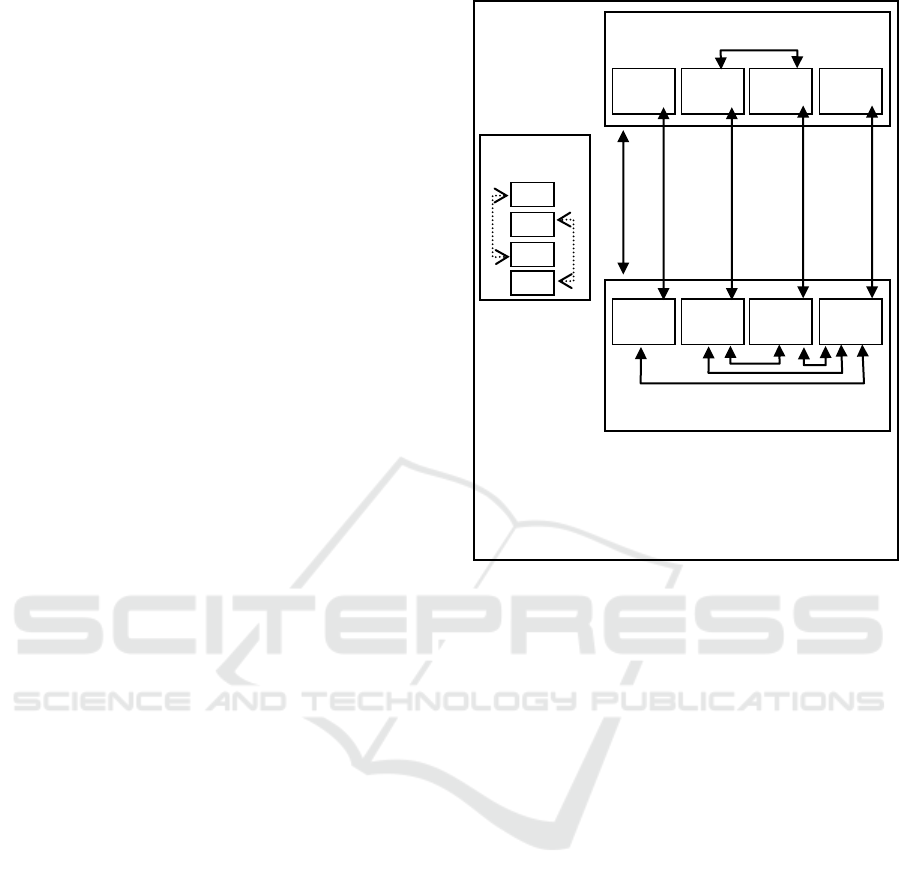
described in Figure 1.
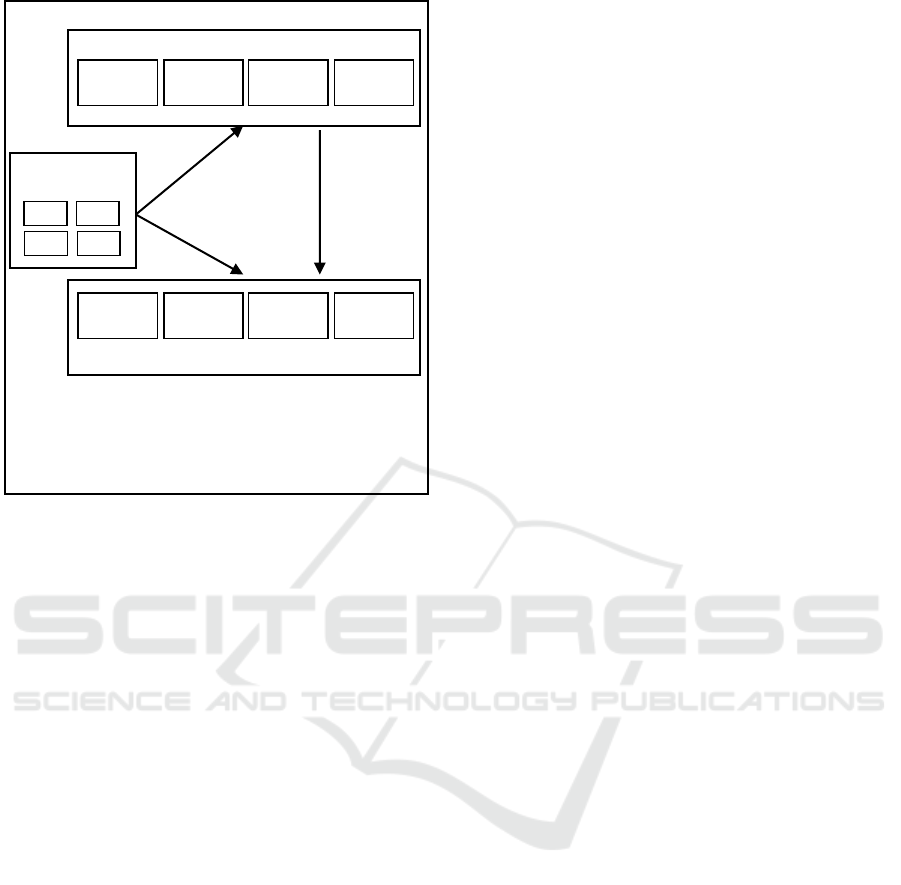
Figure 1: Main Framework and Hypotheses.
The main hypothesis in this study is defined as:
“Knowledge Creating Capabilities, IT Business and
Digital Business Value are positively related”. The
detailed hypotheses are:
- H1: Knowledge Creating Capabilities are
present in firms that achieve business value
from IT (IT Business Value).
- H2: Knowledge Creating Capabilities are
present in firms that achieve business value
from digital Technologies (Digital Business
Value).
- H3: the firms’ objectives achieved by using
digital technologies (Digital Business Value)
are supported by the level of achievement in IT
(IT Business Value).
4 DATA AND MEASURES
An empirical analysis is used in order to validate
these three hypotheses. This is aligned with studies
that evaluated KM based on firm performance (Choi
and Lee, 2002) as well as with the literature on IT
and firm performance (Weill, 1992; Weill and Aral,
2007).
4.1 Target Population
This study focuses on Japanese SMEs that have been
selected by the Japanese Ministry of Economy,
Trade and Industry (METI, 2016a) in the list of
“Competitive IT Strategy SME Selection 100” from
2015 and 2016. The companies corresponding to the
year 2017 were not published at the time this study
was closed. The companies in this list are selected
due to their record of effective utilization of IT and
demonstrated good business performance.
This particular group of companies were selected
as the target population since this study aims to
clarify the relationship between Knowledge Creating
Capabilities, IT Business Value and Digital Business
Value. The characteristic of business achievement
by the use of IT is already verified by METI and
therefore, it makes these companies worth analyzing
in order to validate the hypotheses. Furthermore,
earlier studies have leveraged similar groups as
target population (Hirano, 2005; Riera, Senoo and
Iijima, 2009).
Nevertheless, it is important to justify the focus
on Small and Medium Enterprises (SME) that this
study addressed and the particular characteristics
and context of SMEs. The relevance of SMEs in the
Japanese economy is reported by the Ministry of
Economy, Trade and Industry. They account for
99.7% of all enterprises and approximately 55% of
gross value-add across the Japanese economy (Small
and Medium Enterprise Agency, 2016). Due to their
importance there is a need for SMEs to understand
how to use IT and digital technologies in order to
remain competitive.
The industry composition of the 60 companies in
the target population is as follows: 25.0%
Manufacturing, 11.7% Retail, 10.0% Services, 8.3%
Wholesale, 6.7% Information & Communication,
6.7% Construction, 5.0% Printing, 5.0% Other, 3.3%
Transportation, and with 1.7%: Wholesale and retail
trade, Other (nursing care), Accommodation, Retail /
Nursing care, Gravel sampling, Other (dental),
Agriculture, Food & Beverage, Real Estate,
Information service and Manufacturing and
Agriculture.
4.2 Measuring Knowledge Creating
Capabilities (KCC)
Consistent with similar studies that explored
Knowledge Creating Capabilities as Organizational
Characteristics in an SME context (Riera, Senoo and
Iijima, 2009), ‘Balanced SECI’, was used to
measure Knowledge Creating Capabilities (KCC).
This was captured with a questionnaire that listed six
items or behaviours related to each of the four SECI
Model processes. Firms were requested to select 12
out of 24 behaviours that most reflected their
Balanced
SECI
IT Business Value
FI-OA
- FI-OA: Financial-related objectives achievement.
- CU-OA: Customer-related objectives achievement
- BP-OA: Business Process-related objectives achievement
- LG-OA: Learning and Growth objectives achievement
CU-OA
BP-OA
LG-OA
Digital Business Value
FI-OA
CU-OA
BP-OA
LG-OA
S
E
C
I
H1 (+)
H2 (+)
H3 (+)

employees’ behaviours. The content came from
literature review (Nonaka et al., 1994; Nonaka and
Takeuchi, 1995; Nonaka, Toyama and Takeuchi,
2000). Balanced SECI as defined in Riera et al.
(2009) uses the results from the questionnaire to
calculate the scores in each of the SECI processes.
Afterwards, the firm’s Balanced SECI score is
calculated as the minimum score achieved in any of
the four processes. This concept tries to avoid
bottlenecks in the knowledge creating process and
represents the maximum level in which all the 4
SECI processes together can support the spiral of
knowledge creation and convert individual
knowledge into organizational knowledge which is
shared and internalized by the employees. The
Balanced SECI score is represented in Figure 2. A
sample of the SECI survey is available in Riera et al.
(2009). Using the questionnaire the highest Balanced
SECI score of a firm could be from a firm that
selected 4 items in each of the SECI process.
Figure 2: Balanced SECI score (sample).
4.3 Measuring IT Business Value and
Digital Business Value
This study defines IT Business Value as the
contribution that IT provides towards the
achievement of the firms’ objectives. This study
requested the firms to consider the IT Investment
over the last 3 years and classify it over four types of
objectives: Financial (expanding revenue, improving
productivity, improving the financial structure, etc.),
Customer-related (improving customer satisfaction,
improving customer loyalty, increasing sales to new
customers, etc.), Business Process (quality
improvement, productivity improvement, etc.),
Learning and growth (securing human resources,
human resources education, creativity, development
capability, etc.) .
The 3-years consideration was done in order to
minimize the impact of lagged results from IT
investment as well as to consider that companies can
pursue different objective types according to their
strategy. For instance a more customer-driven
company could invest in IT in order to increase
customer experience, while another could invest
focusing on fostering learning and growth to develop
new services and products. Once the IT investment
was classified into business objective types, then the
measurement of achievement used a scale with 4
levels: Not achieved (0-15%), partially achieved
(16-50%), highly achieved (51-85%) and fully
achieved (86-100%).
Following a similar approach, Digital Business
Value is defined as the contribution that digital
technologies provide towards the achievement of a
company’s objectives. From the data collected
during the IT inquiry, the participants were asked to
specify in which type of business objectives the
digital technologies were used and, the level of
objective achievement they experienced for the four
types of business objectives, using the same 4-level
achievement scale.
A list of digital technologies with definitions was
included in the questionnaire in order get responses
aligned with respect to what a specific technology
referred.
The responders were asked to consider these
digital technologies: Mobile, Cloud technology, SNS
(Social Networking Service), Big Data and
Analytics, IoT (Internet of Things), Artificial
Intelligence and 3D printing technology.
4.4 Data Collection
The questionnaire was distributed to the 60
companies registered mailbox address and they were
requested to complete the questionnaire over a
period of 2weeks. During the 2 weeks period follow
up calls were done to increase the response rate.
Twenty out of the sixty companies filled-out the
survey, representing a high response rate of 33%.
Factors which most likely helped with this response
rate could be the customized cover letter introducing
the background of the study, the follow-up calls, as
well as executing and closing the survey one month
in advance of the busy period of fiscal year end.
However the nature of the group was definitely a
factor because the list was validated by METI but
initiated by each company thru self-nomination.
Finally a report with the summary of the initial
findings was sent to the responders. The industry
composition is presented on Table 2.
0
1
2
3
4
5
6
S
E
C
I
Sample of firm focused on Combination
and Internalization
Balanced SECI = Min(1,1,5,6) = 1
Firm score
Firm KCC score
(Balanced
SECI)

Table 2: Response Ratio by Industry.
Industry
Target
Received
Resp.
Ratio %
Manufacturing
15
7
47
Service
6
3
50
Wholesale
5
2
40
Construction
4
2
50
Printing
3
2
67
Transportation
2
1
50
Gravel sampling
1
1
100
Other (dental technician)
1
1
100
Food & Beverage
1
1
100
*Industries with no
responses not included
22
0
0
Total
60
20
33.3 %
4.5 Reliability of the Data
As with any survey study, the data is as reliable as
the reliability of the responders. This is the reason
that the questionnaire was addressed to the main
responsible in each company (e.g. CEO, Director).
As a result the answers were filled by both business
and IT, such as business managers, IT strategy
representatives and CEOs. Considering that this
study focuses on the business value or achievement
of business objectives it is reasonable to accept this
mix of responders minimizing any bias that the IT
personnel may have either on purpose or per lack of
knowledge.
4.6 Validity of the Data
The same instrument to measure Balanced SECI and
its validity has been discussed previously (Riera,
Senoo and Iijima, 2009).
In addition, studies are vulnerable to non-
response and coverage errors when considering
external validity. Non-response type of error
happens when the subjects under study are different
on a characteristic relevant to the study from the
subjects which didn’t participate. In order to verify
this in the current study, firm size (number of FTE
and number of Total employees), capital, active
years were used in tests. Also as mentioned below
statistically significant differences were not found
between the groups of responders versus non-
responders.
Coverage error occurs when the sample itself
does not fully represent the characteristics of the
population to which the results are to be generalized.
In the case of this study the results are not to be
generalized to all Japanese SMEs because of the
particular characteristic of the target population
which have shown effective utilization of IT enough
to be nominated and selected as part of the list of
“Competitive IT Strategy SME Selection 100” by
the Ministry of Economy, Trade and Industry
(METI) in Japan. Because of this reason the results
cannot be generalized. However they can be used as
a reference to understand how Knowledge creating
capabilities in such companies can support the
effective utilization of IT and digital technologies to
achieve business objectives.
5 ANALYSIS AND FINDINGS
5.1 Relationship between KCC and IT
Business Value (Firm’s Objective
Achievement by IT)
In order to assess this relationship, correlation
analysis was done and included both parametric
(Pearson) and non-parametric (Kendall's tau) tests.
The tests failed to identify a statistically
significant relationship between KCC and IT
business value.
Four measurements were used to explore KCC:
SECI aggregated score result as the sum of
results of each knowledge conversion process.
Balanced SECI as the minimum score of the 4
processes in the SECI model.
Balanced SECI based on the minimum score
using proportional scale of the number of
responses by each firm (i.e. some firms
selected less items than the 12 requested in the
questionnaire).
Individual score of the 4 processes in the
SECI model.
IT Business Value was measured as the level of
objective achievement. Two criteria were explored:
IT BV score (IT Business Value AVG)
IT BV for each of the 4 objectives categories
(financial, customer, business process,
learning and growth).
5.1.1 Differences in the IT Contribution
towards the Achievement of Business
Objectives According to Balanced
SECI Score
The firms were divided into 3 categories according
to their Balanced SECI score: Low, Medium and
High. Analysis of variance (ANOVA) was used in
order to verify if there were differences.
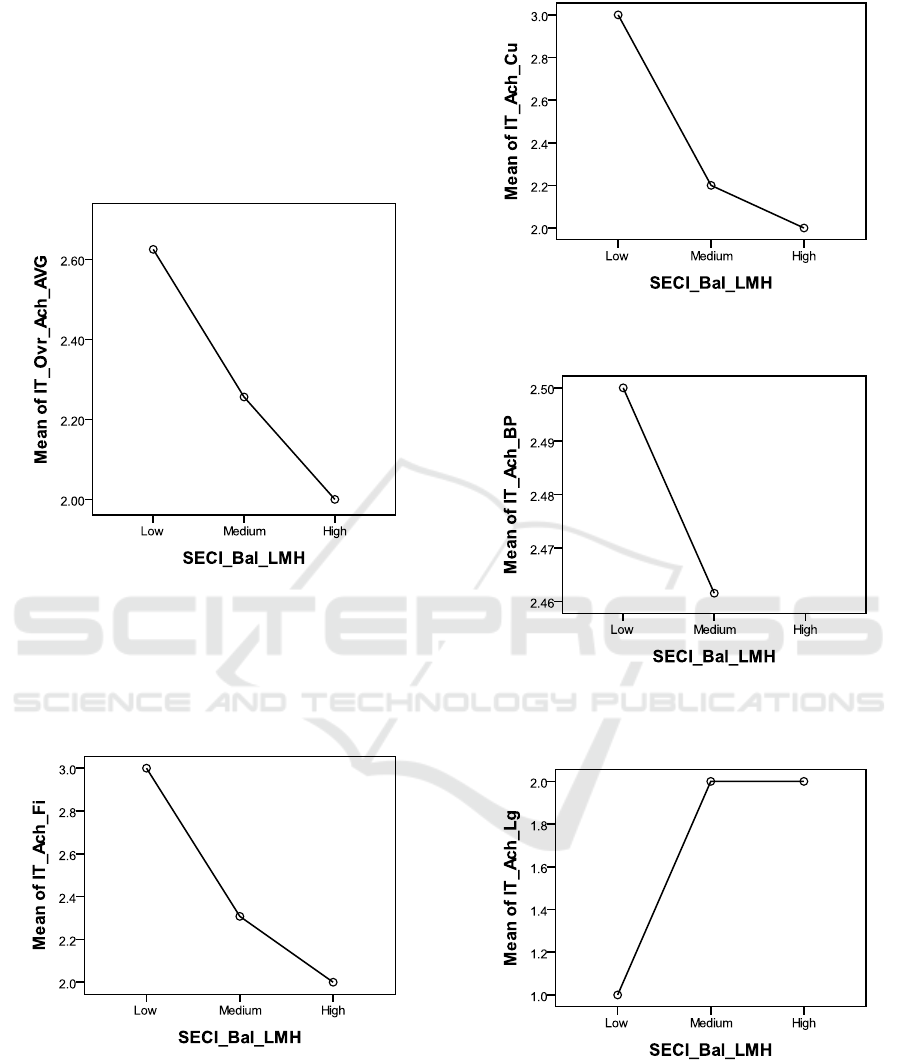
Although no statistical difference was found, a
small tendency could be observed where the level of
business objectives’ achievement decreased as the
level of Balanced SECI increased for Finance,
Customer, Business process objectives; but
increased for Learning and Growth objectives group.
This is observed in the overall achievement score.
Figure 3 shows the graph using the average score.
Figure 3: Differences of Achievement of Overall business
objectives (average score) by IT according to Balanced
SECI groups (Low, Medium and High).
Each type of business objectives is also explored,
trends can be observed in Figures 4, 5, 6, 7 for each
of the objective types.
Figure 4: Differences among Balanced SECI groups (Low,
Medium and High) - Achievement of Financial obj. by IT.
Figure 5: Differences among Balanced SECI groups (Low,
Medium and High) - Achievement of Customer obj. by IT.
Figure 6: Differences among Balanced SECI groups (Low,
Medium and High) - Achievement of Business Proc. obj.
by IT.
Figure 7: Differences among Balanced SECI groups (Low,
Medium and High) - Achievement of Learning and
Growth obj. by IT.
5.1.2 Differences in the KCC According to
the Level of Achievement of Business
Objective by IT
The firms were divided into 3 categories according
to their Level of Achievement of business
objectives: Low Achievers, Medium Achievers and
High Achievers. Analysis of variance (ANOVA)
was also tested in order to explore the differences.
There were no companies that fall into the
category of High Achievers (i.e. full achievement of
business objectives in all types) therefore these are
inconclusive results. No statistically significant
difference was identified between the Low and
Medium achievers.
5.2 Relationship between KCC and
Digital Business Value (Firm’s
Objective Achievement by Digital
Technologies)
With similar results, this study did not find a
statistically significant relationship between
Knowledge Creating Capabilities and Digital
Business Value.
The same four measurements were used to
explore Knowledge Creating Capabilities. Digital
Business Value was measured as the level of
objective achievement by the use of digital
technologies; similar criteria as in section 5.1 were
explored.
5.2.1 Differences in the Digital
Technologies’ Contribution towards
the Achievement of Business
Objectives According to Balanced
SECI Score
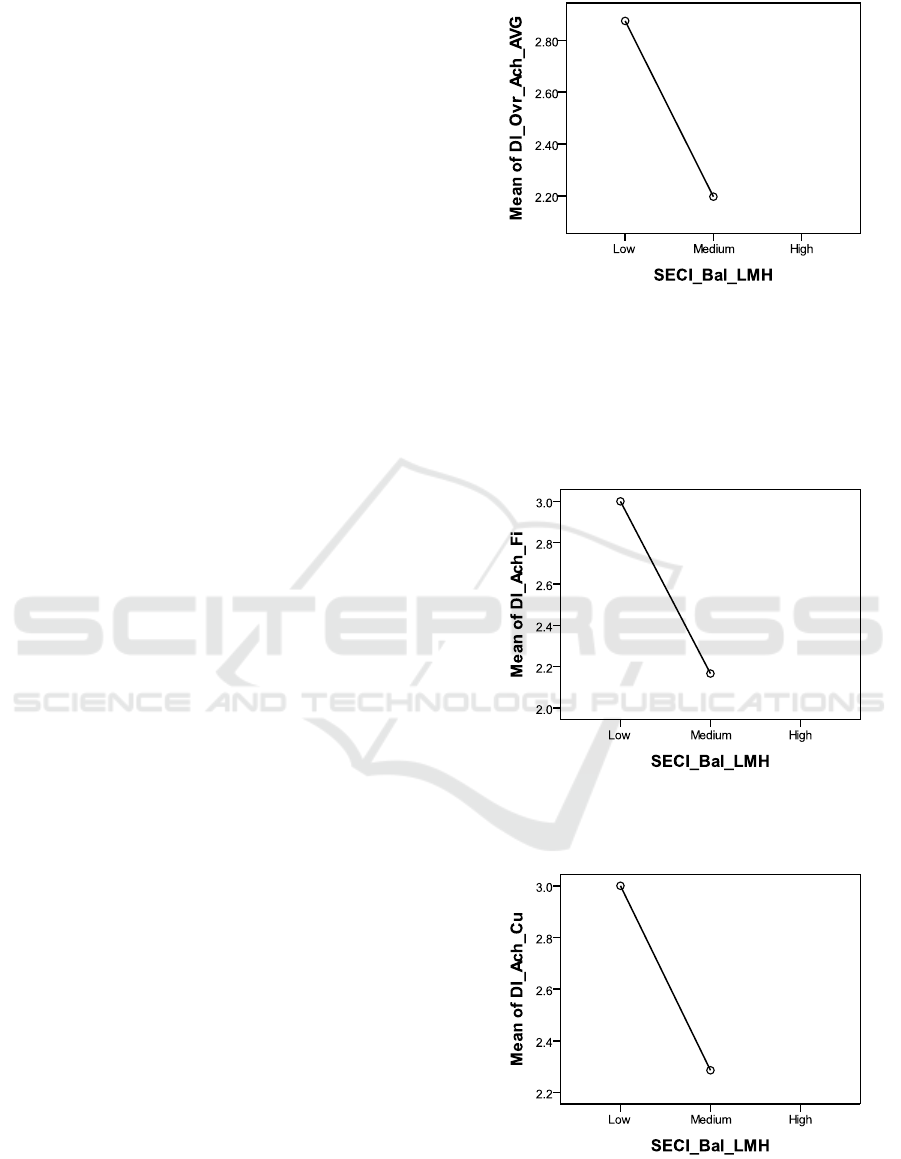
In the same way Knowledge Creating Capabilities
and IT were analyzed in section 5.1, the categories
of Low, Medium and High Balanced SECI score
served to explore the group differences.
With similar non-statistically significant results,
the level of business objectives achievement
decreased as the level of Balanced SECI increased
for Finance, Customer, Business process objectives.
In contrast, it increased for Learning and Growth
objective group. Figure 8 shows the results at an
overall level.
Figure 8: Differences of Achievement of Overall business
objectives (average score) by digital technologies
according to Balanced SECI groups (Low, Medium and
High).
The view by each business objective category
also shows a similar tendency and can be observed
in Figures 9, 10, 11, 12.
Figure 9: Differences among Balanced SECI groups (Low,
Medium and High) - Achievement of Financial obj. by
Digital Technologies.
Figure 10: Differences on Balanced SECI groups (Low,
Medium and High) - Achievement of Customer obj. by
Digital Technologies.
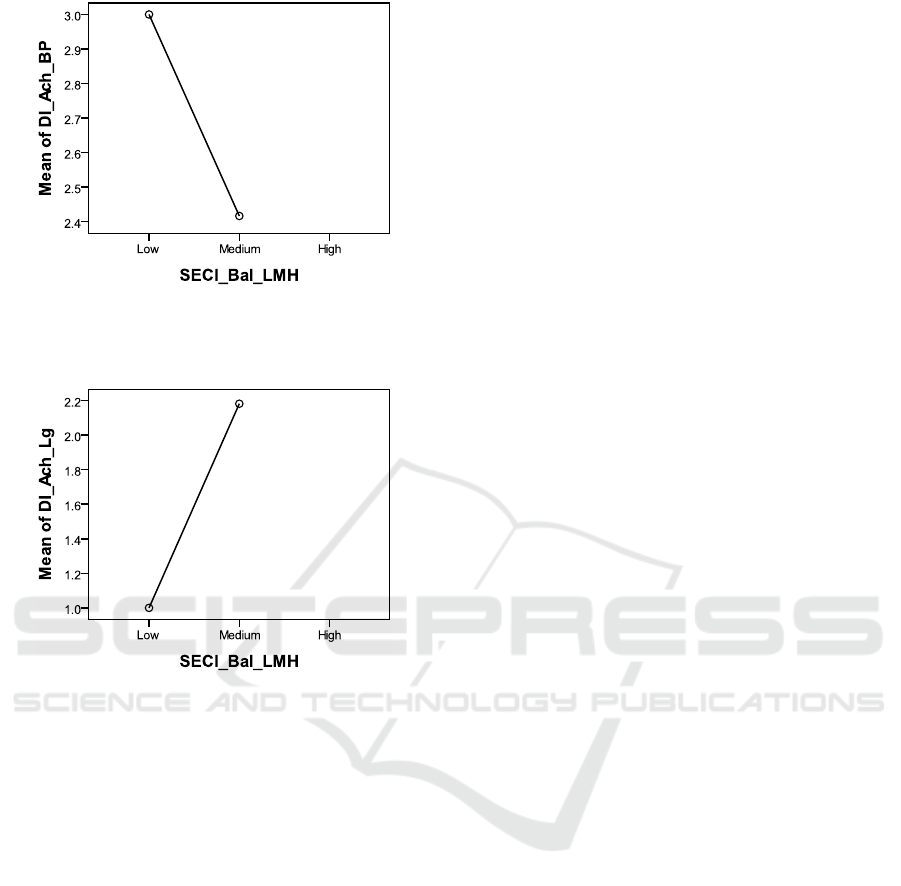
Figure 11: Differences among Balanced SECI groups
(Low, Medium and High) - Achievement of Business Proc.
obj. by Digital Technologies.
Figure 12: Differences among Balanced SECI groups
(Low, Medium and High) - Achievement of Learning and
Growth obj. by Digital Technologies.
5.2.2 Differences in the KCC According to
the Level of Achievement of Business
Objective by Digital Technologies
There were no companies that fall into the category
of High Achievers therefore these are considered
inconclusive results. No statistically significant
difference was identified between the Low and
Medium achievers.
5.3 Relationship between Firm
Objective Achievement by IT and
Digital Technologies
The relationship between IT Business Value and
Digital Business Value (measured as achievement
objective by the use or contribution of IT in the first
case and digital technologies in the second case) was
explored by correlation analysis (both parametric
and non-parametric tests). This analysis produced
the statistically significant positive relationships
between the variables below:
The criteria used for IT Business Value:
IT BV score (IT Business Value AVG)
IT BV for each of the 4 objective categories
(financial, customer, business process,
learning and growth).
The criteria used for Digital Business Value:
Digital BV score (Digital Business Value
AVG)
Digital BV for each of the 4 objective
categories (financial, customer, business
process, learning and growth).
Although this may seem obvious from a first
look, it is important to remember that there is also an
extensive research related to IT project success and
IT project failure rate.
The results on this particular case seem to
suggest that the companies in the sample that have
experienced achievement of financial objectives by
the use of IT also have experienced achievement by
digital technologies. This effect may be because of
the particularity of the sample: these are companies
that have been recognized because of their efficient
use of IT in their business.
Results from correlation analysis (parametric)
are listed below (all results with P<0.01).
At overall level:
IT_Ach and DI_Ach (r=0.885, n=16)
Between each IT and Digital objective counterpart:
IT_Ach_Fi and DI_Ach_Fi (r=0.850, n=13)
IT_Ach_Cu and DI_Ach_Cu (r=0.837, n=16)
IT_Ach_Bp and DI_Ach_Bp (r=0.701, n=14)
IT_Ach_Lg and DI_Ach_Lg (r=0.911, n=12)
These results confirmed the relationship at a
consolidated level as well as for each objective type;
where the achievement of each type of business
objective supported by IT is related with the
achievement of the same objective type by Digital
Technologies.
Additional relationships unveiled by the analysis
are presented here.
Between IT business value supported objective
types (** for P<0.01, * for P<0.05):
IT_Ach_Cu and IT_Ach_Bp (r=0.532*,
n=15)
Between Digital Business Value supported objective
types:
DI_Ach_Fi and DI_Ach_Lg (r=0.632*, n=11)
DI_Ach_Cu and DI_Ach_Bp (r=0.802**,
n=14)
DI_Ach_Lg and DI_Ach_Cu (r=0.583*,
n=12)
DI_Ach_Bp and DI_Ach_Lg (r=0.758**,
n=12)
Also below IT and Digital cross relationships
were found. However these are not pursued in detail
in this study as explained below.
IT_Ach_Bp and DI_Ach_Lg (r=0.812**,
n=12)
IT_Ach_Cu and DI_Ach_Bp (r=0.708**,
n=14)
These results suggest that achievement of
Business and Process objectives by using IT (IT
business value in BP) is related to the achievements
of Learning and Growth by using digital
technologies (Digital Business Value in Lg)
achievement.
A similar relationship is found between the IT
Business value in Customer objectives and Digital
Business Value in Business processes.
Although if we consider only the objective areas
from these two relationships it could be generally
accepted that Learning and Growth could relate to
Business Process objectives; and that Business
Process objectives may relate to Customer
objectives; the variables are one related to IT
technologies and other to digital technologies. This
could be true only if all the IT technologies used for
the achievement are digital technologies. Therefore
these relationships could actually be the result of
indirect effects (e.g. relation with a common
variable) and are not pursued in more detail in this
study.
5.4 Relationship within the Processes of
SECI Model
This study also identified a negative relationship
between SECI knowledge processes.
Socialization and Combination (r=-0.751**,
n=19)
Externalization and Internalization (r=-
0.593**, n=19)
These could be expressed also as:
Socialization (Tacit to Tacit) and Combination
(Explicit to Explicit) are negatively related.
Externalization (Tacit to Explicit) and
Internalization (Explicit to Tacit) are
negatively related.
These results are not surprising but it is
important to remember that this negative
relationship exists when designing knowledge
creation initiatives.
The research framework is updated and included
in Figure 13.
Figure 13: Updated Framework.
6 DISCUSSION
This study did not explicitly inquire the participating
firms to define a specific type of performance
measurement, but instead concentrated on the
overall contribution of IT and digital technologies
towards the achievement of business objectives in
four categories.
In general, available studies used standard
measures like profitability, revenue, ROI, Net
Present Value, etc. to explore the impact or
contribution that IT as well as KM have on
organizations. While such approaches serve well the
purpose of generalizing findings on a specific type
of measure, they do not acknowledge the
individuality of each firm, as each firm could pursue
different objectives while engaging in KM or IT
initiatives.
Therefore the way how this study approached the
measurement of KM, IT business value and Digital
business value can offer a fresh look about benefit
measurement in such areas.
Digital transformation is a topic that both
academia and industry are increasingly focusing on.
Studies aim to unveil how to effectively apply
digital technologies and identify which specific
Balanced
SECI
IT Business Value
FI-
OA
- FI-OA: Financial-related objectives achievement.
- CU-OA: Customer-related objectives achievement
- BP-OA: Business Process-related objectives achievement
- LG-OA: Learning and Growth objectives achievement
CU-
OA
BP-
OA
LG-
OA
Digital Business Value
FI-
OA
CU-
OA
BP-
OA
LG-
OA
S
E
C
I
+ + + + +
-
-
+ + + +
+

characteristics a firm needs to develop in order to
obtain benefits. It could be expected that in a similar
way that the IT Paradox raised concerns on the value
from IT investments it will be sooner than later
when similar concerns will rise towards digital
technologies. This study aimed to leverage from past
attempts to clarify the IT Paradox in order to provide
insights on how to address the performance
assessment of digital technologies.
The results do not suggest a direct relationship
between the level of balanced knowledge creation
processes (Balanced SECI level) and the
achievement of business objectives by either the use
of IT or digital technologies as initially considered
by Hypotheses 1 and 2.
This suggestion should be further explored with
a larger set of data as the number of observations in
this study although had a good representation of the
target population can be considered low. Another
reason for the inconclusive findings could be that
additional firm capabilities not explored in this study
that may exist in the firms could shape the
relationship between Knowledge Creation
Capabilities and achievement of objectives by the
use of IT or digital technologies.
On the other hand, the findings confirmed that
firms with high level of achievement of business
objectives by IT also experience higher level of
achievements from digital technologies (Hypothesis
3). This could be a sign that such firms possess
specific characteristics different from balanced
knowledge creation processes. Characteristics such
as an effective decision process or alignment of IT
strategy with business strategy may be some factors
supporting the achievement of objectives using IT or
digital technologies.
The results showed a relationship between the
achievements of Customer and Business Process
objectives with both IT and digital technologies.
Furthermore, the relationship between the
achievement of Learning and Growth objectives by
digital technologies and the achievement of the other
3 types of objectives could indicate that in the
Digital Age, Learning and Growth focus goes hand
to hand with the achievement of other type of
objectives.
When deriving conclusions from this study, it
should be considered that a key characteristic of the
target population was that participating
organizations had achieved a level of success in the
implementation and use of technology; either by
creating new or improving existing services,
increasing customer experience, adding and making
decisions based on data captured thru mobile
technologies, etc. and they do not represent the
general population of Japanese SMEs.
Nevertheless it is worth considering that some
findings -although not statistically validated- suggest
that the levels of Balanced SECI are actually
negatively related with objective achievement of
Financial, Customer and Business Process objectives,
while positively related with the achievement of
Learning and Growth objectives.
This could mean that the more an organization is
focused on having a balanced and highly intense
Knowledge Creation Processes the more the firm
will be able to achieve Learning and Growth type of
objectives such as education, creativity,
development people capability. Likewise the same
intensity of higher balance in the Knowledge
Creation Processes may not necessarily help the
achievement of financial, customer and business
processes objectives; these types of objectives
include for example expanding revenue, improving
productivity, improving customer satisfaction,
improving customer loyalty, etc.
7 CONCLUSIONS
This study follows a business-oriented perspective
when defining IT and Digital Business Value as the
level of achievement of firm objectives by the use of
IT and digital technologies.
Exploring the relationship between Knowledge
Creating Capabilities and the achievement of
business objectives on several categories provided
insights about which objective area a firm focusing
on knowledge creation process could expect to
obtain results; as well as on which types may not
yield any results.
A relationship between the level of objective
achievement with IT and with digital technologies
was observed. In other words low achievers in the
utilization of IT also showed to be low achievers in
the use of digital technologies. Likewise high
achievers show similar performance in both business
objectives achievement with IT and digital
technologies. This is worth considering in particular
for the firms that plan to engage in digital initiatives
as a good prediction of possible digital initiatives’
performance could be taking a look at the
performance currently achieved with IT.
The future work includes increasing the target
population to provide further statistical evidence, as
well as enriching the research with a mixed-method
approach by using qualitative study on a selective
sample. In addition, exploring other organizational

characteristics that could help linking the knowledge
created through Balanced SECI with first the right
strategic decisions at an organizational level and
then the definition of IT and Digital initiatives (e.g.
Business and IT alignment) and later with its
execution (e.g. Program and Project Management,
Change Management).
REFERENCES
Amit, R., Schoemaker, P., 1993. Strategic assets and
Organizational rent. Strategic Management Journal 13,
pp. 33-46.
Barney, J., 1986. Strategic factor markets: Expectations,
luck, and business strategy. Management Science
32(10), pp. 1231-1242.
Benbya, H., Passiante, G., Belbaly, N.A., 2004. Corporate
portal: a tool for knowledge management
synchronization. International Journal of Information
Management (24:3), pp. 201-220.
Brynjolfsson, E., Hitt, M., 1998. Beyond the productivity
paradox. Communications of the ACM (41:8), pp. 49-
55.
Cabrita M. R., Machado, V.C., Grilo, A., 2010.
Leveraging Knowledge Management with the
Balanced Scorecard. Proceedings of the 2010 IEEE
IEEM, pp 1066-1071.
Chen, M., Chen, A., 2006. Knowledge management
performance evaluation: a decade review from 1995 to
2004. Journal of Information Science (32:1), pp. 17-
38.
Choi, B., Lee, S., 2002. Knowledge Management strategy
and its link to knowledge creation process. Expert
Systems with Applications (23), 2002, pp. 173-187.
Choi, B., Lee, S., 2003. An empirical investigation of KM
styles and their effect on corporate performance.
Information & Management (40), pp. 403-417.
Chou, S., 2005. Knowledge creation: absorptive capacity,
organizational mechanisms, and knowledge
storage/retrieval capabilities. Journal of Information
Science (31:6), pp. 453-465.
Davenport, T. H., Prusak, L., 2000. Working Knowledge:
How Organizations Manage What They Know.
Harvard Business School Press. Boston, MA.
Dedrick, J., Gurbaxani, V., Kraemer, K. L., 2003.
Information Technology and Economic Performance:
A Critical Review of the Empirical Evidence. ACM
Computing Surveys (35:1), pp. 1-28.
Grant, R. M., 1996. Prospering in Dynamically-
Competitive Environments: Organizational Capability
as Knowledge Integration. Organization Science (7:4),
pp. 375–387.
Hirano, M., 2005. Informational Investments and Their
Performance: A Mission of Management Informatics.
Collection of the 51st National Conference of Japan
Society for the Study of Office Automation (11), pp.
35-38.
Innovation Value Institute, 2016. IT Capability Maturity
Framework (IT-CMF) The Body of Knowledge Guide.
Van Haren Publishing, 2
nd
edition.
Kaplan, R., Norton, D., 1996. The Balanced Scorecard -
translating strategy into action, Harvard Business
Review Press. Boston.
Lewin, A., Massini, S., 2004. Knowledge Creation and
Organizational Capabilities of Innovating and
Imitating Firms. In: Organizations as Knowledge
Systems, Palgrave Macmillan. UK, pp. 209-237.
Ministry of Economy, Trade and Industry of Japan, 2016.
Competitive IT Strategy SME Selection 100 in years
2015, 2016. Available at: http://www.meti.go.jp/
english/press/2015/1027_02.html [Accessed 20 May
2017].
Nonaka, I., Byosiere, P., Borucki, C., Konno, N., 1994.
Organizational Knowledge creation Theory: A First
Comprehensive Test. International Business Review
(3:4), pp. 337-351.
Nonaka, I., Takeuchi, H., 1995. The Knowledge-Creating
Company. Oxford University Press, New York, NY.
Nonaka, I., Toyama, R., Konno, N., 2000. SECI, Ba and
Leadership: a Unified Model of Dynamic Knowledge
Creation. Long Range Planning (33), pp. 5-34.
Riera, C., Senoo, D., Iijima, J., 2009. A Study of the
Effect of Knowledge Creating Capabilities on
Corporate Performance. International Journal of
Knowledge Management Studies. 3(1/2), pp. 116-133.
Ross, J., Sebastian, I., Beath, C., Mocker, M., Moloney, K.,
Fonstad, N., 2016. Designing and Executing Digital
Strategies. In ICIS 2016 Thirty Seventh International
Conference on Information Systems. Dublin.
Sandulli, F. D., Lopez-Sanchez, J.I., Rodriguez-Duarte, A.,
Fernandez-Mendez, J., 2007. Analysing the IT
Paradox in the Supply Chain. [online] Available at:
https://ssrn.com/abstract=1105687 [Accessed 20 May
2017].
Small and Medium Enterprise Agency, 2016. White Paper
on Small and Medium Enterprises in Japan 2016.
Available at:
http://www.chusho.meti.go.jp/pamflet/hakusyo/H28/d
ownload/2016hakushopanflet_eng.pdf [Accessed 20
May 2017].
Teece, D. J., Pisano, G., Shuen, A., 1997. Dynamic
capabilities and Strategic Management. Strategic
Management Journal 18(7), pp. 509-534.
Weill, P., 1992. The Relationship between Investment in
Information Technology and Firm Performance: A
Study of the Value Manufacturing Sector.
Information Systems Research (3:4), pp. 307-333.
Weill, P., Aral, S., 2007. IT Assets, Organizational
Capabilities and Firm Performance: How Resource
Allocations and Organizational Differences Explain
Performance Variation. Organizational Science 18(5),
pp. 763-780.
