
Determining a New Home Classification
A Data Mining Approach
Fidel López-Saca
1
, José Castro-López
2
, Josué Figueroa-González
3
and Silvia B. González-Brambila
3
1
Computer Science Master, Universidad Autónoma Metropolitana, Azcapotzalco, CDMX, Mexico
2
Sociology Department, Universidad Autónoma Metropolitana, Azcapotzalco, CDMX, Mexico
3
Systems Department, Universidad Autónoma Metropolitana, Azcapotzalco, CDMX, Mexico
Keywords: Data Mining, Clustering, Social Studies, Home Classification, Elderly.
Abstract: This paper presents a new home classification using a data mining approach and clustering algorithms. It
focus in sociological characteristics. Data was obtained from a survey used in the research project "The
Dwelling of Older Adults in the Central City" that is part of a larger research project entitled "Habitat and
Centrality". This survey has 3,000 registers and 294 columns. From this, we selected 30 columns that were
categorized in 4: gender, if at least one child exists, if a partner exists, and if there are one or more elder. Elder
were 64 or more, following Mexican guidelines. Classification was performed with 6 clustering algorithms,
and evaluated by silhouette and Dunn. The proposed classification is 10 clusters, that more adequately
represent the type of families from a sociological point of view.
1 INTRODUCTION
There are many clustering algorithms in the literature.
However, to give a particular database, select the
appropriate algorithm and the optimal number of
clusters is usually a difficult task. Also relevant is a
suitable interpretation to the application area.
Usually, social studies use the standard home
classification: nuclear family, extended family,
family compound, non-family unipersonal and non-
family correspondent. However, our society has
evolved in different ways, so currently this
classification can no longer support all the decisions
on quality of life. Examples of services like
playground or a hospital depend on the people who
live near and the standard home classification
contributes little information.
For the statistic analysis and data mining to
determine the home types, we used the R project. R is
a GNU project, has a wide variety of statistical and
graphical techniques and is extensible. It is a
complete computer language and allows additional
funcionality so it can be extended via packages (R
Core Team, 2017).
Organization of this paper is as follow: section 2
presents a brief explanation of the social inquest, and
their main characteristics. In section 3 we present the
actual home classification in Mexico and some
statistics of the survey. Section 4 presents the
knwoledge discovery processes of this study,
algorithms, and considerations taken. Finally, section
5 presents some interpretations with social emphasis
and future works.
2 SOCIAL INQUEST
Specialized literature on the demographic
characteristics of the central area of Mexico City are
considering the phenomenon of the aging of its
population, the decrease of the size of the homes, and
the density of the home. (Garrocho and Campos,
2016; Negrete, 2003).
It also accounts for the importance they have
acquired in recent years in the city, particularly in the
central area, single-person homes, female-headed
homes and homes with the elderly. The last ones in
many cases combine the characteristics of the
previous ones (Ponce and Flores, 2012).
However, there are few empirical studies that
explore the characteristics of homes composition at
the "neighborhood" or "colony" scale, much less
homes where at least one of the members is an older
adult.
We think this is due in part to a home
classification that does not account for the diversity
López-Saca, F., Castro-López, J., Figueroa-González, J. and González-Brambila, S.
Determining a New Home Classification - A Data Mining Approach.
DOI: 10.5220/0006487704150420
In Proceedings of the 6th International Conference on Data Science, Technology and Applications (DATA 2017), pages 415-420
ISBN: 978-989-758-255-4
Copyright © 2017 by SCITEPRESS – Science and Technology Publications, Lda. All rights reserved
415
of "residentiality arrangements" experienced by the
urban population of today.
2.1 Characteristics of the Survey
The research project "The Dwelling of Older Adults
in the Central City" is part of a larger research project
entitled "Habitat and Centrality":
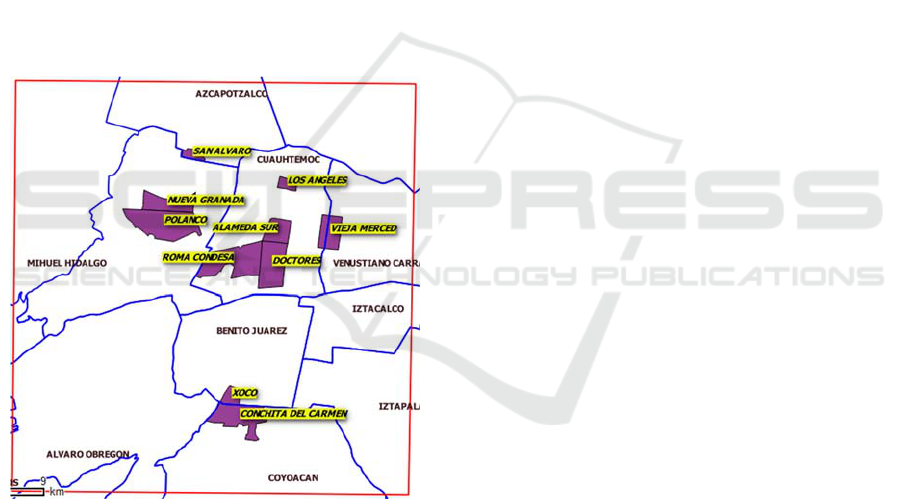
For the Habitat and Centrality investigation, a
survey of 3,000 homes located in ten "polygons" or
"witness areas" (see Figure 1) of the Central City of
Mexico City was applied between August 9th and
19th, 2014. The most relevant characteristics of the
survey are: a) the master design was defined based on
300 questionnaires applied in each one of 10 "control
areas", b) that the housing to be surveyed would
guarantee spatial coverage in each "witness area" and
c) that the questionnaire would be applied to the head
of the householder or person who participates in the
decision making, after the second visit of not finding
the head of household (Castro, 2016).
Figure 1: Polygons of the Mexico City.
The questionnaire applied consists of 60
questions, 38 of which are open. They address the
following issues: a) Socio-economic variables of
homes, b) Residents' practices and their link to
centrality, c) Public/political action on housing, d)
Tensions and Conflicts, e) Follow-up of stakeholders
on the research.
Regarding the socioeconomic variables of homes,
the survey includes the following: a) number of home
members, b) age, gender and relationship to the home
head of each home, c) level of education of the head
of household, d) marital status, e) main activity f)
home income and g) NSE/AMAI index (http://
http://nse.amai.org/nseamai2/#nse-amai).
NSE/AMAI was created by the Mexican
Association of Market Intelligence and Opinion
(AMAI), the Socioeconomic Levels Index (NSE) is
the standard, based on statistical analysis, which
allows to group and classify Mexican homes into
seven levels, according to the level of satisfaction of
its members in terms of: housing, health, energy,
technology, prevention and intellectual development.
The satisfaction of these dimensions determines their
quality of life and well-being.
The data base has 3,000 surveys with more than
250 variables, around 4 Mb.
3 ACTUAL HOME
CLASSIFICATION
Mexico City has a great population diversity, some
people live alone, other live with a partner, and some
of them have children, among others, so a
classification of these groups is an interesting topic.
3.1 Home Classification
Usually, social studies use the homes composition
classification used by the National Institute of
Statistics and Geography (INEGI), an independent
public agency responsible for regulating and
coordinating the National Statistical and Geographic
Information System of Mexico, which classifies
homes as relative and not relative according to the
type of relationship their members have with the head
of the home. According to this classification, homes
are grouped into one of the following types:
Nuclear Family. Family home made up of the
female and/or male head of the family and his
wife or her husband respectively and their
daughters and/or sons.
Expanded Family. A family home consisting of a
nuclear home and at least other relative, or a
female head or a male head, and at least other
relative.
Compounded Family. Family home consisting of
a nuclear or extended home and at least one
unrelated member.
Non family-Unipersonal. Non-family home
made
up by a single member.
No family-coresidents. Non-familiar home
consisting of two or more members that are not
relatives of the head of the family
. (INEGI, 2015).
KDCloudApps 2017 - Special Session on Knowledge Discovery and Cloud Computing Applications
416
3.2 Data Survey
It is important to know the impact that home type has
in Mexican families. For example, how many
households are men or women, and the differences
that exist. In the sample, most of the people that are
head of family are men, this is shown in Table 1.
Table 1: Men and women household.
Househol
d
Families Percent
Man 2505 83.50
Woman 495 16.50
Total 3000 100
Because heads of households make decisions
about housing, it is important to know whether or not
they have a partner. Most of the families, near 75%,
has a man as a head of household with a partner. As
can be seen in Table 2, there are more female head of
household without partner than men, out of the
sample of 3,000 households.
Table 2: Head of household with and without partner.
Description
Total
Numbe
r
Percent
Man is the head of household with
partne
r
2147 71.57
Woman is the head of household
with partne
r
70 2.33
Man is the head of household
without partne
r
358 11.93
Woman is the head of household
without partne
r
425 14.17
Total 3000 100.00
The percentage of homes where a man is head of
household and live alone with a partner (14.43%) is
almost the same of those who live with a partner and
one child (15.63%). In contrast, the similar cases
where the women is the head of household, with
0.77% and 0.37% respectively. The percentage of
men and women that live alone is very similar, 3.13%
and 3.43%, respectively. There are more women head
of household living with one and two children than
men. The number of woman head of household living
with one and two children is similar, 2.27% and
2.63%, respectively. The number of men living with
one children is almost double of those that live with
2; in both cases is very low. See Table 3.
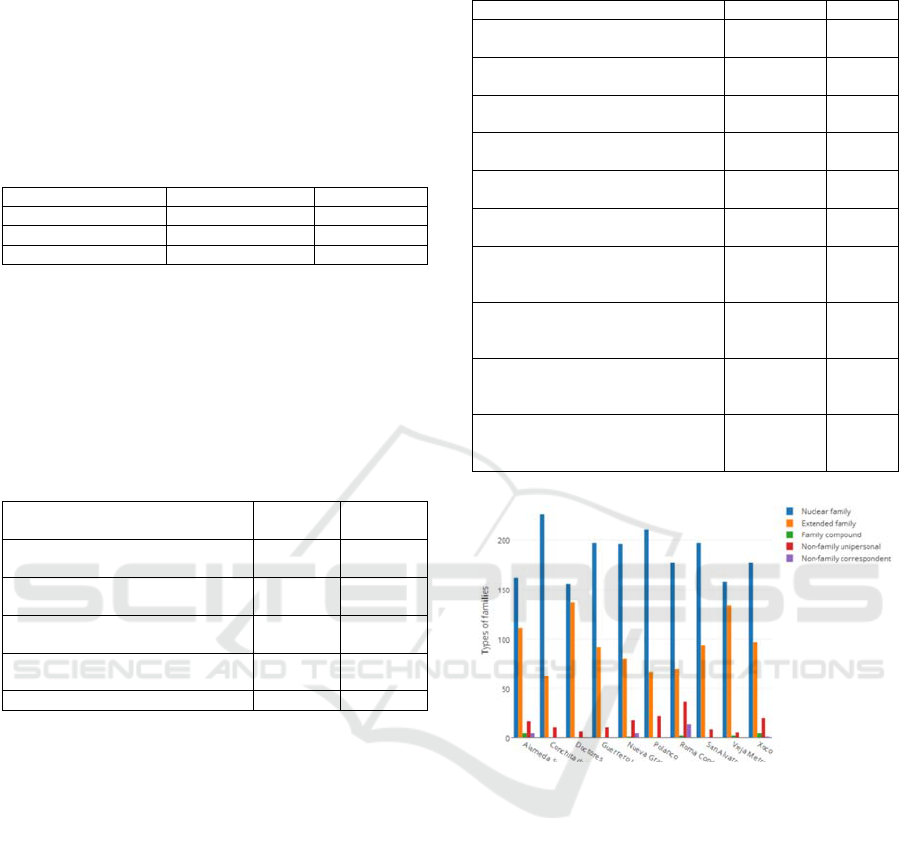
With the actual home classification, of the 3,000,
the nuclear families represent 61.9%, the extended
family 31.5%, family compound 0.5%, non-family
unipersonal 5.27% and the non-family correspondent
0.83%. See Figure 2 for more details.
Table 3: Men and women family conformation.
Description Total Numbe
r
Percent
Man is the head of household living
alone with partne
r
433 14.43
Man is the head of household living
with partner and one children
469 15.63
Woman is the head of household
living alone with partne
r
23 0.77
Woman is the head of household
living with partner and one children
11 0.37
Man is the head of household living
alone
94 3.13
Woman is the head of household
living alone
103 3.43
Man is the head of household
without partner living with one
children
29 0.97
Woman is the head of household
without partner living with one
children
68 2.27
Man is the head of household
without partner living with two
children
16 0.53
Woman is the head of household
without partner living with two
children
79 2.63
Figure 2: Types of families in each polygon.
It is important to consider that families are not
static, and they evolve in time. For example, children
grow, parents get divorced, older people help with
infants, and many others. Some polygons today could
be considered mostly composed of older people, but
possibly in a few years they can be composed by
nuclear families, because people inherit their homes
to their descendants.
4 KNOWLEDGE DISCOVERY OF
THE SOCIAL INQUEST
4.1 Used Cluster Algorithms
There are many clustering algorithms in the literature.
Determining a New Home Classification - A Data Mining Approach
417

However, to give a particular database, select the
appropriate algorithm and the optimal number of
clusters, is usually a difficult task. Also relevant is a
suitable interpretation to the application area.
clValid R package (Brock et al., 2008) was used
for this purpose. It has three different measures for
assessing the goodness of clustering results and for
identifying the best performing clustering algorithm.
We used internal validation that uses intrinsic
information. The internal measures reflect the
compactness, connectedness and separation of the
cluster partitions. The internal measures are:
Connectivity. Related to their nearest neighbors in
the data space. Has a value between 0 and infinity
and should be minimized.
Average Silhouette width. Related with the degree
of confidence in the clustering assignment of a
particular observation. Has a value between -1 and
1 and should be maximized.
Dunn index. Related with the ratio of the smallest
distance between observations not in the same
cluster to the largest intra cluster distance. Has a
value between 0 and infinity and should be
maximized.
The Dunn index and silhouette width are both non-
linear combinations of the compactness and
separation.
K Means is an unsupervised learning algorithm
that tries to group data based on their similarity. It is
unsupervised because there is no outcome to be
predicted, and the algorithm tries to find patterns in
data. In this algorithm we must specify the number of
clusters to group data into. Randomly the algorithm
assigns each register to a cluster, and finds the center
of each cluster. Then, the algorithm iterates, reassigns
data points to the cluster whose center is closest and
calculates new center of each cluster. These two steps
are repeated until there are no significate variation,
calculated as the sum of the Euclidean distance
between the data points and their respective cluster
centers.
PAM stands for “Partition Around Medoids”. It
finds a sequence of medoids that are centrally located
in clusters. The medoids are placed into S, a set of
selected objects. If O is the universe of objects then
the set U = O-S contains the unselected objects. The
goal is to minimize the average dissimilarity of
objects to their closest selected object.
Hierarchical Clustering involves creating clusters
that have a predetermined ordering from top to
bottom. The basic process is:
1. Assign each item to its own cluster. The distances
(similarities) between the clusters equal the
distances between the items they contain.
2. Find the closest pair of clusters and merge them
into a single.
3. Compute distance between new clusters and each
of the old clusters
4. Repeat steps 2 and 3 until all items are clustered
into a single cluster of size N.
4.2 Cluster Algorithms Evaluation
We started consulting the maximum number of
people per home that was found in the questionnaires.
The maximum number of people was 10, but each
person has different characteristics such as age,
gender, and the type of family member, which might
be head of household, spouse or partner, son,
domestic worker, another relationship, or host.
There is a great diversity in the characteristics of
the columns that are in the original Data Base, and it
was considered to make extracts of the characteristics
of the columns that allow for a more natural and
familiar classification on the social needs that the
families present. In the columns 18-27 of the
database, the type of family member was found, in the
columns 29-37 the age of each family member, and in
the columns 38-47 the gender of each one. It is
important to say that in each home there are between
1 to 10 members, so some of the records have NA,
except that there is always a head of household. To
find the solution to this problem, the preprocessing
was done by reducing from 30 to 4 the number of
columns per home. In the new columns, the first one
refers to the head of household, the second one refers
whether are at least a child, in the third if the head of
household have a partner, and finally whether there is
a person over 64. By doing the above, it was possible
to work with the 3,000 questionnaires because now
all records have 1 or 0, allowing classify algorithms.
Then we select:
- Gender of the head of householder, 1 for men and
0 for women.
- Children, represented by 1 if there are one
children or more; 0 means no children.
- Partner, 1 if the head of householder has a partner
and 0 otherwise.
- Older than 64, 1 if there is a 64 or older person
living in the house, 0 otherwise. 64 is the most
used age in Mexico to define an elderly person.
The results obtained by the clValid function (Brock et
al., 2008) are shown in Table 4.
We discard hierarchical of two, because we are
trying to bring services more in line with the
physiological needs of a given region.
KDCloudApps 2017 - Special Session on Knowledge Discovery and Cloud Computing Applications
418
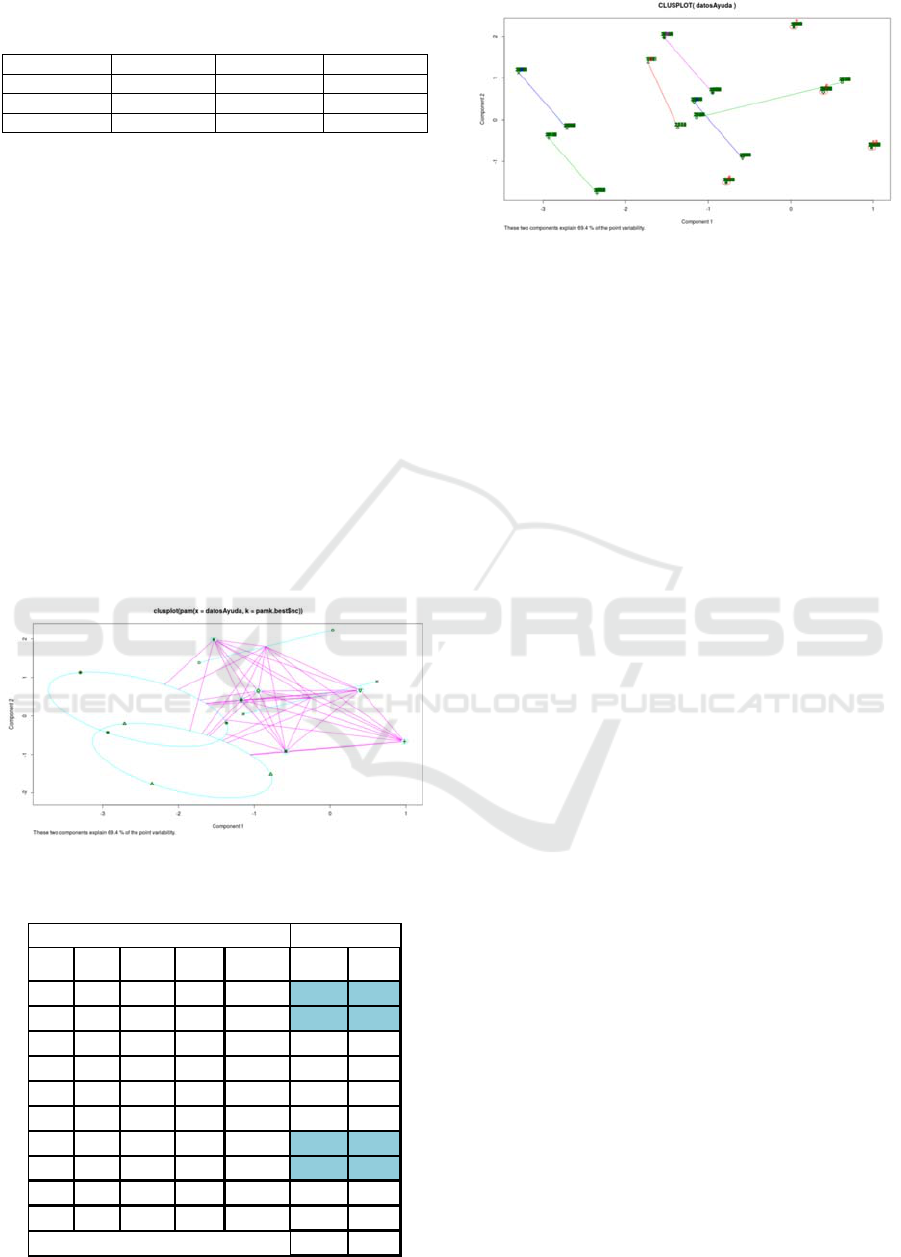
Table 4: Optimal Scores, for validation of clustering results
using clValid function.
Score Method Clusters
Connectivity 0.0000 hierarchical 2
Dunn 1.0000 hierarchical 8
Silhouette 0.9042 pam 10
From the other two indexes, we consider that
Silhouette is more representative in this case, for the
degree of confidence. PAM interpretation with 10
clusters does not consider women head householder
without children neither without partner and other
cases do not consider the group of heads of
households that are women with children and with
partner. Given the large number of divorces in
Mexico, we consider that these cases have increased
in the last years. So we decided to run K-means with
10 clusters. The results with PAM and K-means both
with 10 clusters are shown in Table 5. Clusters more
similar in both PAM and K-means are highlighted in
blue. The similarity was first determined by the
number of elements in each cluster. This results are
plot in Figures 3 and 4, respectively.
Both clustering, PAM and K-means show the
importance that elderly adults have in Mexican
homes.
Figure 3: Clustering PAM Plot.
Table 5: Results with 10 clusters with PAM and K-means.
Figure 4: Clustering K-means plot.
5 CONCLUSIONS AND FUTURE
WORKS
Using the classification methods, what can be
contributed to the typology of the type of household
traditionally used in social studies is the identification
of subtypes of households of extended families with
the presence of at least one older adult. As can be seen
in the clusters 1 to 5 of Table 5.
Recognizing the heterogeneity of this type of
household would allow us to have a broader
understanding of the needs and characteristics that
would allow us to define more appropriate urban
policies. These households, where at least one older
adult is present, are currently of great importance
because the life expectancy of the population in
Mexico has had a positive trend for several years. For
example, it is estimated that in 2050 the number of
older adults in Mexico will represent more than 25%
of the population.
Results obtained using clustering algorithms
allow to identify the importance of nuclear
households (which reports in the specialized
literature), as well as identify different residential
arrangements within this group. Such is the case of
households with older adults. Population group that
according to the demographic projections of the
National Population Council (CONAPO) by 2030 in
Mexico there will be 20.4 million people.
In this paper was identified that 28% of homes
have at least one elderly as member. Of them, 61% is
head of household and in 39% of these homes the
elderly depend on a relative.
There is a lot of work to do. Undoubtedly we must
apply more clustering algorithms, consider more
variables, consider clustering data of mixed
categorical and numerical type, and consult with
social expert groups.
Cluster Gender Children Partner
Older than
64
PAM Kmeans
1 1 0 1 1 245 236
2 1 1 1 1 293 293
301 0 1 170*
411 0 1 80 *
510 0 1 71 *
601 0 0 297*
7 1 1 1 0 1261 1261
8 1 0 1 0 376 376
910 0 0 133*
10 1 1 0 0 74 *
3000 2166
Number of homes
Total homes:
Determining a New Home Classification - A Data Mining Approach
419

REFERENCES
Guy Brock, Vasyl Pihur, Susmita Datta, Somnath Datta
(2008). clValid: An R Package for Cluster Validation.
Journal of Statistical Software, 25(4), 1-22.
URL http://www.jstatsoft.org/v25/i04/.
Garrocho, Carlos and Campos, Juan (2016) Segregación
Socioespacial de la población mayor en la Ciudad de
México, 2000-2010. En Consejo Nacional de
Población, La Situación Demográfica en México, 2015,
México 2016. CONAPO, pp 167-195
Negrete Salas, María Eugenia. (2003). El envejecimiento
poblacional en la Ciudad de México: evolución y pautas
de distribución espacial entre 1970 y 2000. Papeles de
población, 9(37), 107-127. Consulted on May 9th,
2017,
http://www.scielo.org.mx/scielo.php?script=sci_arttext
&pid=S1405-74252003000300005&lng=es&tlng=es
Ponce, Gabriela and Flores, René (2012) Población y
vivienda en el polígono central del Distrito Federal, en
Coulonb Bosc, René, Hernández Esquivel, María
Teresa, Ponce Sernicharo, Gabriela (coord.) Hábitat y
Centralidad en México: Un desafío sustentable.
México, Centro de Estudios Sociales y de Opinión
Pública. Cámara de Diputados.pp. 59-83
Castro, José (2016) Anexo Metodológico en Coulonb Bosc,
René, Hernández Esquivel, María Teresa, Ponce
Sernicharo, Gabriela (coord.) Habitar la Centralidad
Urbana (II): Prácticas y Representaciones sociales
frente a las transformaciones de la Ciudad Central.
México, Instituto Belisario Domínguez Senado de la
República pp 313-326
R Core Team (2017). R: A language and environment for
statistical computing. R Foundation for Statistical
Computing, Vienna, Austria. URL https://www.R-
project.org/.
Moore, R., Lopes, J., 1999. Paper templates. In
TEMPLATE’06, 1st International Conference on
Template Production. SCITEPRESS.
Smith, J., 1998. The book, The publishing company.
London, 2
nd
edition.
Instituto Nacional de Estadística y Geografía (INEGI)
(2015), Glosario de la Encuesta Intercensal 2015.
Aguascalientes, México
Consejo Nacional de Población (2000), Proyecciones de la
Población 2010-2050, México, CONAPO
KDCloudApps 2017 - Special Session on Knowledge Discovery and Cloud Computing Applications
420
