
Concatenation, Embedding and Sharding:
Do HTTP/1 Performance Best Practices Make Sense in HTTP/2?
Robin Marx, Peter Quax, Axel Faes and Wim Lamotte
UHasselt-tUL-imec, EDM, Hasselt, Belgium
Keywords:
Web Performance, Best Practices, HTTP, Server Push, SpeedIndex, Networking, Measurements.
Abstract:
Web page performance is becoming increasingly important for end users but also more difficult to provide
by web developers, in part because of the limitations of the legacy HTTP/1 protocol. The new HTTP/2 pro-
tocol was designed with performance in mind, but existing work comparing its improvements to HTTP/1
often shows contradictory results. It is unclear for developers how to profit from HTTP/2 and whether current
HTTP/1 best practices such as resource concatenation, resource embedding, and hostname sharding should
still be used. In this work we introduce the Speeder framework, which uses established tools and software
to easily and reproducibly test various setup permutations. We compare and discuss results over many pa-
rameters (e.g., network conditions, browsers, metrics), both from synthetic and realistic test cases. We find
that in most non-extreme cases HTTP/2 is on a par with HTTP/1 and that most HTTP/1 best practices are
applicable to HTTP/2. We show that situations in which HTTP/2 currently underperforms are mainly caused
by inefficiencies in implementations, not due to shortcomings in the protocol itself.
1 INTRODUCTION
For a long time, version 1 of the HyperText Trans-
fer Protocol (HTTP/1, h1) has been the only way to
request and transfer websites from servers to clients.
Under the pressure of ever more complex websites
and the need for better website load performance, h1
and its practical usage have evolved significantly over
the last two decades. Most of the changes help to
combat the fundamental concept of h1 to only request
a single resource per underlying TCP connection at
the same time (where slow resources can delay oth-
ers, called “head-of-line (HOL) blocking”), by better
(re-)use of these connections or by making use of par-
allel connections. The protocol specification now in-
cludes techniques such as request pipelining and per-
sistent connections. In practice, further workarounds
and tricks have become commonplace to help speed
up h1: modern browsers will open several parallel
connections (up to six per hostname and 30 in to-
tal in most browser implementations) and web devel-
opers apply techniques like resource concatenation,
resource embedding and hostname sharding as best
practices (Grigorik, 2013). However, these heavily
parallelized setups induce large additional overheads
while not providing extensive performance benefits in
the face of ever more complex websites.
A redesign of the protocol was needed and start-
ing with SPDY, Google led a movement back towards
using just a single TCP connection, this time allowing
multiple resources to be multiplexed at the same time,
alleviating the HOL blocking of h1 and making better
use of the TCP protocol. This effort culminated in the
standardization of HTTP/2 (h2) (Belshe et al., 2015).
Advanced prioritization schemes are provided to help
make optimal use of this multiplexing and the novel
h2 Push mechanism allows servers to send resources
to a client without receiving a request for them first.
In theory, h2 should solve most of the problems
of h1 and as such make its best practices and opti-
mizations obsolete or replaceable (Grigorik, 2013).
However, in practice the gains from h2 are limited
by other factors and implementation details. Firstly,
h2 eliminates application-layer HOL blocking but it
could be much more sensitive to transport-layer HOL
blocking (induced by TCP’s guarantee of in-order de-
livery combined with re-transmits when packet loss
is present) due to the individual underlying connec-
tion (Goel et al., 2016). Secondly, the multiplex-
ing is highly dependent on correct resource prioriti-
zation and might introduce its own implementation
overhead as chunks need to be aggregated. Finally,
complex inter-dependencies between resources and
late resource discovery might also lessen the gains
160
Marx, R., Quax, P., Faes, A. and Lamotte, W.
Concatenation, Embedding and Sharding: Do HTTP/1 Performance Best Practices Make Sense in HTTP/2?.
DOI: 10.5220/0006364101600173
In Proceedings of the 13th International Conference on Web Information Systems and Technologies (WEBIST 2017), pages 160-173
ISBN: 978-989-758-246-2
Copyright © 2017 by SCITEPRESS – Science and Technology Publications, Lda. All rights reserved

from h2 (Netravali et al., 2016). That h2 is not a
simple drop-in replacement with consistently better
performance than h1 is also clear from previous stud-
ies, which often find cases where h2 is significantly
slower than h1. Many of these studies also show con-
tradictory results, potentially because they use differ-
ent experimental setups. We discuss related work in
Section 2.
This leaves web developers and hosting compa-
nies with an unclear path forwards: they cannot just
enable h2 because it could deteriorate performance,
but they also do not know which concrete changes
their websites need in order to make optimal use of
the new protocol.
In this paper, we look at the most common h1
optimizations: resource concatenation, resource em-
bedding and hostname sharding. We evaluate their
performance over three versions of the HTTP proto-
col: the secure HTTPS/2 (h2s) and HTTPS/1.1 (h1s)
and also the unencrypted HTTP/1.1 (h1c), because
many websites still use this “cleartext” version. We
do not include h2c, as modern browsers choose to
only support h2s for security reasons. Note addition-
ally that switching from h1c to a secure setup (either
h1s or h2s) could have its own performance impact
as TLS connections typically require additional net-
work round-trips to setup. The next sections use h2 to
refer to h2s and h1 to refer to both h1s and h1c at the
same time.
Our main contributions are as follows:
• We introduce the Speeder framework for web
performance measurement, which combines a
large number of off-the-shelf software packages
to provide various test setup permutations, leading
to a broad basis for comparison and interpretation
of experimental results.
• We show that resource concatenation and host-
name sharding are still best practices when us-
ing h2 and that HTTP/2 Push is a good replace-
ment for resource embedding.
• We compare h2 to both h1s and h1c to find
that h2 rarely significantly improves perfor-
mance over h1 (both secure and cleartext) and
can severely slow down sites currently on h1c.
However, in most cases bad network conditions
do not seem to impact h2 much more than they
impact h1.
• We use the SpeedIndex metric (Meenan, 2012)
to show that h2 is often later than h1 to start
rendering the web page and discover various
browser quirks. Additionally, we show that im-
plementation details can have a significant impact
on observed performance.
We will first look at hand-crafted experiments on
synthetic data (Section 4). These test cases are in-
tended to make the underlying behavior of the pro-
tocols and their implementations clearer, and so are
often not entirely realistic or involve extreme circum-
stances. Secondly, we look at more realistic data
based on existing websites (Section 5). We expect
that, compared to the experiments on synthetic pages,
these test cases will show similar but more nuanced
results and trends.
2 RELATED WORK
Various authors have published works comparing the
performance of h2 and its predecessor SPDY to h1.
Some also discuss h1 best practices and h2 Push. We
highlight some of their findings and methods.
In “how speedy is SPDY?” (Wang et al., 2014)
the authors employ isolated test cases to better as-
sess the impact of various parameters (latency, band-
width, loss rate, initial TCP window, number of ob-
jects and object sizes). They observe that “object size
and packet loss rate are the most important factors in
predicting SPDY performance”, in other words SPDY
hurts when packet loss is high (mainly due to the sin-
gle underlying TCP connection) but helps for many
small objects. They also find it “helps for many large
objects when the network is fast”. For real pages, they
find that SPDY helps up to 80% of pages under low
bandwidths, but only 55% of pages under high band-
width.
“Towards a SPDY’ier Mobile Web?” (Erman
et al., 2013) performs an analysis of SPDY over a va-
riety of real networks and finds that underlying cel-
lular protocols can have a profound impact on its per-
formance. For 3G, SPDY performed on a par with h1,
with LTE showing only some improvements over h1.
A faster 802.11g network did yield improvements of
4% to 56%. They further conclude that using multiple
TCP connections (∼sharding) does not help SPDY.
“Is The Web HTTP/2 Yet?” (Varvello et al.,
2016) periodically measures page load performance
by loading real websites over real networks from their
own origin servers. They observe that most websites
using h2 also still use h1 best practices like embed-
ding and sharding. They find that “these practices
make h2 more resilient to packet loss and jitter” and
that 80% of the observed pages perform better over
h2 than over h1 and that h2’s advantage grows in mo-
bile networks. On the other hand they also find that
the remaining 20% of the pages suffer a loss of per-
formance.
“Rethinking Sharding for Faster HTTP/2” (Goel
Concatenation, Embedding and Sharding: Do HTTP/1 Performance Best Practices Make Sense in HTTP/2?
161

et al., 2016) introduces a novel network emulation
technique based on measurements from real cellular
networks. They use this technique to assess the per-
formance of hostname sharding optimization over h2.
They find that h2 performs well for pages with large
amounts of small and medium sized objects, but suf-
fers from higher packet loss and larger file sizes. They
demonstrate that h2 performance can be improved by
sharding, though it will not always reach parity with
h1.
“HTTP/1.1 pipelining vs HTTP2 in-the-clear:
performance comparison” (Corbel et al., 2016) com-
pares h1c to h2c (a mode of the protocol not currently
supported by any of the main browsers). They disre-
gard browser computational overhead while running
experiments over a network emulated by TC NETEM,
and find that on average h2c is 15% faster than h1c
and “h2c is more resilient to packet loss than h1c”.
Additional academic work found that for a packet
loss of 2%, “h2s is completely defeated by h1s” and
that even naive server push schemes can yield up to
26% improvements (Liu et al., 2016). Others con-
clude that h2 is mostly interesting for complex web-
sites, showing up to a 48% decrease in page load time,
10% when using h2 Push, and that h2 is resilient
to higher latencies but not to packet loss (de Saxc
´
e
et al., 2015). Further experiments indicate that h2
Push seems to improve page load times under almost
all circumstances (de Oliveira et al., 2016). Finally,
Carlucci et al. find that packet loss has a very high
impact on SPDY, up to a 120% increase of page load
time on a high bandwidth network (Carlucci et al.,
2015).
Our review of related work clearly shows that the
current state of the art is often contradictory in its con-
clusions regarding h2 performance. It is not clear if
sharding still provides significant benefits, if h2 is re-
silient to poor network conditions or not and what de-
grees of improvement developers might expect when
moving to h2.
We believe that one of the reasons for these con-
tradictions is the way in which researchers construct,
execute and measure their experiments. Addition-
ally, most authors only use a single software tool for
most parts of the process, e.g., just a single server
package, one browser or client, one network setup
and one metric. Without comparing different tools
and metrics, some results could be attributed as being
inherent to the tested protocol, while they are actu-
ally caused by implementation details in the tool be-
ing used. Moreover, developers often use alterna-
tive tools that provide more complex metrics to assess
their site performance (e.g., Google Chrome devtools,
webpagetest.org and “Real User Monitoring” tools)
Table 1: Speeder software and metrics.
Protocols HTTP/1.1 (cleartext), HTTPS/1.1, HTTPS/2
Browsers Chrome (51 - 54), Firefox (45 - 49)
Test drivers Sitespeed.io (3), Webpagetest (2.19)
Servers Apache (2.4.20), NGINX (1.10), NodeJS (6.2.1)
Network - DUMMYNET (cable and cellular) (Webpagetest)
- fixed TC NETEM (cable and cellular)
- dynamic TC NETEM (cellular) (Goel et al., 2016)
Metrics All Navigation Timing values (Wang, 2012),
SpeedIndex, firstPaint, visualComplete, other
Webpagetest metrics (Meenan, 2016)
(Gooding and Garza, 2016).
Finally, in this fast moving field, even the proto-
cols evolve very rapidly. Experiments run two years
or even a couple of months ago might yield different
results on newer versions of the used software.
All this makes that results and conclusions are of-
ten difficult to compare and reproduce. We aspire to
help resolve this problem by introducing the Speeder
framework for web performance measurements.
3 THE SPEEDER FRAMEWORK
Recognizing the fact that different implementations
can influence experiment results and conclusions
and that these are often difficult to compare, we
introduce the Speeder framework for web perfor-
mance measurement. Speeder allows users to run and
compare experiments on a variety of test setups using
various software packages. It automates setting up
and driving the various tools to make the overhead
of maintaining multiple setups manageable. Users
simply need to select the desired setup permutations
and the framework collects and aggregates a multi-
tude of key metrics. Users can then utilize various
visualization tools to compare the results.
Speeder mainly aims to accomplish two different
goals in the following ways:
• Make it easier to differentiate between
protocol- and implementation related behav-
ior: Speeder includes a number of different
software packages for each setup component
(see Table 1). Through mutual combination,
these provide a large number of permutations for
possible experiment setups, which leads to a large
comparison basis for the results.
• Make it easier to create reproducible results
for both researchers and developers: Speeder
uses freely available off-the-shelf and open source
tools and software. We deploy our setups using
Docker containers, which can easily be updated
WEBIST 2017 - 13th International Conference on Web Information Systems and Technologies
162

Figure 1: Conceptual schematic of the Speeder Framework.
with new software and older configurations can
be re-used if needed. Docker images can also be
distributed and shared with others.
Speeder focuses on the concept of a “full emulated
setup” (both client and server), though it can conceiv-
ably also measure real web pages over real networks
(only client) or serve experiments for testing with ex-
ternal tools (only server). This approach should apply
to researchers and also developers during their devel-
opment process.
Unless indicated otherwise, the results in this
work are from an experimental setup using NGINX
on the server, Google Chrome driven by Webpagetest
and the dynamic network model (Goel et al., 2016).
Readers are encouraged to review our full
dataset (including results not presented in this pa-
per for Apache, sitespeed.io and the Fixed net-
work model) and setup details and sourcecode via
https://speeder.edm.uhasselt.be.
Setup: As displayed in Figure 1, Speeder is
deployed on eight backend linux Virtual Machines
(VMs), eight sitespeed.io agent linux VMs, five Web-
pagetest agent Windows 10 VMs and one linux
command-and-control (C&C) VM that includes an
InfluxDB database to store aggregated test results.
These are distributed across two physical Dell Pow-
erEdge R420 machines with at least two dedicated
logical cores and 2 GB RAM per VM. They are con-
nected through 1 Gbit ethernet.
All linux software is deployed inside Docker con-
tainers, with at most one container running in each
VM at the same time to prevent test results being in-
fluenced by other tests. As such, no more than 8 in-
dividual tests can be running at the same time. Web-
pagetest is deployed without Docker as there are VM-
based distributions readily available and it is more dif-
ficult to Dockerize its Windows-only setup. Network
emulation using TC NETEM is done in the server con-
tainer.
While this type of highly virtualized setup can
influence the measured load times, we believe it
still allows accurate comparisons since all tests are
equally influenced. Similar setups are used in related
work (Goel et al., 2016; Corbel et al., 2016).
Metrics: Most related work uses loadEventEnd
from the Navigation Timing API (Wang, 2012) as
the main metric for page performance. However, this
metric only indicates the total page load time and
not how the visual rendering progresses over time: a
page that stays empty for 5s and only renders content
the last 0.6s (page A), will have a better observed
performance than a page that only completely finishes
loading at 7.5s, but that had its main content drawn
by 2.5s (page B), while the latter can arguably has
the better end-user experience.
Google’s SpeedIndex (Meenan, 2012) aims to
provide a better indication of how progressively a
page renders by recording a video during the page
load and using image analysis to determine how much
of a page was loaded at any given time. As such, it is
more a metric of how early and often a page updates
during load and not purely of how fast a page load
completes. Perhaps counter-intuitively, this means
page B would have a lower SpeedIndex than page
A, even though it finishes loading later. SpeedIndex
is expressed in milliseconds and lower values mean
better performance (similar to loadEventEnd).
We find that the two metrics often show simi-
lar behavior (especially for synthetic test cases) and
so, for easier comparison with related work, we
present mainly loadEventEnd while comparing it to
SpeedIndex in the case of significant divergence.
Network emulation: Because it is practically dif-
ficult to continuously test a large number of parame-
ter permutations over real-life (cellular) networks, we
aim to provide a number of different network emula-
tion models so we can perform our tests in a locally
controlled network. We have implemented two mod-
els so far: fixed and dynamic.
Table 2: Fixed network model.
preset throughput (in kbit) latency / jitter (in ms) % loss
wifi 29000 75 / 5 0
wifi loss 29000 75 / 5 0.2
4g 4200 95 / 10 0
4g loss 4200 95 / 10 0.6
3g loss 750 170 / 20 1
2g loss 500 220 / 20 1.2
The fixed traffic model (see Table 2) was inspired
by the Google Chrome devtools throttling settings
1
,
with an added 75ms round-trip latency to simulate
transatlantic traffic
2
and added loss based on Tyler
Treat’s setup
3
. This model simply sets and keeps the
1
https://goo.gl/IBMtmV
2
http://www.verizonenterprise.com/about/network/latency/
3
https://github.com/tylertreat/comcast
Concatenation, Embedding and Sharding: Do HTTP/1 Performance Best Practices Make Sense in HTTP/2?
163

parameters for TC NETEM constant for the duration of
the test. This means there is a constant random packet
loss.
The dynamic model uses previous work (Goel
et al., 2016) which introduced a model based on real-
life cellular network observations. The model has
six levels of “user experience (UX)”: NoLoss, Good,
Fair, Passable, Poor and VeryPoor. Each UX level
contains a long list of values for bandwidth, latency
and loss. The model changes these parameters in in-
tervals of 70ms by picking the next value from the list
to simulate a real network. This means the packet loss
is more bursty than with the fixed model. For details,
please see their paper or the original source code
4
.
We mainly report results using the dynamic model
because, despite the fact that it only emulates cellular
networks, we feel it is most representative of a realis-
tic network and makes it easier for others to compare
our results to related work.
4 HTTPS/2 IMPACT ON HTTP/1
BEST PRACTICES
In this section we study the impact of applying h2 on
three well-known h1 performance best practices: re-
source concatenation, resource embedding and host-
name sharding. We create a number of test cases for
each best practice to assess its performance in isola-
tion of other factors. To be able to compare our re-
sults using the SpeedIndex metric, we make sure our
loaded resources have a strong visual impact on the
visible “above the fold” part of the website. All im-
ages are included as <img> and all CSS and JavaScript
(JS) resources use code to style a <div> element. In-
consistencies between loadEventEnd and SpeedIn-
dex results can indicate that a resource was fast to load
but slow to have visual impact.
Most of our graphs show loadEventEnd on the
y-axis. Individual data points are aggregates of 10 to
100 page loads. Each experiment was run at least five
times. Unexpected datapoints and anomalies across
all runs were further confirmed by manually checking
the collected output of individual page loads (e.g.,
screenshots/videos, .har files, waterfall charts). The
line plots show the median values under Good net-
work conditions. The box plots show the median as a
horizontal bar and the average as a black square dot,
along with the 25th and 75th percentiles and min and
max values as the whiskers. Some box plots use a log-
arithmic scale on the y-axis to allow for large values.
4
https://github.com/akamai/cell-emulation-util
4.1 Concatenation
h1 Is slow in loading a large amount of files at the
same time because it can only fetch a single resource
at a time per connection and the browser often
limits h1 to six parallel connections per hostname.
This means requests can be stalled, waiting for the
completion of previously issued requests. The best
practice of concatenation helps by merging multiple
sub-resources together into a single, larger file.
This lowers the number of individual requests but
at the expense of reduced cacheability: if a single
sub-resource is updated, the whole concatenated
file needs to be re-fetched as well. Note that image
concatenation requires additional CSS code as well,
to display only one specific area of the bigger image
at every smaller image location. Because h2 can
multiplex many requests per connection, this opti-
mization should not be needed, and we can request
many small files and keep fine-grained cacheability.
4.1.1 Concatenation for Images (Spriting)
We observe three experiments: (a) a large number
(i.e., 380) of small files, (b) a medium number (i.e.,
42) of medium sized files and (c) a medium number
(i.e., 30) of large files. In Figure 2 we compare the
concatenated versions of the images (left) to loading
individual files (right).
For Figure 2(a) we observe that h2 significantly
outperforms h1 when there is no concatenation, but
that a single spritesheet largely reduces h2’s benefit
and brings it somewhat on a par with h1. This is ex-
pected as h1 is limited to requesting six images in par-
allel and keep the others waiting, while the single h2
connection can efficiently multiplex the many small
files. It is of note that the concatenated version is two
to five times faster, even though (in a rare compres-
sion fluke) its file size is much higher than the sum of
the individual file sizes.
Figure 2(b) shows relatively little differences and
no clear consistent winners between the concatenated
and separate files. This is expected for h2, as in both
cases it sends the same amount of data over the same
connection, but not for h1. We would expect the six
parallel connections to have more impact, but it seems
they can actually hinder on good network conditions.
This is probably because of the limited bandwidth in
our emulated network, where the six connections con-
tend with each other, while a single connection can
consume the full bandwidth by itself. Comparing this
to (a), we see that here h2 does not get significantly
faster for the concatenated version. This indicates that
the higher measurements in (a)(right) are in large part
WEBIST 2017 - 13th International Conference on Web Information Systems and Technologies
164
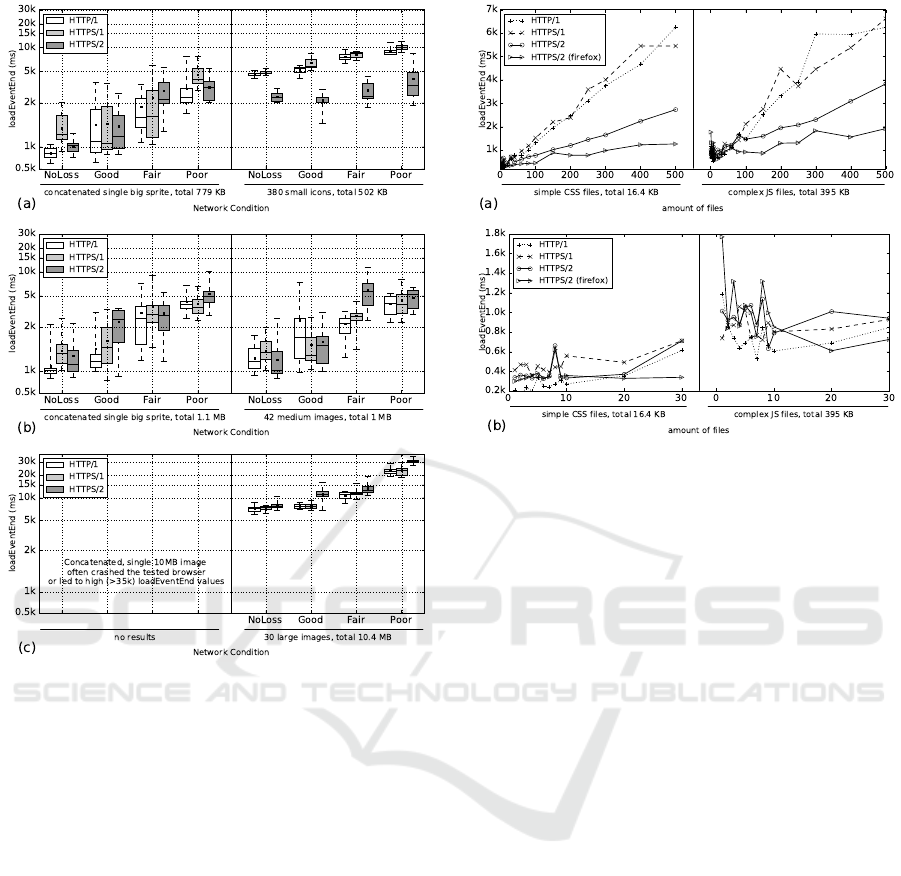
Figure 2: Synthetic test cases for image concatenation. h2
performs well for many small files but deteriorates for less
or larger files.
due to the overhead of handling the many individual
requests.
Lastly, in Figure 2(c) we see that h2 struggles to
keep up with h1 for the larger files and performs sig-
nificantly worse under bad network conditions (note
the y-axis’ log scale). Due to the much larger amount
of data, the six parallel connections do help here,
packet loss impacts the single h2 connection more.
The SpeedIndex measurements (not included
here) show very similar trends.
4.1.2 Concatenation for CSS and JavaScript
We observe two experiments: 500 <div>-elements
are styled using simple CSS files (single CSS rule
per <div>) (left) and complex JS files (multiple state-
ments per <div>) (right). We split the code over mul-
tiple files, from one file (full concatenation) to 500
files (no concatenation). Figure 3 shows full results in
(a) and shows more detail for one to 30 files in (b).
The big-picture trends in (a) look very similar to
Figure 2(a): h2 again clearly outperforms h1 as the
Figure 3: Synthetic test cases for CSS/JS concatenation. h2
performs well for many files but there is no clear winner for
the more concatenated cases.
number of files rises and shows a much better pro-
gression towards larger file quantities than the quasi
linear growth of h1. Interesting is also the perfor-
mance of Firefox: while its h1 results (not shown in
Figure 3) look almost identical to Chrome, the h2 val-
ues are much lower, indicating that it has a more ef-
ficient implementation that scales better to numerous
files.
Looking at the zoomed-in data in (b), we do
see somewhat different patterns. For the simple
CSS files the trends are relatively stable, with h1c
outperforming h2 and h2 beating h1s. This changes
at about 30-40 files, where h2 finally takes the lead.
For the more complex JS files (right), this tipping
point comes much later around 100 files. The mea-
surements for one to ten JS files are also much more
irregular when compared to CSS. Because h1 shows
the same incongruous data as h2, we can assume this
is due to how the browser handles the computation of
the larger incoming files. A multithreaded or other-
wise optimized handling of multiple files can depend
on how many files are being handled at the same time.
This would also explain the very high measurements
of a single JS file in Firefox (consistent over multiple
runs of the experiment). In additional tests, smaller
JS files and larger CSS files also showed much more
stable trends, indicating that especially large JS files
incur a large computational overhead. Note as well
that the timings for a smaller amount of JS files are
sometimes higher than those for the larger amounts,
indicating that concatenation might not always be
optimal here (for none of the protocols).
Concatenation, Embedding and Sharding: Do HTTP/1 Performance Best Practices Make Sense in HTTP/2?
165
Poor network conditions (not shown here) indicate
similar trends to Good networks, but the h2 tipping
points are later: 40-50 files for simple CSS, 150 for
complex JS.
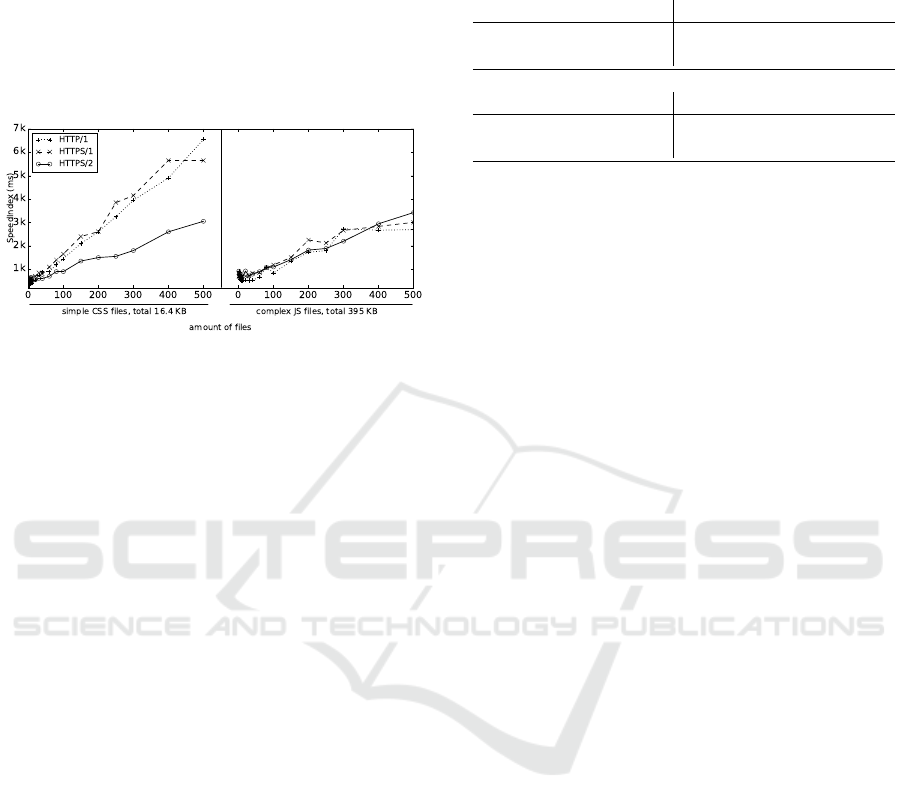
4.1.3 Concatenation for CSS and JavaScript
with SpeedIndex
Figure 4: Synthetic test cases for CSS/JS concatenation
(SpeedIndex). h2 SpeedIndex for JavaScript indicates that
it is much slower to start rendering than h1.
For the tests in the previous section, the SpeedIndex
results were significantly different and merit separate
discussion. Figure 4 shows the same experiment but
depicts SpeedIndex for Google Chrome. We notice
that the data for the simple CSS files (left) looks very
similar to Figure 3, but the results for the complex
JS files (right) do not. Since the SpeedIndex metric
gives an indication of how progressively a page ren-
ders (Section 3) and because we know from Figure
3 that h1 takes much longer than h2 to load large
amounts of files, we can only conclude that under h2
the JS files take much longer to have an effect on the
page rendering, to skew the SpeedIndex in this way.
We manually checked this assumption using
screenshots and found that for h1 the JS was indeed
progressively executed as soon as a file was down-
loaded, but with h2 the JS took effect in “chunks”: in
larger groups of 50 to 300 files at a time and mostly to-
wards the end of the page load. We first assumed this
was because of erroneous multiplexing: if all the files
are given the same priority and weight, their data will
be interleaved, delaying all files. Captures of h2 frame
data however showed each file i was requested as de-
pendent on file i - 1, ensuring that files were fully
delivered in request order. We can once more only
conclude that the browser implementation somehow
delays the processing of the files, either because of
their JS complexity or because the handling of many
concurrent h2 streams is not optimized yet. This argu-
ment is supported by the SpeedIndex results for Fire-
fox (not shown here), as its h2 values are much lower
than those of h1, indicating that Firefox has a more
efficient implementation.
Table 3: Observed browser render-blocking behavior.
Chrome blocks on too much, while Firefox doesn’t seem
to block on anything.
Expected <head> Chrome <head> Firefox <head>
CSS blocking blocking progressive
JavaScript blocking progressive progressive
Expected bottom Chrome bottom Firefox bottom
CSS progressive blocking progressive
JavaScript progressive progressive progressive
This does not explain why the h1 SpeedIndex re-
sults for the simple CSS files are so different com-
pared to those of JavaScript: if they would also be ap-
plied individually as soon as they were downloaded,
the h1 SpeedIndex values would be much lower.
Manual investigation revealed that the browser waits
for all the CSS files to be downloaded before applying
them all at once for both h1 and h2. While there does
exist the concept of “render-blocking” CSS (and JS),
where this behavior is actually wanted for all files in
the <head> of a page, we purposefully hoped to avoid
this issue by loading the CSS and JS files on the bot-
tom of the HTML document. It seems Chrome always
fully blocks rendering on all CSS files included any-
where in the page, making SpeedIndex indeed almost
completely identical to loadEventEnd. Comparison
with Firefox shows different conventions: here even
CSS files that should be render-blocking (i.e., in the
<head>) were just applied progressively instead. Ta-
ble 3 shows the observed behaviors from our synthetic
tests and highlights where we would expect different
implementations. We leave a deeper investigation into
the reasons for this behavior and how well it general-
izes to other cases for future work. Note that progres-
sive for h2 still means the files are applied in larger
chunks instead of individually.
4.2 Embedding and HTTP/2 Push
When loading a web page, the browser first requests
the HTML file and only discovers it needs additional
CSS/JS files when parsing the HTML. It then waits
for any render-blocking files (see Section 4.1.3) to
be fully downloaded before starting to render the
HTML. This means a minimum of two round-trip
times (RTTs) between the initial HTML request and
“first paint”. It is however also possible to embed (or
“inline”) CSS and JS code directly in the HTML doc-
ument (e.g., through <style> and <script> tags).
That way, the code is received after one RTT and ren-
dering can start sooner. The main downside is that the
embedded code cannot be cached separately.
The HTTP/2 specification also recognizes the
WEBIST 2017 - 13th International Conference on Web Information Systems and Technologies
166

need to eliminate this second RTT and includes a
mechanism called h2 (Server) Push (Belshe et al.,
2015). The server can send along additional files with
the first HTML response (or indeed, any response)
without having to embed their contents in the HTML,
allowing the files to be cached. Unlike embedding,
Push can also properly handle binary resources (e.g.,
images, fonts). As such, Push should be a drop-in re-
placement for embedding.
However, while this all works well theoretically,
in practice these approaches are hindered by TCP’s
“slow start” congestion control algorithm. TCP sends
only a small amount of data at the start of the con-
nection and then exponentially ramps up its speed if
no packet loss or delays are present. In practice, the
TCP data window at the start is about 14 KB for mod-
ern Linux kernels (used in our experiments) (Marx,
2016). Thus if the HTML file (including the embed-
ded CSS/JS) is larger than 14 KB, the remainder has
to wait for the second “send burst”, arriving only af-
ter two RTTs. The best practice is thus to embed only
a limited amount of so-called “critical CSS” that ren-
ders a good first impression of the page (e.g., general
layout, building blocks, background colors) and load
the other CSS using <link> references. Push has a
similar problem: if the HTML fills up the initial 14
KB, push will have no benefit (Bergan et al., 2016).
Rather than create our own test case we use the
existing Push demo by Bradley Fazon
5
. This case
uses the www.eff.org frontpage as the reference point
which we manually adjust to include the discussed
optimizations. This page has a single “critical CSS”
file and a good mix of additional CSS, JS and image
files without being too complex. We verify our ob-
servations using other synthetic test cases. We show
the results from tests using the Apache webserver be-
cause NGINX does not yet support h2 Push. We show
the SpeedIndex results because these should be most
affected.
4.2.1 Embedding
In Figure 5 we observe a single experiment: we em-
bed the “critical CSS“ file in the <head> and move
the other CSS <link> and JS <script> URLs to the
bottom of the page, so they should not be render-
blocking. We compare this optimization (left) to the
original page (right).
As we can see, embedding seems only to lead to
very limited SpeedIndex gains. This is unexpected,
since manual confirmation of the results clearly shows
that the embedded CSS does take effect early in the
page and that it is not limited by the render-blocking
5
https://github.com/bradleyfalzon/h2push-demo
Figure 5: Realistic test case for embedding. The technique
has a low impact and is similar across protocols.
behavior of Chrome (see Section 4.1.3). This reduced
impact on SpeedIndex has two reasons:
Firstly, the embedded CSS content is larger than
the 14 KB TCP first transmission limit. Consequently
the bottom portion of the HTML containing the
remaining CSS/JS files is now only received after
the second RTT. Since the browser needs to parse
the HTML to discover these additional dependencies
and issue requests for them, the fetching of the other
files is delayed, which in turn postpones the total
page load and render. This explains why we often
see higher loadEventEnd values for pages that use
embedding, even if the SpeedIndex drops.
Secondly, this optimization will primarily work
well when the network is the bottleneck and not the
CPU speed of the device. As parsing CSS and ren-
dering both cost CPU resources, fast devices are more
likely to have more CPU idle time available for partial
rendering in between receiving the CSS data, while
slow devices will have no such budget and spend all
their time parsing CSS; the observed end result is sim-
ilar to the normal render-blocking behavior. We can
somewhat see the higher impact on slower networks
in Figure 5 and a little more clearly in Figure 6.
We can conclude that embedding is more of a
micro-optimization and that it requires careful fine-
tuning to lead to good results.
4.2.2 HTTP/2 Push
With h2 Push, the HTML is always fully sent before
the pushed data. As such, we need to make sure the
HTML code is smaller than 14 KB so the window
can also include the pushed CSS (Bergan et al., 2016)
(note that this also means Push does not suffer from
the “late resource discovery” problem seen when em-
bedding). We manually remove some metadata from
the eff.org HTML and enable gzip compression, re-
ducing the on-network HTML size from 42 KB to 9
KB.
In Figure 6 we observe six different experiments
based on the adjusted eff.org test case: (1) embed a
Concatenation, Embedding and Sharding: Do HTTP/1 Performance Best Practices Make Sense in HTTP/2?
167

Figure 6: Realistic test case for HTTP/2 Push. Pushing is
similar to embedding. Pushing the wrong assets or in the
wrong order can deteriorate performance.
single CSS file (no push, similar to Section 4.2.1), (2)
push the single CSS file, (3) push all the CSS/JS files
(10 files), (4) push all (images + CSS/JS + one font),
(5) push all images (18 files) and (6) the reference
measurement (original, similar to Section 4.2.1). We
see that pushing the “critical CSS” file is indeed very
similar to embedding it. It is unexpected however that
pushing all CSS/JS performs a little better than just
the “critical CSS” in the Good network condition. We
found that in practice the initial data window is often
a bit larger than 14 KB, so it can accommodate more
than just the single CSS file. However, this is not al-
ways the case and other runs of the same experiment
show less optimal results (which can also be seen
in the Poor network condition in Figure 6 (right)).
Given a larger data window, the “Push all” test case
should perform similarly, but it is consistently a bit
higher. It turned out that we pushed the single font
file at the very end, after all the images. The font
data should have been given a higher h2 priority than
the images, but due to a recently discovered Apache
bug
6
this was not the case and the font data had to
wait, delaying the final page load and render. This
also explains why pushing just the images performs
worse than the reference: the much more important
CSS and JS is delayed behind the image data.
These experiments clearly show that, similarly to
embedding, Push is hard to fine-tune and limited in
the benefit it can deliver. We had to make several
manual changes to the original website to get any
measurable benefit at all, at least in the context of
the initial page load and pushing along with the first
HTML request.
However, the true power of Push might be that it
can also send data along with non-HTML files. In a
separate synthetic experiment we used JavaScript to
fetch a .json file that contains a list of image URLs to
then add them to the page as <img> elements. This
emulates how a REST API can be used in typical
modern “Single Page App” frameworks. We make
6
https://icing.github.io/mod h2/nimble.html
sure the initial HTML is large to “warm up” the TCP
connection (Bergan et al., 2016). Along with the .json
response, the server then also Pushes the images that
are referenced within. This did considerably speed
up the rendering process, especially on bad networks.
This illustrates that Push can have many other appli-
cations than just as a replacement for embedding dur-
ing the initial page load.
4.3 Sharding
Browsers set a maximum of six parallel connections
per hostname but this is not enough for loading large
amounts of files and thus modern, complex websites
over h1 (see Section 4.1). Browsers however also ob-
serve a higher total limit of 17 to 60 open connec-
tions
7
and so it has become common practice to dis-
tribute files over multiple hostnames/servers (called
sharding), since each can have its own group of six
connections. This can for example be done using
Content Delivery Networks (CDNs) to host “static”
content. The main downside of sharding is the in-
creased overhead: the setup becomes more complex
and additional connections require extra computa-
tional resources and hardware.
On the other side, h2 wants to make optimal use
of just a single connection and actively discourages
parallel channels. The h2 specification even includes
a mechanism for coalescing requested HTTP connec-
tions to separate hostnames onto a single TCP con-
nection if the hosts use the same HTTPS certificate
and resolve to the same IP address (Belshe et al.,
2015). h2 Push can also only be used for resources
on the same domain.
4.3.1 Sharding for Images
We observe three experiments, identical to the uncon-
catenated setup in Section 4.1.1: (a) 380 small files,
(b) 42 medium sized files and (c) 30 large files. Fig-
ure 7 compares a sharded version over four hostnames
(left) with the unsharded version (right). In practice,
over h1 the browser will open the maximum amount
of connections (24, six per hostname) and a single
connection per hostname for h2 (four in our case).
The observed trends are similar for CSS/JS files.
Firstly, in Figure 7 (a) we observe that sharding
deteriorates h2 performance, while only marginally
benefiting h1. Because the files are that small, h2’s
multiplexing was at its best in the single host case and
maximized the single connection’s throughput, while
it now has less data to multiplex per connection.
7
http://www.browserscope.org/
WEBIST 2017 - 13th International Conference on Web Information Systems and Technologies
168
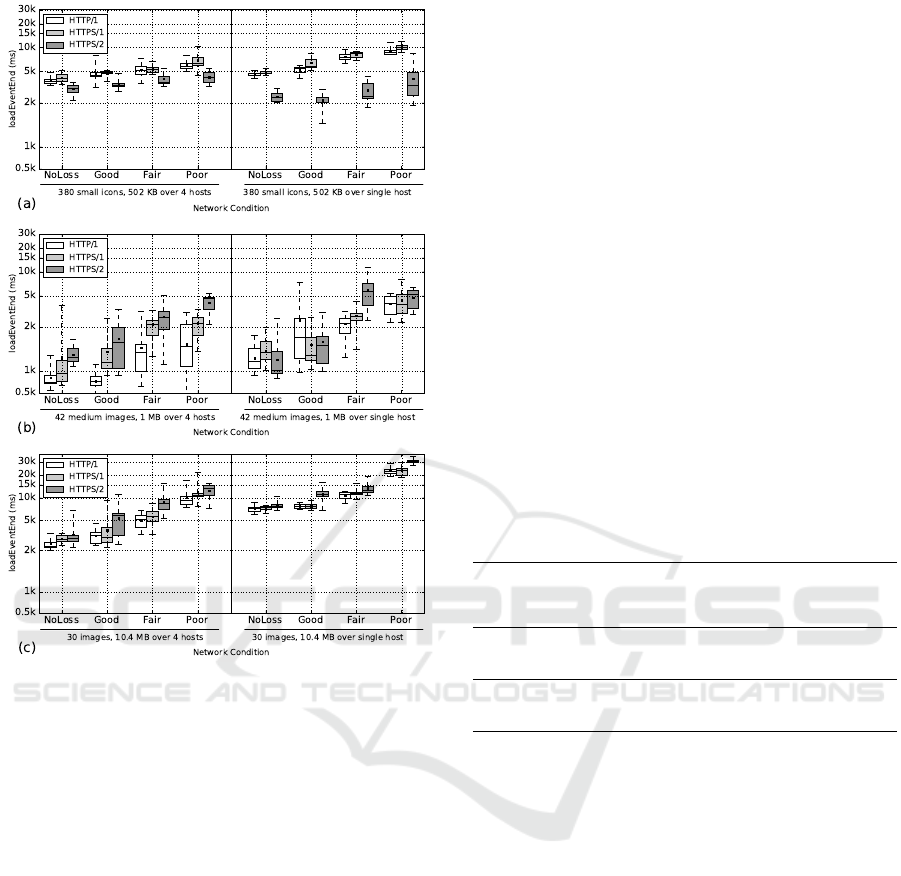
Figure 7: Synthetic test cases for image sharding. h2 ben-
efits for larger files but deteriorates for many smaller files.
h1 always improves.
Conversely, h1 now has more connections but still
suffers from HOL blocking on the small files.
In contrast, (b) shows inconsistent behavior when
sharding: sometimes it helps and sometimes it hurts
h2; it shows good benefits for h1c but less impressive
improvements for h1s. We posit that the additional
overhead of setting up secured HTTPS connections
(both for h1s and h2s) limits the effectiveness of the
higher parallel throughput.
Lastly, (c) clearly shows why sharding is consid-
ered an h1 best practice: it can improve performance
by over 50%, especially in bad network conditions.
h2 also profits significantly from the multi-host setup.
For these larger files, multiple connections provide
the much-needed higher throughput. They also help
mitigate HOL blocking for h1 and lessen the impact
of loss when compared to a single h2 connection.
Overall we observe similar results to those of Goel
et al. (Goel et al., 2016): for many, smaller objects,
sharding can hurt h2 performance, but not consider-
ably. For medium-sized websites, sharding usually
helps but not always substantially. The optimization
has the most impact on websites with large objects,
for both protocols. We also performed experiments
with two and three hosts and found that if sharding
helps for h2, sharding over more hosts helps more,
but there are diminishing returns with each increase
in the amount of hosts.
Additionally, h2 has another important feature
that is impacted heavily by sharding: HPACK header
compression (Belshe et al., 2015). HTTP headers
often contain duplicate information and can be effi-
ciently compressed. Because HPACK partly uses a
shared compression dictionary per connection that is
built up at runtime, we see its effectiveness decrease
in the case of sharding, as the algorithm has less data
to learn from/to re-use. Table 4 shows how the total
bytes sent by Google Chrome (composed mainly of
HTTP headers) is different with and without sharding.
h2s clearly outperforms h1s, but sharding leads to a
decrease of its effectiveness by 25% to 50%. Note
that h1 does not employ any header compression.
Table 4: Total bytes sent by Google Chrome (∼ HTTP
headers) and ratio to total page size. For many small files,
the HTTP header overhead is significant.
File
count
Protocol
1 host
BytesOut
4 hosts
BytesOut
Total
page size
4 hosts
% of total
page size
42 files h2s 649 1362 1075000 0.1%
h1s 2786 3346 1075000 0.3%
400 files h2s 29580 38680 610000 6%
h1s 165300 177600 610000 19%
5 INTERPRETING RESULTS
FROM REALISTIC WEBSITES
Synthetic test cases are useful to assess individual
techniques in isolation but they are often not very rep-
resentative for real websites. We now look at some
more realistic test cases. Our goal here is not to come
to definitive conclusions about h2 or h1 performance
but rather to show the difficulties involved in inter-
preting measurements.
We present results for nine different websites (1:
barco.com, 2: bbc.com, 3: demo.cards, 4: deredac-
tie.be, 5: hbvl.be, 6: healthcare.gov, 7: standaard.be,
8: uhasselt.be, 9: yappa.be). To make them easier to
compare to the clearest trends in the synthetic exper-
iments (Section 4.1.1), we select image-heavy web-
sites in two categories: (A) media/news sites with typ-
ically large HTML content and many smaller images
(nr. 2, 4, 5 and 7) and (B) company/product land-
ing pages with “hero image(s)”(large images taking
Concatenation, Embedding and Sharding: Do HTTP/1 Performance Best Practices Make Sense in HTTP/2?
169
up most of the “above the fold” space) (nr. 1, 3, 6, 8
and 9). These websites present a good mix: we have
both optimized (using concatenation and embedding)
and unoptimized pages, complex and relatively sim-
ple sites. For more details we refer to our website.
We simulate what would happen if a developer
would switch their h1 site to h2 by naively moving
all their own assets over to a single server (disabling
sharding) but still downloading some external assets
from third party servers (e.g., Google analytics, some
JS libraries). This approach is similar to (Wang et al.,
2014). We download the websites to our local web-
server using a custom wget tool that rewrites the main
assets to a single hostname, and serve them using
Speeder.
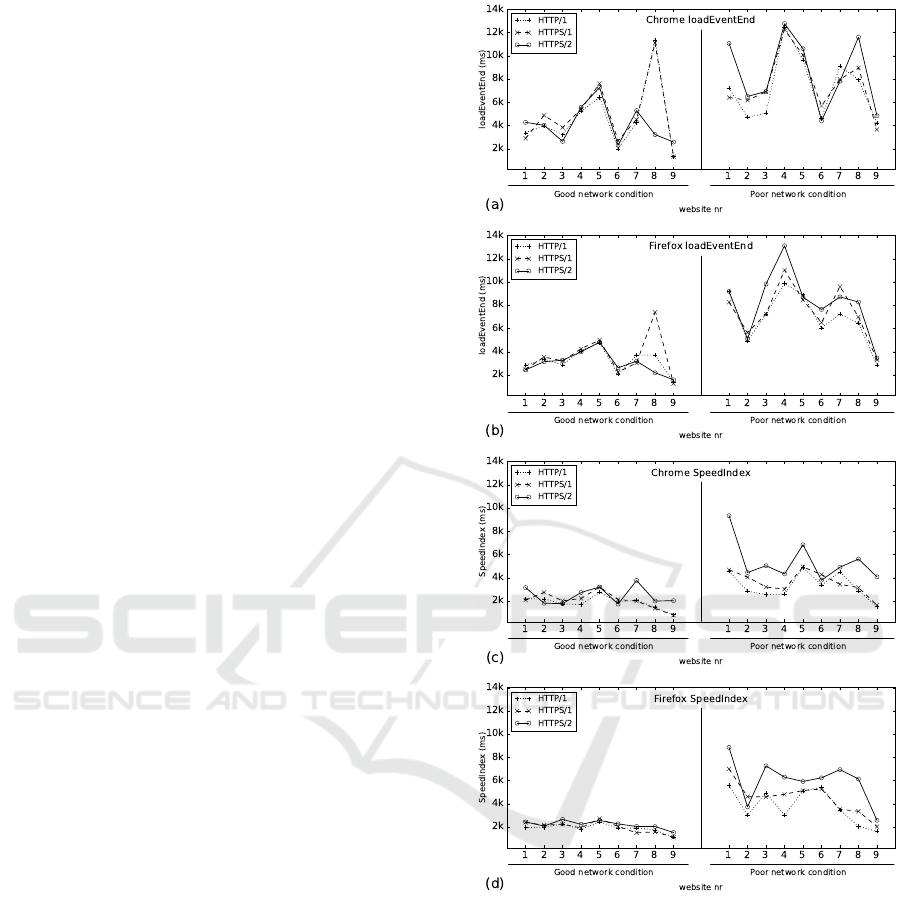
5.1 Results
In figure 8 we show the median loadEventEnd and
SpeedIndex measurements for the nine websites over
Good and Poor networks, loaded in Chrome and
Firefox. Globally, we can state that loadEventEnd
and SpeedIndex are often similar for the Good net-
work, indicating that our sites are mostly network-
dependent, as the rendering waits for assets to come
in. Poor network conditions can have a very large im-
pact. In various cases h2’s SpeedIndex is far above
that of h1 even if their loadEventEnd values are simi-
lar, indicating that h2 is slower to start rendering, con-
sistent with our observations in Section 4.1.3. h1c is
faster than h2 in almost all of the cases and h2 is al-
most never much faster than h1s. Note that this is
against our expectations, as h1 has to make due with-
out the benefits of sharding.
We now highlight how important it is to compare
different metrics and setups by looking more closely
at a few of the individual sites. For example, if we
were developing site 8 and we would only look at Fig-
ure 8 (a) and (b), we might conclude that h2 can give a
huge speedup on Good networks, which is then possi-
bly reversed on Poor networks. However, comparing
this to Figure 8 (c) and (d) shows that the SpeedIn-
dex values do not exhibit these anomalies. We indeed
found that one of the externally loaded (non render-
blocking) JavaScript files sometimes took a very long
time to download and replaced it with a locally hosted
version. This completely removed the anomalies for
the Good network, but did not significantly affect the
trends for the Poor network. As it turned out, the bot-
tleneck was in downloading the site’s many large as-
sets. As the network experienced more loss and less
bandwidth, the h2 connection suffered and the lim-
ited number of six parallel h1 connections also could
no longer keep up. Not comparing loadEventEnd
Figure 8: Nine realistic websites on dynamic Good and dy-
namic Poor network models. There is very similar per-
formance under Good network conditions, but h2 clearly
suffers from Poor conditions.
to SpeedIndex, or Poor to Good networks might have
led us to miss this issue and possibly draw the wrong
conclusions for this datapoint.
As developers of site 6 we would be quite happy,
since this is one of the faster websites with very little
difference between h1 and h2 for the Good network
and inconsistent but similar results on the Poor net-
work. Looking more closely we however noticed that
the very large hero image was taking up more than
half of the total load time. The image URL was in-
cluded halfway down the HTML page, behind CSS/JS
WEBIST 2017 - 13th International Conference on Web Information Systems and Technologies
170

files and other images. By the time the browser dis-
covered this resource, the six parallel h1 connections
were already taken and because browsers currently
assign the same h2 priority to all images, the hero
image had to wait behind the other images. Simply
concatenating some of the JS files ensured that there
was an h1 connection available by the time the hero
image was discovered and the SpeedIndex value was
cut in half for h1. However h2 was still just naively
prioritizing the hero image behind the other assets.
Moving the hero image URL to before the other im-
ages was the solution. Sharding the hero image to
a different hostname would likely have had a simi-
lar impact. This problem was not evident from the
presented graphs, only from looking at the waterfall
charts. Even when comparing many different test se-
tups, some problems will still remain hidden.
6 DISCUSSION
Conceptually, the ideal h2 setup will use a single TCP
connection to multiplex a large amount of small and
individually cacheable site resources. This alleviates
the h1 application-layer HOL blocking and helps to
reduce the overhead of many parallel connections,
while also maximizing the efficiency of the underly-
ing TCP protocol. Together with advanced resource
priorities and h2 Push this can lead to (much) faster
load times than are possible today over h1, with much
less overhead.
However, as our experiments have shown, this
ideal setup is not yet viable. While h2 is indeed faster
than h1, when loading many files (see Figures 2 and
3), it is still often slower than loading concatenated
versions of those files (see Section 4.1). Looking
at the SpeedIndex values (see Figures 4 and 8) also
shows that h2 is frequently later to start rendering the
page than h1. h2 also struggles when downloading
large files (see Figures 2 and 7) and can quickly dete-
riorate when used in bad network conditions. In our
observations, h2 is in most cases currently either a lit-
tle slower than or on a par with h1 and shows both the
most improvement and worst deterioration in more
extreme circumstances.
The good news is that almost all of the encoun-
tered problems limiting h2’s performance are due
to inefficient implementations in the used server
and browser software. Firstly, while loading many
smaller files incurs its own considerable overhead,
comparing Chrome and Firefox in Figure 3 we can
see that this overhead can be limited extensively,
lessening the need for concatenation (though possibly
never completely removing it). Secondly, the fact
that h2 is later to start rendering than h1 is also due to
ineffective processing of the h2 data, since we have
confirmed that resources are received well on-time
to enable faster first paints, see Section 4.1.3. It is
also interesting to note that Firefox seems to have
especially optimized its pipeline for large amounts of
files, since it outshines Chrome for synthetic pages in
Figure 3 but falls behind for more realistic content in
Figure 8. Thirdly, cases in which h2 underperformed
while using h2 Push in Section 4.2.2 or loading
realistic sites in Section 5.1, could be attributed to the
server implementation not correctly (re-)prioritizing
individual assets. As these implementations mature,
we can expect many of these issues to be resolved.
However, h2 still retains some core limitations,
mostly due to its single underlying TCP connection,
which seems to simultaneously be its greatest strength
and weakness. TCP’s congestion control algorithms
can lead it to suffer significantly from packet loss
on poor networks (most obvious when downloading
multiple large files, see Figures 2 and 7) and can
heavily impact the effectiveness of h2 and resource
embedding on newly established connections (see
Section 4.2). We have to nuance these statements
however, as in practice h2 actually performs quite
admirably and usually does not suffer more from bad
networks than h1, despite using fewer connections.
Recognizing that these underlying h2 perfor-
mance problems stem primarily from the use of
TCP, in the new QUIC protocol (Carlucci et al.,
2015) Google and its partners implement their own
application-layer reliability and congestion control
logic on top of UDP. They remove the transport-layer
HOL blocking by allowing out-of-order delivery of
packets, differently handle re-transmits in the case
of loss, reduce the amount of round-trips needed to
establish a new connection and allow larger initial
data transmissions. Running h2 on top of QUIC can
greatly benefit h2’s multiplexing setup.
Until the h2 implementations mature and/or the
QUIC protocol is finalized however, fully switching
to the ideal h2 approach could severely reduce the ob-
served performance, especially when looking at the
SpeedIndex measurements for poor networks in Sec-
tion 5.1. Luckily, the discussed h1 best practices (re-
source concatenation, resource embedding and host-
name sharding) have a similar impact on both h1 and
h2 in non-extreme cases (see Section 4). This means
that most sites that are currently optimized for h1 can
quickly and safely transition to h2 (or offer users both
protocols in tandem) with a minimum of changes and
without suffering large performance penalties. More
work may however be needed for sites who’s users are
mostly on bad networks or sites that are using the un-
Concatenation, Embedding and Sharding: Do HTTP/1 Performance Best Practices Make Sense in HTTP/2?
171

encrypted h1c, which is almost always faster than h2.
The new h2 Push mechanism looks especially promis-
ing on “warm” TCP connections but seems difficult
to fine-tune when pushing files along with the initial
HTML file (see Section 4.2.2).
Finally, using the Speeder framework to run our
experiments on a large number of emulated test setup
permutations has shown to be a useful approach.
Many implementation inefficiencies were discovered
by comparing different metrics, browsers and network
conditions and looking for inconsistencies. Analyz-
ing and comparing both synthetic and realistic test
data was also effective, with the more realistic results
indeed somewhat dampening the more extreme syn-
thetic results but largely showing similar trends. Fur-
thermore, the two concrete website examples in Sec-
tion 5.1 show that individual datapoints can have sub-
tle underlying reasons for their observed values, some
having little to do with the underlying protocol or im-
plementations but originating in the HTML structure
itself. They also show that even a deep comparison
of different setups is not always enough to find im-
portant problems and that tools should also support
manual confirmation of results through a variety of
visualizations. We can conclude that the Speeder
framework is a versatile platform usable not only by
researchers but also developers to assess both global
trends for comparisons, and local optimizations for
individual websites.
7 CONCLUSION
In this work we have used the Speeder framework to
run experiments for both synthetic and realistic test
cases over a variety of different setups, allowing us
to compare h2s to h1s and h1c, Chrome to Firefox,
loadEventEnd to SpeedIndex and good to bad net-
work conditions.
Our results have shown that most of the cases in
which h2 currently underperforms are caused by un-
optimized implementations and that most of the real
inherent h2 problems are caused by the use of a sin-
gle underlying TCP connection. This can lead h2 per-
formance to deteriorate on poor networks with high
packet loss, but in practice we have seen that the dif-
ference with h1 under these conditions is usually not
that large. Globally speaking, we find that h2 is often
on a par with h1s and a little slower than h1c.
We have found that all three discussed h1 best
practices of resource concatenation, resource embed-
ding and hostname sharding perform similarly over
h1 and h2 in non-extreme circumstances. Especially
concatenation and sharding can have a large impact
on performance, while embedding and its h2 Push al-
ternative are observed to be micro-optimizations that
are difficult to fine-tune (at least for the initial page
load). These findings lead us to recommend to devel-
opers that they often do not have to significantly alter
their current setups when deciding to migrate from h1
to h2 or to support both versions in parallel.
We argue that, in time, the envisioned ideal h2
model of using many small, individually cacheable
files over a single, well filled TCP connection will
become viable with improving browser/server imple-
mentations and the QUIC protocol.
We will keep expanding and sharing the Speeder
framework (e.g., with the h2o server, Google Light-
house, sitespeed.io v4), using it to follow browser
implementation changes, as well as more deeply in-
vestigate the possibilities of h2 Push and h2 priorities
in various settings.
ACKNOWLEDGEMENTS
This work is part of the imec ICON PRO-FLOW
project. The project partners are among others Nokia
Bell Labs, Androme, Barco and VRT. Robin Marx is a
SB PhD fellow at FWO, Research Foundation - Flan-
ders, project number 1S02717N. Thanks to messrs
Goel, Wijnants, Michiels, Robyns, Menten, Bonn
´
e
and our anonymous reviewers for their help.
REFERENCES
Belshe, M., Peon, R., and Thomson, M. (2015). Hyper-
text transfer protocol version 2. https://tools.ietf.org/
html/rfc7540. Last visited: 2017-03-01.
Bergan, T., Pelchat, S., and Buettner, M. (2016).
Rules of thumb for http/2 push. https://docs.
google.com/document/d/1K0NykTXBbbbTlv60t5My
JvXjqKGsCVNYHyLEXIx-YMv0. Last visited:
2017-03-01.
Carlucci, G., De Cicco, L., and Mascolo, S. (2015). Http
over udp: an experimental investigation of quic. In
Proceedings of the 30th Annual ACM Symposium on
Applied Computing, pages 609–614. ACM.
Corbel, R., Stephan, E., and Omnes, N. (2016). Http/1.1
pipelining vs http2 in-the-clear: Performance com-
parison. In 2016 13th International Conference on
New Technologies for Distributed Systems (NOTERE),
pages 1–6.
de Oliveira, I. N., Endo, P. T., Melo, W., Sadok, D., and
Kelner, J. (2016). Should i wait or should i push? a
performance analysis of push feature in http/2 connec-
tions. In Proceedings of the 2016 workshop on Foster-
ing Latin-American Research in Data Communication
Networks, pages 7–9. ACM.
WEBIST 2017 - 13th International Conference on Web Information Systems and Technologies
172

de Saxc
´
e, H., Oprescu, I., and Chen, Y. (2015). Is http/2
really faster than http/1.1? In Computer Communica-
tions Workshops (INFOCOM WKSHPS), 2015 IEEE
Conference on, pages 293–299. IEEE.
Erman, J., Gopalakrishnan, V., Jana, R., and Ramakrishnan,
K. K. (2013). Towards a spdy’ier mobile web? In Pro-
ceedings of the Ninth ACM Conference on Emerging
Networking Experiments and Technologies, CoNEXT
’13, pages 303–314, New York, NY, USA. ACM.
Goel, U., Steiner, M., Wittie, M. P., Flack, M., and Ludin,
S. (2016). Http/2 performance in cellular networks:
Poster. In Proceedings of the 22Nd Annual Inter-
national Conference on Mobile Computing and Net-
working, MobiCom ’16, pages 433–434, New York,
NY, USA. ACM.
Gooding, M. and Garza, J. (2016). Real world expe-
riences with http/2. https://www.slideshare.net/
JavierGarza18/real-world-experiences-with-http2-
michaelgooding-javier-garza-from-akamai. Last
visited: 2017-03-01.
Grigorik, I. (2013). High Performance Browser Network-
ing. O’Reilly Media, Inc.
Liu, Y., Ma, Y., Liu, X., and Huang, G. (2016). Can http/2
really help web performance on smartphones? In
Services Computing (SCC), 2016 IEEE International
Conference on, pages 219–226. IEEE.
Marx, R. (2016). Http/2 push : the details. http://
calendar.perfplanet.com/2016/http2-push-the-details/.
Last visited: 2017-03-01.
Meenan, P. (2012). Speed index. https://sites.google.com/
a/webpagetest.org/docs/using-webpagetest/metrics/
speed-index. Last visited: 2017-03-01.
Meenan, P. (2016). Webpagetest. https://webpagetest.org.
Last visited: 2017-03-01.
Netravali, R., Goyal, A., Mickens, J., and Balakrishnan, H.
(2016). Polaris: faster page loads using fine-grained
dependency tracking. In 13th USENIX Symposium
on Networked Systems Design and Implementation
(NSDI 16).
Varvello, M., Schomp, K., Naylor, D., Blackburn, J., Fi-
namore, A., and Papagiannaki, K. (2016). Is the web
http/2 yet? In International Conference on Passive
and Active Network Measurement, pages 218–232.
Springer.
Wang, X. S., Balasubramanian, A., Krishnamurthy, A., and
Wetherall, D. (2014). How speedy is spdy? In NSDI,
pages 387–399.
Wang, Z. (2012). Navigation timing api. https://
www.w3.org/TR/navigation-timing. Last visited:
2017-03-01.
Concatenation, Embedding and Sharding: Do HTTP/1 Performance Best Practices Make Sense in HTTP/2?
173
