
Development of a Vibration Measurement Device based on a MEMS
Accelerometer
Chinedum Anthony Onuorah, Sara Chaychian, Yichuang Sun and Johann Siau
School of Engineering and Technology, University of Hertfordshire, Hatfield, U.K.
Keywords: Vibration Measurement, Accelerometer, System Design.
Abstract: This paper proposes a portable and low cost vibration detection device. Enhanced vibration calculation,
reduction of error and low storage memory are complementary accomplishments of this research. The device
consists of a MEMS capacitive accelerometer sensor and microcontroller unit, which operates based on a
novel algorithm designed to obtained vibration velocity, bypassing the usual time-based integration process.
The proposed algorithm can detect vibrations within 15Hz - 1000Hz frequencies. Vibration in this frequency
range cannot be easily and accurately evaluated with conventional low cost digital sensors. The proposed
technique is assessed and validated by comparing results with an industrial grade vibration meter.
1 INTRODUCTION
Advancement and Development of technology and
smart devices increases the demand for comfort and
safety, especially in transportation, where more
emphasis is placed on ride comfort and safety by
vehicle manufacturers. The ability to measure lower
frequency vibration with high precision can cooperate
in this regard. Human and environmental safety
(Kuntiyawichai and Burdekin, 2003), vehicle comfort
(Barone et al. 2016), engine performance (Dayyani et
al., 2016), road profiling (Abulizi et al., 2016) and
many more, necessitate vibration measurement for
their analysis and evaluations.
Numerous types of vibration sensors are
available, but the most common and advantageous
way of detection is based on accelerometer. They can
sense changes in velocity while oscillating in
particular frequency ranges; although, the orientation
of the sensor in this case is important and must be
considered (Stein et al., 2007). Depending on the
application, different types of accelerometer may be
used, for instance, Piezo-electric accelerometers are
well known for their precise measurement, however,
these are expensive (Jamil et al., 2014). On the other
hand, MEMS (Micro Electromechanical Systems)
accelerometers have better dynamic specification and
due to their small sizes, may be easily integrated in
different environments; however, they present noisy
outputs (Helal et al., 2015).
(Jamil et al., 2014), presents a vibration device based
on an accelerometer, and uses a microcontroller and
computer to visualize the vibration graphically. Their
device measure vibrations below 5KHz with
applications aimed towards medium range vibration
analysis.
This paper presents a low-cost vibration device,
which is based on a novel algorithm. The proposed
system optimizes the evaluation process for velocity
calculation, while using less memory by bypassing
the time-based integration process that requires an
extra buffer to be stored, and prevents potential
integration error, imposed in the computation.
Obtaining velocity and displacement information is
certainly possible by integration and double
integration (respectively) of the acceleration data in
the time domain. However, small DC offsets, or low
frequency signals present in the input samples
(acceleration data), will result in large cumulative
error, post integration.
2 SYSTEM SET UP AND DESIGN
Vibration can be measured as either acceleration
(which is the rate of change of speed in mm/s/s or G),
velocity (the distance moved per time in mm/s), or
displacement (inches or mm) in the x, y, z plane of a
3-dimensional space. The method described in this
paper evaluates vibration in terms of velocity. As
Onuorah, C., Chaychian, S., Sun, Y. and Siau, J.
Development of a Vibration Measurement Device based on a MEMS Accelerometer .
DOI: 10.5220/0006340902930299
In Proceedings of the 3rd International Conference on Vehicle Technology and Intelligent Transport Systems (VEHITS 2017), pages 293-299
ISBN: 978-989-758-242-4
Copyright © 2017 by SCITEPRESS – Science and Technology Publications, Lda. All rights reserved
293
shown in equations (1) and (2), there is a relationship
between acceleration, velocity and displacement,
although, velocity has the most direct relationship
between how much a body is displaced per unit of
time (which is ideal, as the severity of vibration is a
factor of moved distance and frequency of the
movement). Hence, vibration measurement based on
velocity is the most common and preferred method in
monitoring vibration related to mechanical problems
such as unbalance, misalignment, etc.
=+∆
=∆+
1
2
(
∆
)
(1)
(2)
Where is velocity, is previous velocity, is
acceleration, and ∆ is the change in time.
The device developed for this research consists of
a MEMS accelerometer (ADXL345) and a
Microcontroller Unit (MCU)
(dspic33EP256MC202), where the MCU is used to
sample and process acceleration data at a rate
dependent on the expected maximum vibration
frequency. Considering the ADXL345 has a
maximum sampling rate of 3200Hz, the theoretical
maximum frequency for vibration that can be
measured is 1600Hz, which is determined based on
Nyquist theorem in Equation (3). For this experiment,
the frequency range is between 15 – 100 Hz, therefore
the minimum sampling rate must be 200Hz.
≥2
(3
)
Where
is frequency of sampling and
is the
maximum frequency level for detection.
Note that the frequency range considered for this
experiment is not due to a limitation in the method
described, but on the memory constraints of the
selected MCU. The amount of memory required to
perform a Fast Fourier Transform (FFT) analysis on
the signal is a factor of the measurement sampling
rate, and the number of samples required.
The industrial grade vibration meter (HS-620)
manufactured by Hansford Sensors was used to verify
all test results in this experiment.
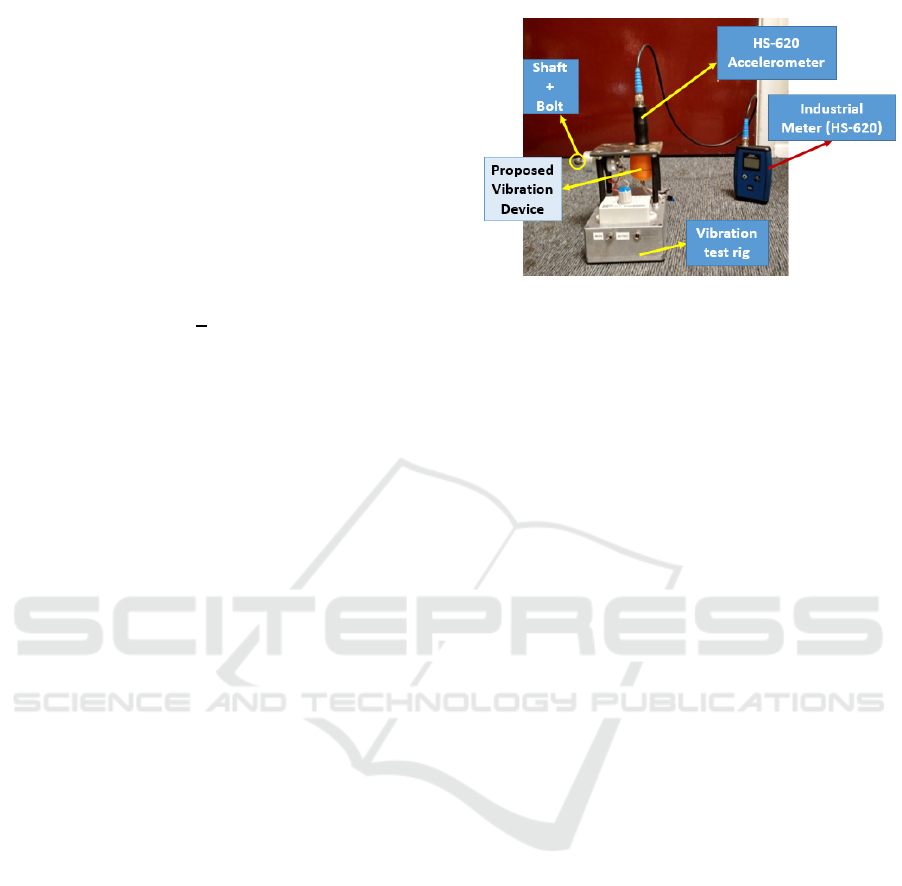
Figure 1 displays the setup used to verify the
results of this experiment. The image shows the HS-
620 vibration meter, the custom MEMS meter
(designed for this research) and vibration test rig
developed to simulate various vibration levels.
Figure 1: Experiment setup.
The test rig is battery operated (12v input) which
consists of a DC motor (to generate the vibration) and
a potentiometer (to vary the speed of the motor,
increasing the frequency and magnitude of vibration).
The motor is fitted to a metal plate, which is
connected to the base of the unit using rubber stands
(allowing pronounced vibration magnitudes to be
sensed on the plate). To vary the intensity of vibration
at specific frequencies, bolts of different sizes and
weights were connected to the shaft of the motor,
which creates the force needed to generate the
required vibration level.
The HS-620 and MEMS meter were mounted at
the same point, on opposite sides of the plate to ensure
the sensed vibration is consistent. The results
obtained during the tests confirms that this
configuration lets both meters receive similar
vibration levels, allowing accurate verification. Other
configurations, like, mounting both meters side by
side, on different areas of the plate, resulted in false
data, since the vibration sensed across the plate is
uneven. It is also important to ensure there are no
moving parts in the MEMS unit during measurement,
as this will reflect false vibrations. The experimental
unit was potted with epoxy to guarantee this.
3 IMPLEMENTATION
Common practice integrates the acceleration samples,
deriving a velocity waveform. This waveform is then
passed through number of filters to minimize the
effect of the error obtained from the integration
process, before any vibration analysis is carried out.
The method described in this paper attempts to
improve the accuracy of MEMS based vibration
systems, by bypasses the effect of integration error on
the results, calculating the velocity of the signal
directly from the acceleration’s frequency domain.
VEHITS 2017 - 3rd International Conference on Vehicle Technology and Intelligent Transport Systems
294
This process obtains the acceleration samples
from the sensor, performs an FFT analysis on the
acceleration, and evaluates the velocity based on this
analysis.
3.1 Acceleration Measurement
The first step is obtaining the samples from the
accelerometer. A common source of error is having
uneven period between each sample. It is vital to
ensure consistency in the time difference between
each sample that make up the signal to be processed,
because irregularities will result in false frequency
domain representations. For example, using Equation
(4), for a sampling rate of 250Hz, the period between
each sample is expected to be 4ms. The aim here is to
measure vibration irrespective of the orientation of
the accelerometer, to achieve this, each sample from
the x, y, and z plane was consolidated using vector
summation (5), to obtain a single value that
represents the acceleration in a 3-dimensional space.
=
1
=
+
+
(4)
(5)
Where is the frequency of the signal, is the period,
is the acceleration on the x axis, is the
acceleration on the y axis, is the acceleration on the
z axis, and is the equivalent acceleration of all axis.
After obtaining data from the accelerometer, the
next step is to run the acceleration signal through a
band-pass filter (consisting of a high-pass and low-
pass filter). The filter cut-off frequencies are selected
based on the required measurement frequencies as
indicated in equation (6). In this experiment, the
frequency range explored is between 10Hz – 100Hz.
≤
<
≤
(6)
Since MEMS accelerometers are good at detecting
the earth’s gravitational pull, this produces an offset
equivalent to the gravity’s magnitude (approximately
9.81(m/s
2
)) to the axis acting against this force. This
causes the resulting signal to contain a DC offset even
when static, hence the high-pass filter is needed to
eliminate this offset.
3.2 Fast Fourier Transform (FFT)
Analysis
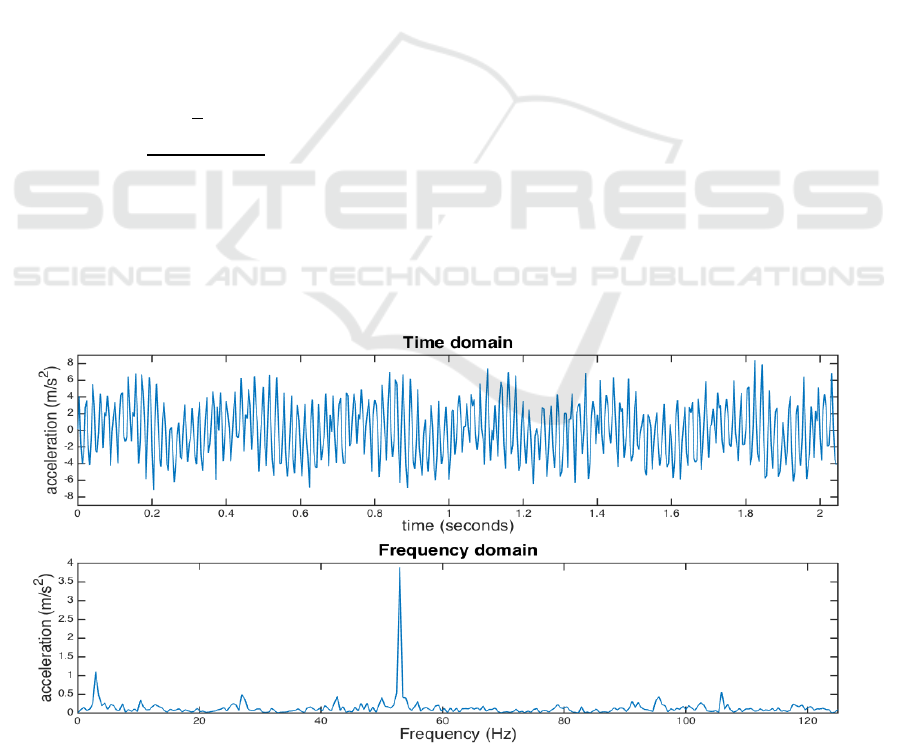
Up until this point, the acceleration samples measured
has been visualized in the time domain. A big part of
vibration analysis is investigating the signal in the
frequency domain (Figure 2) which is done using a
Fast Fourier Transform (FFT) algorithm (Rao et al.,
2011). The purpose of this is to determine the
magnitude and frequency of the various signals that
produce the waveform, making it easier to identify the
nature and source of vibration.
Figure 2: Vibration signal in time and frequency domain.
Development of a Vibration Measurement Device based on a MEMS Accelerometer
295
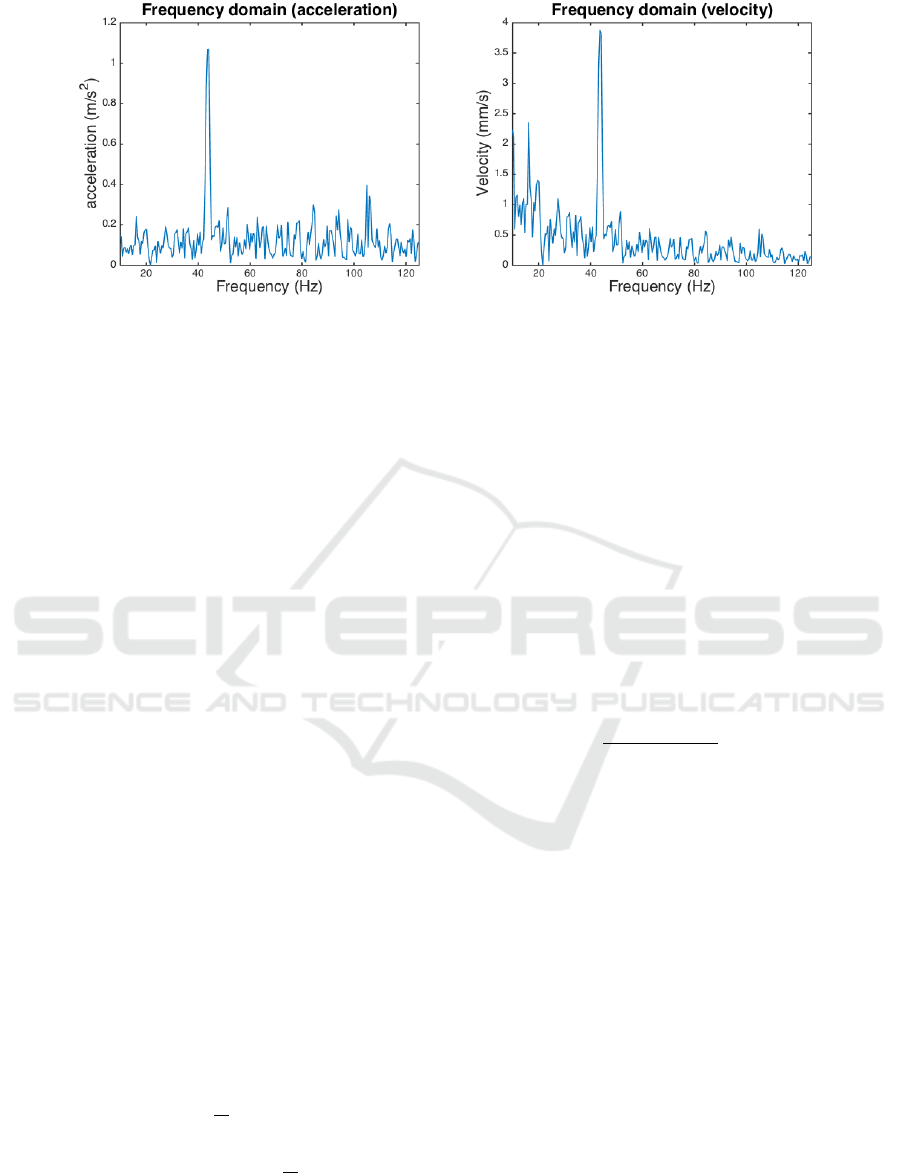
Figure 3: Velocity FFT derived from acceleration FFT.
Before performing an FFT analysis on the original
signal, the sampling rate, and number of samples
should be decided. This decision is based on the
length of time, and expected frequency range which
needs to be analysed. In vibration measurement, for
accuracy and consistency, analysing short time
intervals (i.e. < 3 seconds) is preferred, especially in
a vehicular environment where the speed of travel
determines the length of the road scanned per time.
For example, surface irregularities (which may cause
increased vibration) present in small sections of the
road will be overshadowed, if a much larger portion
of the road is scanned as a single waveform.
In common FFT algorithms, the number of
samples (FFT size) evaluated are in powers of two
(i.e. 64, 128, 256, 512 etc.), otherwise, zeros are
added to the end of the signal to generate the desired
length. This is a common source of error that can
easily be avoided by acquiring the right number of
samples.
The FFT size defines the number of bins (amount
of samples in the frequency domain), and the
sampling rate determines the maximum frequency
that can be identified. According to equation (7),
the number of bins is half the FFT size, where each
bin has a resolution (frequency difference per bin)
calculated using equation (8). For this experiment,
a sampling rate of 250Hz and FFT size of 512 was
chosen. This was preferred based on several factors,
including, required measurement frequencies,
resolution, and memory capabilities of the selected
MCU.
=
2
(∆
)=
(7)
(8)
Where
is the number of bins, is the total
number of samples (FFT size), ∆ is the FFT
resolution, and
is the sampling rate.
3.3 Conversion of Acceleration FFT to
Velocity
When the FFT for the acceleration samples is
calculated, the next phase is to evaluate the velocity
(in mm/s) of each frequency bin using equation (9).
The samples obtained for acceleration are in the unit
of metres per second squared (m/s
2
), hence, the
derived velocity is multiplied by 1000 to evaluate its
value in millimetre per second (mm/s).
Figure 3 shows
the derived velocity’s frequency domain.
(
)
=
(
)
2∗∗∆
∗
∗1000
(9)
Where is the velocity, is the acceleration, ∆
is the FFT resolution, and is the index of the sample
3.4 Root Sum Squared (RSS) Moving
Average
After calculating the equivalent velocity for each
frequency, due to the resolution of the FFT bins, and
irregularity of the vibration signals, in some cases, the
magnitude of the vibration (after the FFT analysis)
spans across neighbouring frequencies. This causes a
reduced amplitude to be reflected on the frequency
domain as shown in Figure 4a. Running an RSS
moving average (equations (10
) and (11)) on the
samples corrects this problem as illustrated in Figure
4b, producing accurate and consistent results.
VEHITS 2017 - 3rd International Conference on Vehicle Technology and Intelligent Transport Systems
296
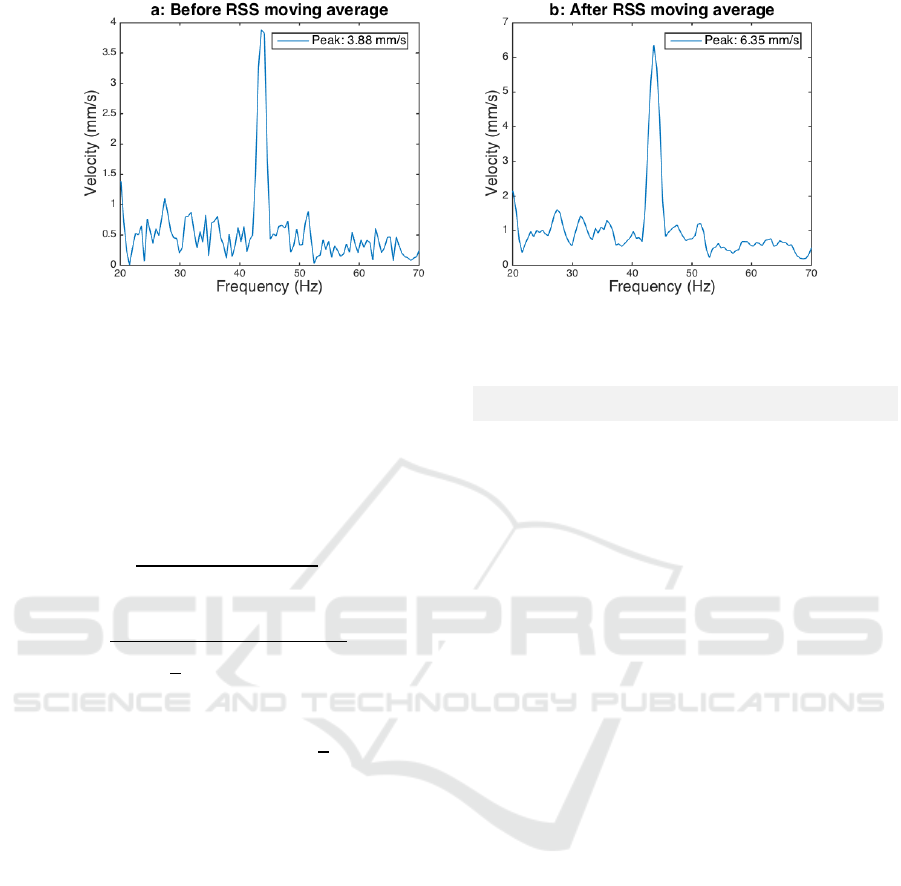
Figure 4: Derived velocity FFT showing the effect of RSS moving average (signal vibration = 6.32 mm/s).
The moving average requires a window length,
which indicates the number of samples to evaluate
when computing the average. In this application, it is
advisable to select an even number for the window
length; this is to maintain uniformity on either side of
() in equation (11). For this experiment, a
window length of two was chosen, as tests taken
proved more accurate.
=
1
+2
+⋯+
()=
−
2
+⋯+
(
−1
)
+
(
)
+
(
+1
)
+⋯+
+
2
(10)
(11)
Where is the number of values to be averaged,
is the calculated RSS average, is the velocity, is
the moving average’s window length, and
∈
ℝ
|
1≤≤}.
The equivalent vibration (in mm/s) and frequency
of the measured samples is then evaluated based on
the maximum value detected across the different
frequencies i.e. the vibration calculated for Figure 4
is 6.35 mm/s at 44Hz.
4 RESULTS
Figures 5 – 10, show the results obtained while taking
measurements for different vibration levels at varying
frequencies. Using the HS-620 Hansford meter as the
benchmark for the error analysis, Table 1 compares
both results obtained from the MEMS meter and the
HS-620, showing the percentage error in each case.
Table 1: Experimental results with percentage error.
HS-620 MEMS meter % Error
1.08 mm/s
3.42 mm/s
5.02 mm/s
7.72 mm/s
8.3 mm/s
11.7 mm/s
17.9 mm/s
0.91 mm/s
3.61 mm/s
5.06 mm/s
7.75 mm/s
8.3 mm/s
11.8 mm/s
17.9 mm/s
15.7%
5.6%
0.8%
0.4%
0%
0.9%
0%
The images below show the peak amplitudes
obtained after the RSS averaging, and these
amplitudes define the vibration levels in velocity. As
shown in Figure 5, there are instances where the
frequency analysis produces multiple peaks at various
frequencies, and this indicates the presence of
vibration from different sources. In this instance, the
RMS velocity is calculated (based on Parseval’s
theorem) on all the peaks.
Currently, the consistency of the algorithm is
between ±1 mm/s, which is based on the accuracy and
sensitivity of the accelerometer. Other filtering and
processing methods are been considered to improve
this consistency. One of these include using an
exponentially weighted moving average on the raw
samples to reduce the effect of sudden peaks and high
frequencies. Another method considered, is applying
a window to the samples used for the FFT analysis, to
help with signal discontinuity, comparing the various
windowing techniques, with and without
overlapping.
Development of a Vibration Measurement Device based on a MEMS Accelerometer
297
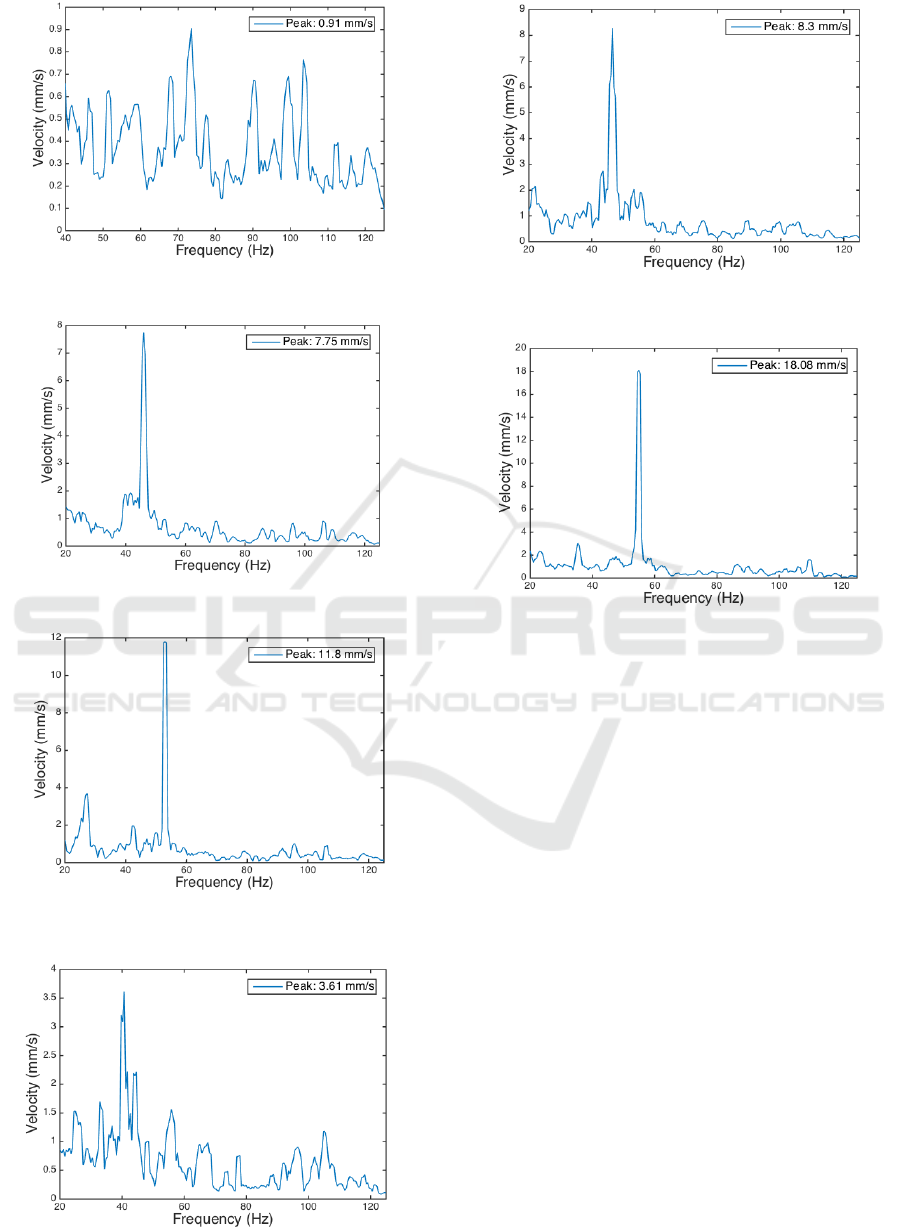
Figure 5: Vibration signal (1.08 mm/s @75Hz).
Figure 6: Vibration signal (7.72 mm/s @46Hz).
Figure 7: Vibration signal (11.7 mm/s @53Hz).
Figure 8: Vibration signal (3.42 mm/s @42Hz).
Figure 9: Vibration signal (8.3 mm/s @46Hz).
Figure 10: Vibration signal (17.9 mm/s @56Hz).
5 CONCLUSIONS
Vibration monitoring has a wide range of applications
in machine mentoring, ranging from industrial to
domestic use cases. This paper proposes a novel
process of achieving accurate and precise vibration
measurement using MEMS accelerometers. Results
show an error rate of <1% for vibrations greater than
5 mm/s. While error rates of up to 15% was achieved
for vibrations less than 1 mm/s, which according to
the International Organization for Standardization
(ISO), is insignificant in machine based monitoring,
since unsatisfactory conditions begin at ~3 mm/s.
REFERENCES
Abulizi, N. et al., 2016. Measuring and evaluating of road
roughness conditions with a compact road profiler and
ArcGIS. Journal of Traffic and Transportation
Engineering (English Edition), 3(5), pp.398–411.
Available at:
http://dx.doi.org/10.1016/j.jtte.2016.09.004.
VEHITS 2017 - 3rd International Conference on Vehicle Technology and Intelligent Transport Systems
298

Barone, V. et al., 2016. Vibrational Comfort on Board the
Vehicle : Influence of Speed Bumps and Comparison
between Different Categories of Vehicle. , 2016(iii).
Dayyani, K., Chaychian, S. & Esat, I., 2016. Vibration
Suppression System for a Real Petrol Engine Exploiting
Optimum Shaker Position. , (7), pp.112–120.
Helal, I.A. et al., 2015. VIBRATION MONITORING
BASED ON MEMS ACCELEROMETERS. , pp.240–
245.
Jamil, I.A. et al., 2014. Vibration data acquisition and
visualization system using MEMS accelerometer. 2014
International Conference on Electrical Engineering
and Information & Communication Technology,
(APRIL), pp.1–6. Available at:
http://ieeexplore.ieee.org/lpdocs/epic03/wrapper.htm?
arnumber=6919090.
Kuntiyawichai, K. & Burdekin, F.M., 2003. Engineering
assessment of cracked structures subjected to dynamic
loads using fracture mechanics assessment.
Engineering Fracture Mechanics, 70(15), pp.1991–
2014.
Rao, K.R., Kim, D.N. & Hwang, J.J., 2011. Fast Fourier
Transform - Algorithms and Applications, Springer
Science & Business Media.
Stein, G.J., Chmurny, R. & Rosík, V., 2007. Measurement
and Analysis of Low Frequency Vibration.
Measurement Science Review, 7(3), pp.47–50.
Development of a Vibration Measurement Device based on a MEMS Accelerometer
299
