
The Goal - Question - Indicator Approach for Personalized Learning
Analytics
Arham Muslim, Mohamed Amine Chatti, Memoona Mughal and Ulrik Schroeder
Informatik 9, RWTH Aachen University, Germany
Keywords:
Learning Analytics, Open Learning Analytics, Personalized Learning Analytics, OpenLAP.
Abstract:
Open learning analytics (OLA) is a relatively new branch of learning analytics (LA) which emerged due to the
growing demand for self-organized, networked, and lifelong learning opportunities. OLA deals with learning
data collected from various learning environments and contexts, analyzed with a range of analytics methods,
and for different stakeholders with diverse interests and objectives. This diversity in different dimensions of
OLA is a challenge which needs to be addressed by adopting a personalized learning analytics (PLA) model.
Current implementations of LA mainly rely on a predefined set of questions and indicators which is not suitable
in the context of OLA where the indicators are unpredictable. In this paper we present the goal - question -
indicator (GQI) approach for PLA and provide the conceptual, design, implementation and evaluation details
of the indicator engine component of the open learning analytics platform (OpenLAP) that engages end users
in the indicator generation process by supporting them in setting goals, posing questions, and self-defining
indicators.
1 INTRODUCTION
Learning Analytics (LA) is an emerging research
field that deals with the development and impro-
vement of methodologies to support the learning pro-
cess by exploiting the educational data. Recently,
a new research area has emerged called Open Lear-
ning Analytics (OLA) which focuses on more open,
self-organized and networked learning environments
(Chatti, 2010). The aim of OLA is to improve lear-
ning effectiveness and efficiency in lifelong learning
environments (Chatti et al., 2017).
The field of OLA is still not well established and
the concrete conceptual and implementation plans are
lacking. Thus, the solutions which could deliver the
full potential of OLA are also in the early stage of
development. Different solutions have been proposed
in literature such as, the Apereo Learning Analytics
Initiative (Apereo LAI) and the Jisc Open Learning
Analytics Architecture (Jisc OLAA). However, these
solutions have limitations such as addressing the go-
als of a limited set of stakeholders, working with a
specific set of data, answering a predetermined set of
objectives, and relying on a predefined set of analytics
methods. To address these challenges, we proposed in
earlier works the Open Learning Analytics Platform
(OpenLAP) (Chatti et al., 2017; Muslim et al., 2017).
In order to satisfy the requirements of different stake-
holders in OLA, there is a need to involve the end user
in the LA process by adopting a personalized learning
analytics (PLA) model. In this paper, we explore the
concept of PLA and introduce the Goal - Question -
Indicator (GQI) approach for PLA. As an application
of the GQA approach, we present the conceptual, de-
sign, and implementation details of the indicator en-
gine component of OpenLAP. The main aim is to pro-
vide support for flexible definition and dynamic ge-
neration of indicators to meet the needs of different
stakeholders with diverse goals.
The remainder of the paper is structured as fol-
lows: In Section 2, we present the GQI approach for
PLA. In Section 3, we explain the architecture and the
main components of OpenLAP. Section 4 presents the
conceptual design and implementation details of the
indicator engine component of OpenLAP. The evalu-
ation results of the indicator engine in terms of useful-
ness and usability are discussed in Section 5. Finally,
Section 6 summarizes the main findings in the paper
and gives perspectives for future work.
Muslim, A., Chatti, M., Mughal, M. and Schroeder, U.
The Goal - Question - Indicator Approach for Personalized Learning Analytics.
DOI: 10.5220/0006319803710378
In Proceedings of the 9th International Conference on Computer Supported Education (CSEDU 2017) - Volume 1, pages 371-378
ISBN: 978-989-758-239-4
Copyright © 2017 by SCITEPRESS – Science and Technology Publications, Lda. All rights reserved
371

Figure 1: The Goal - Question - Indicator (GQI) approach
for Personalized Learning Analytics (PLA).
2 THE GQI APPROACH FOR PLA
The aim of Open Learning Analytics (OLA) is to im-
prove learning effectiveness and efficiency in lifelong
learning environments. OLA harnesses data coming
from various learning environments and contexts of
different stakeholders with diverse interests and ob-
jectives, as well as multiple analytics methods to gain
insight into learning processes (Chatti et al., 2017).
Personalization of the LA process is the key chal-
lenge in OLA to serve the requirements of different
stakeholders with diverse goals in an effective and ef-
ficient way. The user should be in control of the LA
process if LA tools are to serve the intended objective
of improving learning and teaching. Most LA tools
currently available provide a static set of predefined
questions and indicators focusing on specific objecti-
ves of selected stakeholders. This, however, is not
feasible in the OLA context where the set of required
indicators is unpredictable. In order to achieve perso-
nalized learning analytics (PLA), an indicator defini-
tion process is required which can enable end user to
dynamically define new questions and indicators that
meet their goals in an effective and efficient way. In
this paper, we present the Goal - Question - Indicator
(GQI) approach for PLA which supports end users in
the LA process by setting goals, posing questions, and
self-defining indicators. Figure 1 shows the GQI ap-
proach consisting of three main steps.
– Goal: In this step, the user can specify an ap-
propriate LA objective (e.g. monitoring, analysis,
prediction, intervention, tutoring, mentoring, as-
sessment, feedback, adaptation, personalization,
recommendation, awareness, reflection) to initiate
the indicator definition process.
– Question: In this step, the user can formulate the
LA question based on the specified LA goal (e.g.
how active are the students in the classroom?).
– Indicator: In the last step, the user can define
multiple indicators to answer the formulated LA
question. An indicator can be defined as a spe-
cific calculator with corresponding visualizations,
tied to a specific question. Example of indicators
include attendance rate in class, post rate in wikis,
post rate in discussion forums. To define each in-
dicator, the user follows the inner circle shown in
Figure 1 by exploring the learning activities data,
applying various filters on it, analyzing it and fi-
nally visualizing it. This would make the LA pro-
cess more transparent, enabling users to see what
kind of data is being used and for which purpose.
3 OPEN LEARNING ANALYTICS
PLATFORM (OpenLAP)
The Open Learning Analytics Platform (OpenLAP)
1
provides a detailed technical OLA architecture with
a concrete implementation of all its components, se-
amlessly integrated in a platform. It follows a user-
centric approach to engage end users in flexible defi-
nition and dynamic generation of indicators. To meet
the requirements of diverse users, OpenLAP provides
a modular and extensible architecture that allows the
easy integration of new analytics modules, analytics
methods, and visualization techniques.
In the following sections, we present a brief des-
cription of OpenLAP through a discussion of its ab-
stract architecture and system workflow.
3.1 Abstract Architecture
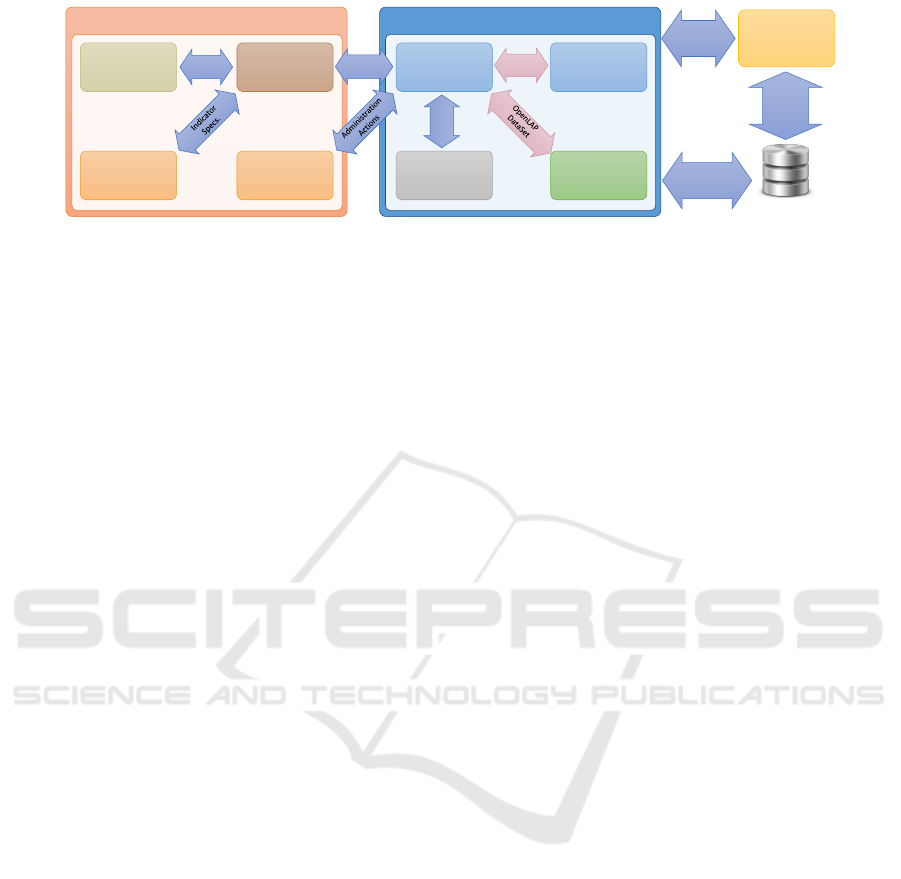
The abstract architecture of OpenLAP consists of
three main components, namely Data Collection and
Management, Indicator Engine, and Analytics Frame-
work as shown in Figure 2.
The Data Collection and Management component
in OpenLAP is responsible for collecting learning
activities data from different sources adhering to the
privacy policies of OpenLAP and generating the lear-
ner and context models from it.
The aim of the Indicator Engine component
in OpenLAP is to achieve personalized and goal-
oriented LA by following the GQI approach that al-
lows users to easily define new indicators through an
intuitive and interactive UI.
The Analytics Framework lays the foundation of
simple yet powerful framework that is responsible for
1
http://lanzarote.informatik.rwth-aachen.de/openlap
CSEDU 2017 - 9th International Conference on Computer Supported Education
372
Data Storage
Activities
Data
Analytics
Methods
Analytics
Modules
Analytics Framework
Analytics
Engine
Visualizer
Indicator
Info.
Data
Collection and
Management
Data &
Models
Analytics
Data
OpenLAP
DataSet
Rule
Engine
Indicator
Editor
Indicator Engine
Indicator
Generator
Rules
Indicator
Specs.
Administration
Panel
Figure 2: OpenLAP Abstract Architecture.
the management, generation and execution of indica-
tors. It provides an easy and flexible mechanism for
LA researchers and developers to add new analytics
modules, analytics methods and visualization techni-
ques to OpenLAP at runtime. It is the combination
of the “OpenLAP-DataSet”, the “Analytics Modu-
les”, the “Analytics Methods”, the “Visualizer”, and
the “Analytics Engine” core components of OpenLAP
(Muslim et al., 2017).
3.2 System Workflow
In the following section, we explain the two main sy-
stem processes of OpenLAP which show how the dif-
ferent components interact with each other (Muslim
et al., 2017).
3.2.1 Indicator Generation
The indicator generation process is realized by the In-
dicator Engine component of OpenLAP to let users
dynamically define their new indicators. During this
process, the user interacts with the “Indicator Editor”
UI of the Indicator Engine to specify the LA goal such
as monitoring, prediction, assessment, and reflection.
Afterwards, the user formulates the LA question and
associates multiple indicators to answer this question.
To generate a new indicator, the user performs the fol-
lowing steps:
1. Explore the learning activities data stored in the
Learning Context Data Model (LCDM) format
(see Section 4.3.1).
2. Select the appropriate dataset for the indicator.
3. Apply different filters.
4. Choose the analytics method to be applied.
5. Map the columns of the dataset to the inputs of the
analytics method.
6. Choose the visualization technique to be used.
7. Map the outputs of the analytics method to the in-
puts of the visualization technique.
8. Preview the visualization of the indicator.
During the indicator generation process, the Indi-
cator Engine remains in continuous communication
with the “Analytics Engine” component of the Analy-
tics Framework to get all possible dataset parameters,
get the list of analytics methods which can be used,
get the visualization techniques which can be applied,
validate the specified mappings, and generate the in-
dicator preview. After the indicator is finalized, the
“Analytics Engine” saves it to database as a triad: in-
dicator query ID - method ID - visualizer ID and gene-
rates an HTML and JavaScript based indicator request
codes for each indicator which the user can embed
in any client application (e.g. Web page, dashboard,
LMS) to visualize the indicator with current data.
3.2.2 Indicator Execution
The indicator execution process is handled by the
Analytics Framework component of OpenLAP. The
indicator request code embedded in the client appli-
cation request the Analytics Framework to visualize
the specific indicator. The “Analytics Engine” inter-
cepts the request and performs the following steps:
1. Check whether the request is valid or not.
2. Communicate with the respective “Analytics Mo-
dule” to get the triad.
3. Get the query related to the requested indicator
from the database.
4. Execute the query and get the raw data.
5. Transform the raw data into the “OpenLAP-
DataSet”.
6. Send the “OpenLAP-DataSet” and the mapping
indicator query - method to the analytics method
referenced in the triad for analysis.
7. Receive the analyzed data as an “OpenLAP-
DataSet”.
8. Send the “OpenLAP-DataSet” and the mapping
method - visualization to the visualization techni-
que referenced in the triad.
The Goal - Question - Indicator Approach for Personalized Learning Analytics
373

9. Receive the visualization code and forward it to
the requesting client application to visualize the
indicator.
4 INDICATOR ENGINE IN
OpenLAP
The main focus of this paper is the Indicator En-
gine component of OpenLAP which is responsible
for providing personalized and goal-oriented LA by
realizing the indicator generation process of Open-
LAP. It is built upon the previous work called a rule-
based indicator definition tool (RIDT) for personali-
zed learning analytics (Muslim et al., 2016). Initially,
RIDT was developed as a standalone tool responsi-
ble for both indicator generation and indicator execu-
tion processes. In order to make OpenLAP modular,
RIDT has been divided into the Indicator Engine and
the Analytics Framework components responsible for
the indicator generation and the indicator execution
processes respectively. Moreover, the evaluation of
RIDT revealed limitations in terms of usability which
impacted the user acceptance of the tool.
In the following sections, we present the design
and implementation of the Indicator Engine in Open-
LAP - which represents an enhancement of RIDT -
through a comprehensive discussion of one of the pos-
sible user scenarios, conceptual approach, implemen-
tation details, and evaluation.
4.1 User Scenario
Omer is a lecturer at RWTH University where he is te-
aching a Web Technologies course. In order to admi-
nister his course, he uses the university learning ma-
nagement system called L
2
P. On the dashboard of the
web technologies courseroom in L
2
P, Omer has vari-
ous indicators, such as, presence of students in class,
most downloaded documents, and the average grades
of students in assignments.
Omer is a pro-active lecturer who is always look-
ing for ways to improve his teaching. Therefore, he is
interested in monitoring the activities of the students
in his class. To do that, he looked at the list of avai-
lable indicators in OpenLAP, but did not find exactly
the ones he was looking for. Thus, he uses the user in-
terface of the indicator engine in OpenLAP and starts
the indicator generation process by selecting ‘Moni-
toring’ as an analytics goal. Followed by entering the
analytics question ‘Activities of students in the Web
Technologies class’. Omer reuses the existing indi-
cator ‘Most downloaded documents’ and updates the
filter to get the top most viewed learning materials in
the Web Technologies class. He associates this indi-
cator with the analytics question under the name ‘Top
10 viewed learning materials’.
Afterwards, Omer starts creating a new indicator
named “Weekly time evolution of learning resources
accessed”. He selects ‘L
2
P’ as a data source, ‘WEB’
as platform, ‘View’ as action, and ‘Learning Materi-
als, Media Library, Shared Documents’ as category to
define the basic dataset for the indicator. Next, he ap-
plies a filter on the dataset to get data related to the
Web Technologies class only. After that he selects the
‘Item Counter - Weekly’ analytics method and maps
the ‘Timestamp’ and ‘Category’ columns of the data-
set to the ‘Timestamp’ and ‘Items to count’ inputs of
the selected analytics method respectively. Next, he
uses the ‘Stacked Area Chart’ visualization type of the
‘C3/D3.js’ visualization library and maps the ‘Time
(Weeks)’, ‘Item Count’ and ‘Item Names’ outputs of
the analytics method to the ‘X-Axis Items’, ‘Y-Axis
Values’ and ‘Stacked Items’ to the inputs of the visua-
lization type. Finally, he previews the indicator before
associating it with the analytics question. Similarly,
he generates two more indicators named ‘post rate in
wikis’ and ‘rate of different resource types viewed’.
After that he finalizes the question and its associated
indicators to get the indicator request code which he
embeds in his course dashboard for visualization. The
newly created question and associated indicators are
added to the list of available questions and indicators
for future use by other users.
4.2 Conceptual Approach
In the following sections, we discuss the design of the
Indicator Engine with a focus on the system require-
ments and the abstract architecture.
4.2.1 System Requirements
Developing a tool to support end users in dynamic ge-
neration of new indicators is a challenging task. In
this section we outline the requirements for the Indi-
cator Engine.
– Modularity: The Indicator Engine should adapt
a modular architecture to allow easy and effective
communication between loosely-coupled modu-
les and faster adaptability of new underlying data
model.
– Extensibility: The Indicator Engine should be
flexible and extensible to support easy insertion
of new analytics goals, analytics methods, and vi-
sualization techniques after the platform has been
deployed.
CSEDU 2017 - 9th International Conference on Computer Supported Education
374

– Usability: The Indicator Engine should follow
standard design patterns and provide intuitive,
responsive and consistent user interface (UI) to
guide users through indicator generation process.
Furthermore, in order to provide flexible user ex-
perience, the UI should include features to give
user more control over the indicator definition
process.
4.2.2 Abstract Architecture
The abstract architecture of the Indicator Engine is
shown in Figure 2. It consists of four main compo-
nents: “Indicator Editor”, “Rule Engine”, “Indicator
Generator”, and “Administration Panel”. The “Indi-
cator Editor” provides an interactive and responsive
UI to realize the indicator generation process. The
“Rule Engine” holds the rules which are used to gene-
rate the data query for the indicators based on the pa-
rameters defined by the users via the “Indicator Edi-
tor”. The “Indicator Generator” is the orchestrator
of the Indicator Engine responsible for the commu-
nication between the different components within the
Indicator Engine and with the “Analytics Engine” in
the Analytics Framework. The “Administration Pa-
nel” provides a set of UI for administrators and de-
velopers to manage different parts of OpenLAP, such
as, approving new analytics goals, uploading new and
managing existing analytics methods and visualiza-
tion techniques.
4.3 Implementation
The Indicator Engine is a Java Spring Framework
2
based web application that follows the Model View
Controller (MVC) design pattern. The application
makes extensive use of Web technologies, such as
Servlets, JSP, Java Beans at the server side and
jQuery, jQuery UI, and AJAX at the client side. In
the following sections we explain the underlying data
model and discuss the technical details of each com-
ponent in the Indicator Engine using the example
‘Weekly time evolution of learning resources acces-
sed’ indicator presented in Section 4.1.
4.3.1 Data Model
Learners are collaborating more than ever in open,
self-organized and networked learning environment.
Thus, the users’ learning activities need to be col-
lected from various heterogeneous sources in a com-
mon format for analysis. Data models provide a stan-
dard way to support interoperability and integration
2
http://projects.spring.io/spring-framework/
of data from various sources. Numerous data mo-
dels have been proposed in LA literature, such as,
Experience API (xAPI), IMS Caliper, Activity Stre-
ams Contextualized Attention Metadata (CAM), Le-
arning Registry Paradata, and NSDL Paradata. Open-
LAP uses the Learning Context Data Model (LCDM),
proposed in the Learning Context Project
3
. LCDM
represents a balance between completeness, flexibi-
lity, and simplicity as compared to other candidate
data models for LA. It is a simple and easy to un-
derstand data model which holds additional semantic
information about the context in which an event has
been generated. As compared to other data models
which are event-centric, LCDM is user-centric which
is crucial to achieve personalization related tasks in
LA (Lukarov et al., 2014). Nevertheless, the modular
and extensible architecture of OpenLAP allows easy
adaptability to different underlying data model, such
as xAPI or IMS Caliper (see Section 4.3.2) (Muslim
et al., 2016).
4.3.2 Indicator Engine
In the following sections we discuss the implementa-
tion details of each component in the Indicator En-
gine shown in Figure 2.
Indicator Editor
The “Indicator Editor” component is the collection
of MVC Views providing a UI for the Indicator
Engine focusing on providing high usability and user
control. Following the GQI approach, the main UI
has been divided into three main sections, namely
Goal, Question, and Indicator.
Goal
The user starts the indicator generation process by
selecting an appropriate LA goal such as monito-
ring, prediction, assessment, recommendation, and
reflection. The user can request a new LA goal if the
provided list does not contain the required LA goal.
In order to moderate the creation of new LA goals,
only those LA goals are made available to the users
which have been approved by the administrators via
the “Administration Panel”. Additionally, the user
has option to reset the current indicator generation
process by clicking ‘New Question’ button. For
the “Weekly time evolution of learning resources
accessed” indicator, the LA goal ‘Monitoring’ is
selected.
3
http://www.learning-context.de/
The Goal - Question - Indicator Approach for Personalized Learning Analytics
375

Question
After selecting an appropriate LA goal, the user
formulates the LA question, such as, ‘Activities
of students in the Web Technologies class’ for the
‘Weekly time evolution of learning resources acces-
sed’ indicator. Afterwards, the user can associate
multiple indicators with the LA question either
by loading an existing indicator and altering its
parameters or defining a new indicator (as explained
in next section). Each associated indicator can
easily be deleted or selected for editing again. After
finalizing the association of the required indicators
with the LA question, the user can visualize it and
save it to the database. While saving, the Analytics
Framework generates the indicator request codes
for the saved question and its associated indicators
which is provided to the user as shown in Figure 3.
These indicator request codes can be embedded in
any client application (e.g. dashboard, Web pages) to
visualize them using the selected data.
Indicator
In this section, the user can specify the parameters for
the new indicator or customize the loaded indicator.
The section is further divided into four parts, namely
dataset, filters, analysis, and visualization.
• Dataset In this part of the UI, the user can spe-
cify the name and explore the learning activities
data to define the basic dataset for the indicator.
The dataset is defined based on the parameters se-
lected by the user, including the list of Sources
from where the data should be used (L2P, Moodle,
etc.), data coming from which Platforms should
be included (web, mobile, etc.), data related to
which Action types should be used (add, update,
delete, post, begin, end, etc.) and which Category
should be used (Wiki, Discussion forum, Assign-
ments, etc.). These parameters represent the attri-
butes of the ‘Event’ table in the LCDM data mo-
del, as discussed in Section 4.3.1.
• Filters
This part allows the user to specify additional fil-
tering parameters on the defined dataset. Three
different types of filters can be applied, namely
‘Attribute’, ‘Time’, and ‘User’. The ‘Attribute’
filters are applied on the additional semantic infor-
mation related to each event stored in the ‘Entity’
table of the LCDM (see Section 4.3.1). Using the
‘Time’ filter the starting and/or ending dates can
be specified to define the range of time for which
the data should be used. Finally, the ‘User’ fil-
ter allows the user to specify whether only his/her
data or anonymized data of the whole class should
be considered.
• Analysis
Analysis is the crucial part of the indicator gene-
ration process where the user can specify which
analytics method should be performed on the fil-
tered dataset. The user can select an analytics
method from a provided list containing methods
from the domain of statistics, data mining (DM),
and social network analysis (SNA). Afterwards,
the user can define the mapping between the fil-
tered dataset and the selected analytics method
by specifying which column of the dataset should
go into which input of the analytics method. A
statistics analytics method called ‘Item Counter -
Weekly’ is used for the ‘Weekly time evolution
of learning resources accessed’ indicator. The se-
lected analytics method expect two inputs, ‘Items
to count’ and ‘Timestamp’ which are mapped
to ‘Category’ and ‘Timestamp’ data columns re-
spectively.
• Visualization The final step in the indicator gene-
ration process is to define the visualization for the
indicator. In this part, the user can select an appro-
priate visualization library and visualization type
for the indicator. Afterwards, the user can define
the mapping between the outputs of the selected
analytics method and the expected inputs of the
selected visualization type. For the ‘Weekly time
evolution of learning resources accessed’ indica-
tor, the ‘Stacked Area Chart’ of the ‘C3/D3.js’ vi-
sualization library is used. The selected visuali-
zation type requires three inputs, ‘X-Axis Items’,
‘Y-Axis Values’ and ‘Stacked Items’ which are
mapped to ‘Time (Weeks)’, ‘Item Count’ and
‘Item Names’ outputs of the selected analytics
method respectively.
Rule Engine
The “Rule Engine” component is responsible for ma-
naging the rules to generate data queries for indicators
during the indicator generation process. The Indica-
tor Engine uses a rule engine called Drools
4
. Each
rule accepts a list of selected dataset and filtering
parameters and generates an appropriate data query.
Drools rule consists of three main clauses, a ‘Header’
clause which contains a human readable name of the
rule, a ‘When’ clause where the condition for execu-
ting the rule is specified and a ‘Then’ clause descri-
bing the actions which needs to be taken when the
specified conditions are satisfied. After the user has
finalized defining the indicator using the “Indicator
Editor”, the “Indicator Generator” requests the Drools
to generate the data query for the indicator using the
4
http://www.drools.org/
CSEDU 2017 - 9th International Conference on Computer Supported Education
376
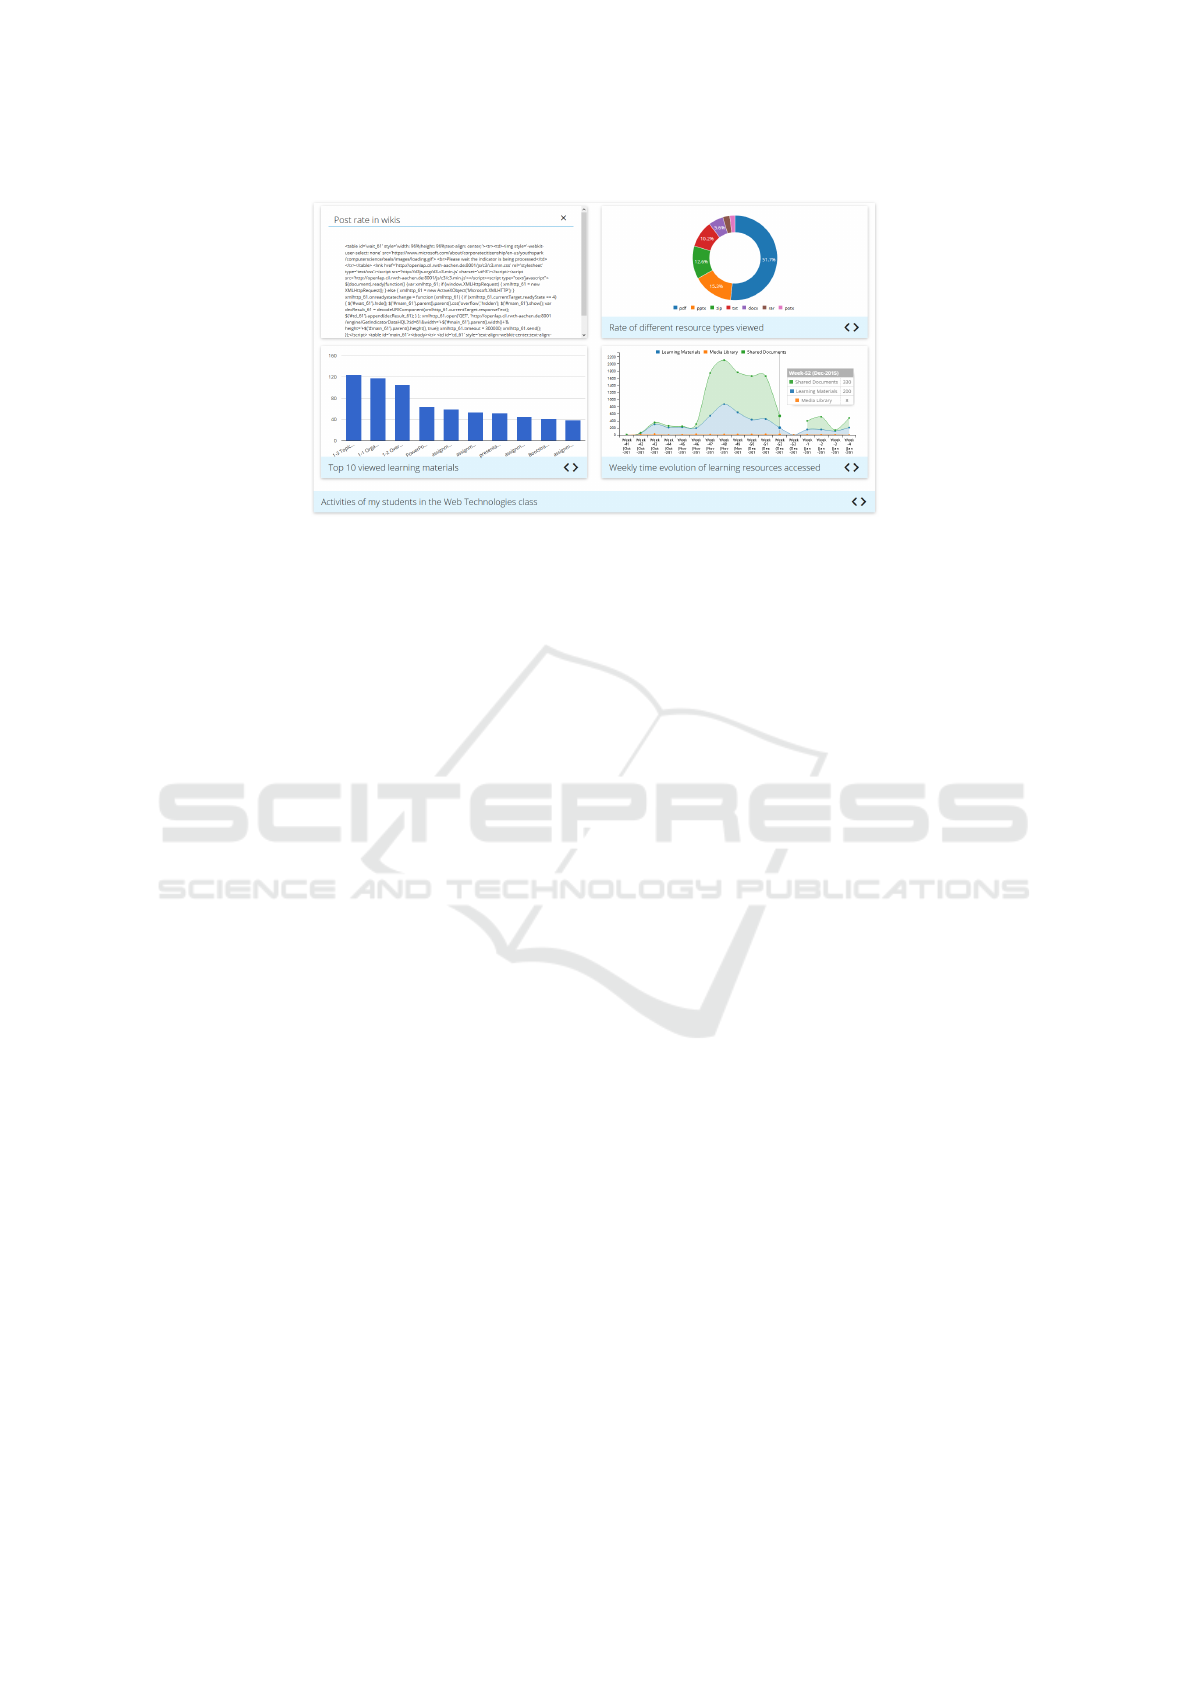
Figure 3: Indicator request code generated for the question.
dataset and filtering parameters provided by the user.
The data query is used to fetch the raw data from
the database during indicator generation and indica-
tor execution processes by the Analytics Framework.
The core benefit of following a rule-based appro-
ach in the Indicator Engine is that the LCDM can ea-
sily be replaced with other data models such as xAPI,
IMS Caliper by changing ‘When’ and ‘Then’ clauses
in the rules to accommodate the attributes of the new
data model. Additionally, rules make it easy to adapt
a different database technology (e.g. NoSQL) by de-
fining appropriate actions in the ‘Then’ clause.
Indicator Generator
The “Indicator Generator” acts as a mediator between
different components of the Indicator Engine. It is
responsible for generating the data queries by com-
municating with the “Rule Engine”, providing data to
different sections of the “Indicator Editor” by com-
munication with the Analytics Framework as shown
in Figure 2.
Administration Panel
The “Administration Panel” provides a set of UI to
enable extensibility in OpenLAP by allowing mana-
gers to administer different parts of it. It helps ad-
ministrators to approve or reject the newly requested
LA goals by the end users. OpenLAP is a modular
and extensible framework which allows developers to
develop and easily integrate new analytics methods
and visualization techniques (Muslim et al., 2017).
The “Administration Panel” provides an intuitive in-
terface to allow developers to upload newly developed
components to OpenLAP which are made available to
users after validation by the Analytics Framework.
5 EVALUATION
We conducted a user evaluation based on a custom
questionnaire to assess the usability of the Indicator
Engine. The System Usability Scale (SUS) was em-
ployed as a general usability evaluation method. Du-
ring the evaluation process, the users were briefly in-
troduced to the concept of personalized LA and the
objectives of the Indicator Engine in OpenLAP. 10
participants were asked to follow the steps of the in-
dicator generation process and perform various tasks.
Subsequently, the participants were asked to fill out
the questionnaire which consisted of 28 questions di-
vided in four sections.
5.1 Participants’ Background
The first section of the questionnaire gathered the par-
ticipants’ backgrounds. 70% of the participants were
in the 18-30 age range and had at least Bachelor’s
degree in computer science. 40% of the participants
were professionals working in software development
industries whereas the rest were either students or re-
searchers in universities. The male to female ratio in
the participants was 1:1.
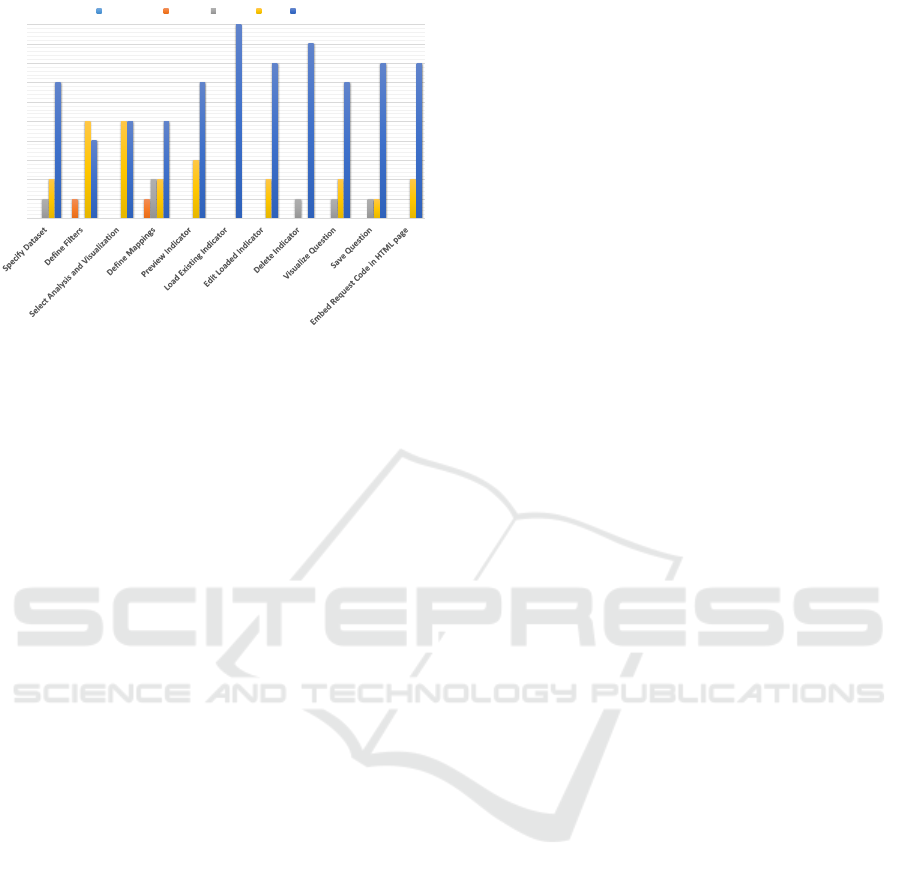
5.2 Usefulness
The second section of the questionnaire focused on
capturing the usefulness of the Indicator Engine.
Around 94% of the participants found the different
steps of the indicator generation process easy or very
easy as shown in the Figure 4. Only one of the par-
ticipants found the steps ‘Define Filters’ and ‘Define
Mappings’ to be difficult. In general, the participants
The Goal - Question - Indicator Approach for Personalized Learning Analytics
377
0
1
2
3
4
5
6
7
8
9
10
Response Count
Very Difficult Difficult Normal Easy Very Easy
Figure 4: Usefulness evaluation of the Indicator Engine.
reported that the Indicator Engine was useful. Howe-
ver, some participants requested to provide suggesti-
ons for defining mappings to further improve the user
experience for non-technical users. Additionally, a
feedback was given to include a step by step guide
including screencast for the indicator generation pro-
cess.
5.3 Usability
The third section of the questionnaire captured the
usability of the Indicator Engine. It consisted of 10
questions required to compute the usability score of
the Indicator Engine using the System Usability Scale
(SUS) method. The questions were designed to cap-
ture the intuitiveness, simplicity, feedback, responsi-
veness, efficiency of the UI, user’s comfort level in
using the UI, and the steepness of the learning curve
which a user must go through to successfully use
the UI. Based on the provided feedback, the usabi-
lity score of the Indicator Engine is calculated to be
81.75 which is above the average SUS score of 68.
Overall, the participants found the system intuitive,
responsive, and easy to learn.
5.4 General Remarks
The last part of the questionnaire aimed at collecting
the general user remarks related to the Indicator En-
gine. The feedback revealed that all participants liked
the concept of defining their own indicators following
the GQI approach. The most appreciated feature was
flexibility in customizing the visualization parameters
and previewing of the indicators at runtime. Additi-
onally, the participants pointed out that the feature of
mapping dataset to the input of analytics method and
then output of analytics method to the input of visua-
lization is a very strong feature which allow high end
indicator customization. However, the power of cus-
tomization can increase the complexity of the system
for non-technical users which is evident from the eva-
luation results.
6 CONCLUSION
In this paper, we proposed the goal - question - in-
dicator (GQI) approach for PLA that engages the
end users in a continuous inquiry-based LA process.
We presented the theoretical, design, implementation,
and evaluation details of an indicator engine compo-
nent of the open learning analytics platform (Open-
LAP) that illustrates the GQI approach in action by
supporting users in setting goals, posing questions,
and self-defining indicators that help them achieve
their objectives. The evaluation results are promising
and show high user satisfaction with the usefulness
and usability of the indicator engine. Additionally,
the evaluation revealed that OpenLAP has the poten-
tial to support a personalized learning analytics expe-
rience. Future work includes the implementation of
new analytics methods, visualization techniques and
improvements in providing recommendation for the
mapping which would guide end users through the in-
dicator generation process.
REFERENCES
Chatti, M. A. (2010). Personalization in technology enhan-
ced learning: A social software perspective. Shaker
Verlag.
Chatti, M. A., Muslim, A., and Schroeder, U. (2017). To-
ward an open learning analytics ecosystem. In Big
Data and Learning Analytics in Higher Education, pa-
ges 195–219. Springer.
Lukarov, V., Chatti, M. A., Th
¨
us, H., Kia, F. S., Muslim,
A., Greven, C., and Schroeder, U. (2014). Data mo-
dels in learning analytics. In Proceedings of DeLFI
Workshops, pages 88–95.
Muslim, A., Chatti, M. A., Bashir, M. B., Varela, O. E. B.,
and Schroeder, U. (2017). A modular and extensible
framework for open learning analytics. Journal of Le-
arning Analytics. (In review).
Muslim, A., Chatti, M. A., Mahapatra, T., and Schroeder,
U. (2016). A rule-based indicator definition tool for
personalized learning analytics. In Proceedings of the
Sixth International Conference on Learning Analytics
& Knowledge, pages 264–273, New York, NY, USA.
ACM.
CSEDU 2017 - 9th International Conference on Computer Supported Education
378
