
An Acceptance Empirical Assessment of Open Source Test Tools
Natasha M. Costa Valentim
1
, Adriana Lopes
1
, Edson César
1
, Tayana Conte
1
,
Auri Marcelo Rizzo Vincenzi
2
and José Carlos Maldonado
3
1
Universidade Federal do Amazonas (UFAM), Manaus, Amazonas, Brasil
2
Universidade Federal de São Carlos (UFSCar), Departamento de Computação, São Carlos, SP, Brasil
3
Universidade de São Paulo (USP), Instituto de Ciências Matemáticas e de Computação, São Carlos, SP, Brasil
Keywords: Acceptance Empirical Assessment, Test Tools, Open Source.
Abstract: Software testing is one of the verification and validation activities of software development process. Test
automation is relevant, since manual application of tests is laborious and more prone to error. The choice of
test tools should be based on criteria and evidence of their usefulness and ease of use. This paper presents an
acceptance empirical assessment of open source testing tools. Practitioners and graduate students evaluated
five tools often used in the industry. The results describe how these tools are perceived in terms of ease of use
and usefulness. These results can support software practitioners in the process of choosing testing tools for
their projects.
1 INTRODUCTION
The development of high quality software demands
development processes that include verification and
validation activities (Feldt et al., 2010). Among these
activities, software testing is widely used. Software
testing is a dynamic activity that aims to run the
product being tested with a subset of the input domain
(SWEBOK, 2004). The goal of software testing is to
expose failures arising from defects that the product
under test may contain. The identification of the input
values to be used, the execution and comparison of
the obtained results with those expected are laborious,
costly, and subject to errors when executed by the
testers without the support of a test tool. Moreover, it
is difficult to know if a given software product is
correct, i.e., if for any input data the software would
produce the expected results.
In order to minimize human intervention in these
stages and to make the test process repeatable at a
lower cost, different support tools were developed by
private companies and open software development
communities.
Considering the Java language, there is a high
number of support tools for different stages of the
testing process (Tahbildar et al., 2013). Thus, it is
relevant to investigate these tools in relation to their
acceptance by users. The research question is: given
the diversity of tools, which one presents high ease of
use and contributes positively to software testing?
Given these issues, such tools are expected to have a
high level of acceptance by software testers.
To answer this question, one can apply the
Technology Acceptance Model (TAM), proposed by
Davis (1989). TAM aims at evaluating the user's
perception regarding the Ease of Use and Perceived
Usefulness of a technology, that is, the basic
determinants of acceptance of a technology by its
users (Laitenberger and Dreyer, 1998).
In addition, in this paper we: (a) confirmed the
validity of the adapted TAM questionnaire that was
applied for evaluating the acceptance of these tools;
(b) presented criteria to support software practitioners
in the process of choosing test tools for their projects;
(c) identified challenges and gains that can be taken
into account in future evaluations, considering similar
contexts.
The remaining sections of this paper are organized
as follows: Section 2 presents the theoretical basis of
software testing and TAM. Section 3 presents the
evaluated test tools and how the technology
acceptance model was applied in the evaluation of the
test tools. Section 4 presents the results analysis of
applying TAM questionnaires. Finally, Section 5
discusses the final considerations of this paper and
future work.
Valentim, N., Lopes, A., César, E., Conte, T., Vincenzi, A. and Maldonado, J.
An Acceptance Empirical Assessment of Open Source Test Tools.
DOI: 10.5220/0006319603790386
In Proceedings of the 19th International Conference on Enterprise Information Systems (ICEIS 2017) - Volume 2, pages 379-386
ISBN: 978-989-758-248-6
Copyright © 2017 by SCITEPRESS – Science and Technology Publications, Lda. All rights reserved
379

2 BACKGROUND
2.1 Software Testing
As defined by Roper (1994), testing is sampling, i.e.
testing is about executing the software product with a
subset of its domain input and evaluating whether it
behaves accordingly to the specification for that
sample, assuming, therefore, that it will behave
appropriately for the rest of the domain input. This
assumption is valid only if the chosen elements are
representative of the input domain. To select these
elements, test criteria are used. The test criteria are
grouped in test techniques according to the
information source that is analyzed to derive the test
requirements. For example, functional technique
criteria are based on the requirements’ specification
to derive elements that will be covered by the tests. In
contrast, the structural technique criteria are based on
the implementation’s internal structure to derive the
test requirements (Debbarma et al., 2013).
The test criteria are responsible for indicating
when to stop the tests, providing the requirements that
the test set must satisfy. It is ideal to combine criteria
from different techniques to obtain good quality test
sets (Zhu et al, 1997).
Despite its importance, software testing is
considered one of the costliest steps in the software
development process, and can exceed 50% of the total
cost of the project (Delahaye and Bousquet, 2015). In
general, the majority of authors involved in this
research area agree that both time and cost of testing
process should be reduced. This can occur as a result
of changes in existing methodologies and by the
automation of costly test process activities.
In order to reduce the complexity of the tests, they
are performed in different phases: unit, integration,
system and acceptance (Naik and Tripathy, 2008). In
each phase, software testing focuses on identifying
different types of defects; the earlier a defect is
identified the cheaper to correct the defect will be
(Boehm and Basili, 2001).
2.2 The Technology Acceptance Model
What causes people to accept or reject a technology?
Among the many variables that can influence the use
of technology, two are especially important:
Perceived Usefulness and Perceived Ease of Use
(Davis, 1989). According to Davis (1989), people
tend to use or refuse to use a technology according to
the extent they believe that the technology will help
them do their job better (Perceived Usefulness – PU).
Moreover, even if potential users believe that a
particular technology is useful, they may, at the same
time, feel that it is too difficult to use and that benefits
of its use in their performance are offset by the effort
of using it (Ease of Use – EU).
In general, TAM defines the Perceived Usefulness
construct as the degree that a person believes that a
given technology can improve their performance at
work. A system with high Perceived Usefulness is
one for which a user believes in the existence of a
positive relationship between the use and
performance of the system. The Ease of Use construct
is defined as the degree to which a person believes
that using the specific technology would be effortless.
An application that is easier to use than others is more
likely to be accepted by users. The reason for
focusing on these constructs is that these aspects are
strongly correlated with user acceptance of
technology (Davis, 1989).
TAM has been widely applied in evaluating
technologies, producing reliable results when the user
has been working with the technology for some time
(Steinmacher et al., 2016). King and He (2006) report
the results of a meta-analysis of 88 TAM studies
supporting the validity and robustness of the
instrument with a large number of applications.
2.3 Evaluation of Automated Test
Tools
Monier and El-mahdy (2015) presented a feasibility
study for commercial and open source web testing
tools helping developers or users to pick the suitable
tool based on their requirements. Some features were
used for the evaluation process to distinguish the
capability of each tool versus others, such as: cross
platforms (to what degree tool support operating
system); script-language (programming language
used to edit or create testing scripts); programming
skills (require programming skills or based on
predefined steps); and report generation (effective
analysis for test script).
Sharma and Angmo (2014) presented various web
testing tools. To choose the best tool for a task, issues
like ease of integration were considered and weighed
against the cost and performance. In addition, the tool
needed to be compatible with the design and
implementation of an application.
These studies present a discussion about
assessment of test tools from the technical
perspective. We have noticed the absence of studies
that address an evaluation of test tools from the
perspective of user’s acceptance. Thus, this work fills
this gap by seeking to understand the acceptance of
users when using test tools.
ICEIS 2017 - 19th International Conference on Enterprise Information Systems
380
3 EMPIRICAL EVALUATION OF
THE TEST TOOLS
To support the application of software testing criteria
or to facilitate the collection of data regarding the
quality of software products, different tools have been
developed. During the year 2015, a 230 hour
Software Test Automation course was taught in the
city of Manaus. The course included training and
qualification in theoretical and practical aspects of
software testing with emphasis on the automation of
the test process
1
.
Industry practitioners and graduate students
attended this course. The participants had different
degrees of experience in software testing in the
industry (ranging from 2 to 10 years of experience).
Most of practitioners had previous experience with
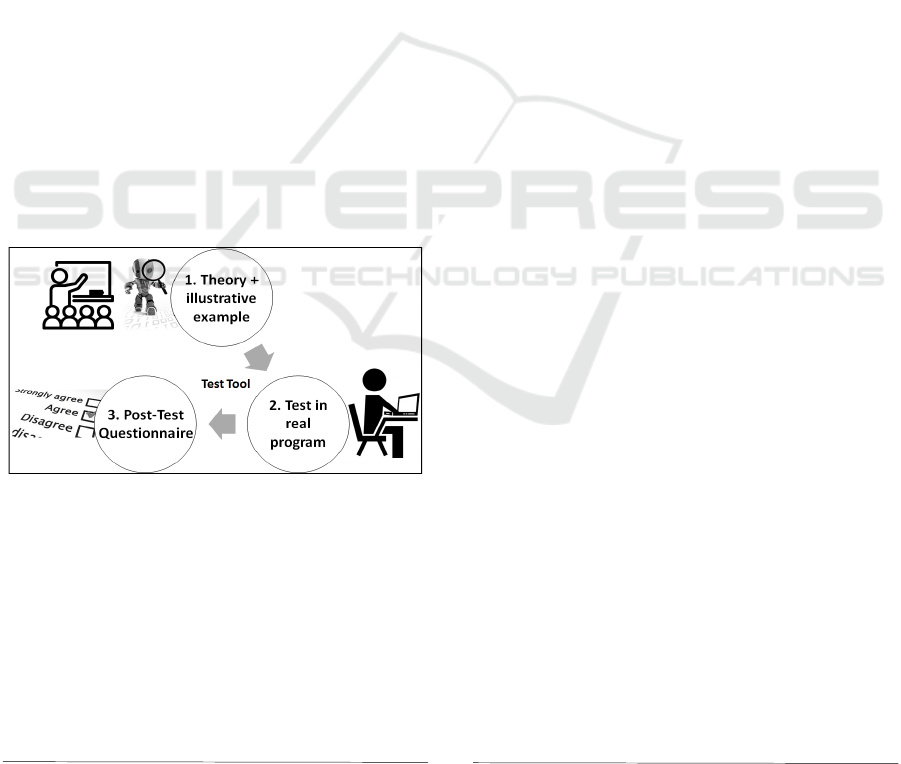
test tools. During the course, the participants gained a
solid technical background (knowledge in planning,
designing and documenting test cases). In each of the
course topics, the participants learned about the
theory and used a support tool in an illustrative
example (Figure 1 – item 1). After, they applied the
tool for testing a real program (Figure 1 – item 2). At
the end of the use of the tool and before changing
topics, the participants answered a Post-Test
Questionnaire, which will be discussed in Section 4
(Figure 1 – item 3).
Figure 1: Class method for each test tool.
Several tools were used, each addressing a
specific goal related to some test criterion or quality
metric. During the selection of tools, we prioritized
the use of open source tools. After, we prioritized
tools easily integrable with the Eclipse IDE. The
following open source test tools were analyzed:
JUnit
2
(JU): a framework to support the automated
execution of test cases. This tool was created to
support the development of unit tests. It is now
1
http://napsol.icmc.usp.br/ats
2
http://junit.org
3
http://www.eclemma.org/
used with other frameworks to support automated
test execution in the integration and system
phases. In the course, this tool was employed to
support the execution of functional tests in the unit
test phase;
EclEmma
3
(Ec): a plug-in that supports the use of
the Emma tool within the Eclipse IDE. This tool
allows verifying which parts of the code have
been executed by the test set after running the test
set in JUnit format;
JaBUTi
4
(Ja): a tool to support control and data
flow criteria in Java programs. This tool has a
similar goal when compared to EclEmma, but
supports more rigorous testing criteria. However,
it is not integrated with the Eclipse IDE which
makes its use difficult. In addition, the data flow
criteria are more complex and rigorous than the
control flow criteria;
MuJava
5
(MJ): It is a tool to support mutation
testing for Java programs. The mutation test is
considered a very rigorous test criterion and is
also widely used in experimentation to simulate
failures that may occur in the context of a
particular programming language. In the case of
MuJava, it has a set of mutation operators that
represent common defects that occur in Java
classes and methods;
Sonar
6
(So): It is a platform that integrates a series
of tools for the computation of static and dynamic
metrics of a software product. Among the set of
supported metrics, one can name: technical debt,
object-oriented metrics such as cohesion and
coupling, code duplications, types of warnings
emitted by static parsers, code coverage,
cyclomatic complexity, among others.
In order to evaluate the acceptance of the test
tools, we applied TAM based questionnaires. The
conceptual definitions of PU and EU were considered
to generate statements for each construct, based on
Davis (1989). Thus, the statements related to the PU
and EU constructs were adapted to the context of test
tools in the Post-Test Questionnaire, i.e., a
complement was added related to the purpose of the
tool. Table 1 presents the set of statements for the
TAM-based evaluation of test tools.
The participants of this evaluation were
participants of the Software Test Automation course,
who were invited to answer the Post-Test
Questionnaire expressing their perception regarding
the tools after using each of them.
4
http://ccsl.icmc.usp.br/pt-br/projects/jabuti
5
https://cs.gmu.edu/~offutt/mujava/
6
http://www.sonarqube.org/
An Acceptance Empirical Assessment of Open Source Test Tools
381

Table 1: Statements for the TAM-based evaluation.
The participants provided their answers on a six-
point scale, based on the scale applied by Lanubile et
al. (2003) and Babar et al. (2007). The possible
answers were: totally agree, strongly agree, partially
agree, partially disagree, strongly disagree, and
totally disagree. This scale was considered
appropriate because there is no middle value, that is,
it helps to avoid the bias of central tendency in
classifications, forcing the evaluators to judge the
technology as adequate or not (Johns 2005, Calefato
et al., 2010).
Through the Post-Test Questionnaire, it was
possible to analyze the degree of acceptance of the
participants of the tools for the two TAM constructs.
4 ANALYSIS AND DISCUSSIONS
Before presenting the results, we should evaluate the
reliability of the adapted statements in the Post-Test
Questionnaire and the validity of the measured
factors. This was done to verify if, in our context, the
instrument used (Post-Test Questionnaire) provided
reliable and valid results.
As not all participants were present in all classes,
we had a different number of participants using the
test tools. Therefore, there were 18 participants using
the EclEmma tool, 17 using the JaBUTi tool, 19 using
the JUnit tool, 17 using the MuJava tool and 15 using
the Sonar tool. For the reliability and factor analysis,
we considered the total number of participants who
used all test tools.
All participants were considered, because one of
the reasons that explain the failure of a factor analysis
is the insufficient sample size (Field, 2013). A small
sample may not accurately reflect the
interdependence structure of the data.
The reliability analysis was performed to
guarantee the internal validity and consistency of the
assumptions used for each factor. A reliability level
of the Cronbach Alpha statistical test that exceeds a
threshold of 0.8 indicates a reliable measure
(Carmines and Zeller, 1979).
The Cronbach Alpha values for each test tool are
presented in Table 2 with respect to the Perceived
Usefulness and Perceived Ease of Use items,
respectively. All the results were above 0.8, showing
that the Post-Test Questionnaires for each test tool
were reliable instruments.
The validity of the factors was performed with a
factor analysis. In this evaluation, the questionnaire
was used to assess whether the statements used in the
questionnaire formed two distinct constructs, which
would be interpreted as constructs of Perceived
Ease of Use (EU)
E1 - It is easy to learn how to use the tool
E2 - I find it easy to get the tool to do what I want it to
do
E3 - My interaction with the tool is clear and
understandable
E4 - It was easy to gain skills in using the tool
It is easy to remember how to use the tool to…
E5-Ec - carry out structural control flow tests
E5-Ja - carry out structural control and data flow tests
E5-JU - carry out a test
E5-MJ - carry out mutation tests
E5-So - evaluate software product metrics
E6 - I find the tool to be easy to use
Perceived Usefulness (PU)
The tool allowed me...
P1-Ec - to carry out control flow tests faster
P1-Ja - to carry out control and data flow structural
tests faster
P1-JU - to test Java programs faster
P1-MJ - to carry out mutation tests in Java programs
faster
P1-So - to store software product metrics faster
Using the tool improves my performance in the...
P2-Ec - execution of structural control flow tests
P2-Ja - execution of structural control and data flow
tests
P2-JU - execution of tests (I believe I have encountered
a higher number of errors or failures in a Java program
than I would have identified without using the JUnit
tool)
P2-MJ - execution of mutation tests (I believe I have
encountered a higher number of errors or failures of a
Java program than I would have identified without
using the MuJava tool)
P2-So - storage of software product metrics
Using the tool facilitated carrying out the...
P3-Ec - control flow structural tests
P3-Ja - control and data flow structural tests
P3-JU - tests
P3-MJ - mutation tests
P3-So - storage of software product metrics
Using the tool facilitated the...
P4-Ec - execution of structural control flow tests
P4-Ja - execution of structural control and data flow
tests
P4-JU - documentation and management of test cases
P4-MJ - execution of mutation tests
P4-So - quality analysis of software products based on
software product metrics
I consider the tool useful to...
P5-Ec - carry out structural control flow tests
P5-Ja - carry out structural control and data flow tests
P5-JU - test java programs
P5-MJ - carry out mutation tests in Java programs
P5-So - store software product metrics
ICEIS 2017 - 19th International Conference on Enterprise Information Systems
382

Usefulness and Ease of Use. Laitenberger and Dreyer
(1998) report that the threshold level for factor
loading is 0.7, which establishes the degree of
relationship between the item and the factor extracted
by the factor analysis.
Table 2: Reliability evaluation of the questionnaires.
Perceived Usefulness Ease of Use
EclEmma
0.940 0.965
JaBUTi
0.914 0.941
JUnit
0.887 0.851
MuJava
0.957 0.971
Sonar
0.963 0.973
Table 3 presents the results of the factor analysis
of the TAM adapted statements for all tools. The
results for Perceived Usefulness, statements P1 to P5,
are associated with the first factor (P) for the
EclEmma, JaBUTi, and Sonar tools. Therefore, this
factor was interpreted as Perceived Usefulness. The
results for Ease of Use, statements E1 to E6, are
associated with the second factor (E) for the JUnit and
MuJava tools. Therefore, this factor was interpreted
as Ease of Use.
In addition, Table
3 shows that some values of the
factor loading have the threshold below 0.7.
However, since these loadings are higher in one factor
than the other, in this case it was attributed to this
higher factor, following common practice from other
reports in the literature (King and He, 2006; Babar et
al., 2007).
Therefore, the adapted TAM questionnaires that
were applied for evaluating the acceptance of these
tools can be considered valid. Moreover, theses
questionnaires can be taken into account in future
evaluations, considering similar contexts.
The following subsections present the
participants’ perceptions regarding each tool.
4.1 Perception Regarding Eclemma
In Figure 2, statements E1-Ec to E6-Ec present the
participants’ perceptions regarding the Ease of Use of
EclEmma Tool. The code PXX in this analysis refers
to the Participant of number XX. The results show
that the participants agreed with the statements E3-Ec
and E6-Ec. Participant P02 stated that the EclEmma
tool “...certainly facilitates and greatly assists the
software testing practitioner”.
Between statements E1-Ec to E6-Ec there were
two disagreements related to the statement E2-Ec.
Participant P10 stated: "I agree that it is easy to use
the tool, but I had difficulties in using it in
practice…". This difficulty of use may have occurred
due to the configuration of the computer in which the
participant was using the tool. In addition, participant
P09 indicated that “The main problem was trying to
do the coverage using a .war or .ear...”. In this case,
the tool configuration must be performed in such a
way that the instrumentation process is controlled by
the used application server (Tomcat), which is not as
simple as using a tool such as Eclipse plug-in.
Statements P1-Ec to P5-Ec present the
participant’ perceptions regarding the Perceived
Usefulness of the EclEmma tool. Several participants
agreed with the statements P4-Ec and P5-Ec.
Participant P03 stated that “[EclEmma] is a great
tool. It has great usability and performance. It only
needs minor improvements in its functionality”. In
contrast, Participant P10 disagreed with the
statements P1-Ec and statement P2-Ec. This may
have happened because P10 did not correctly
understand the concepts of control flow test, or have
adopted another control flow tool that is easier.
4.2 Perception Regarding JaBUTi
In Figure 2, the statements E1-Ja to E6-Ja present the
participants’ perceptions regarding the Ease of Use of
the JaBUTi tool. These results suggest the
participants agree with the statements E2-Ja, E3-Ja
and E4-Ja. Participant P09 stated “I really enjoyed the
tool for running white box tests and I intend to use it
[in the company where I work]”.
In the statements E1-Ja to E6-Ja, there were 3
disagreements with respect to statement E1-Ja, 2 with
respect to statement E5-Ja and 1 regarding statement
E6-Ja. Regarding the configuration of the tool,
participant P06 stated “I had difficulty in configuring
the tool as well as understanding the color standards
used in the beginning”. This difficulty may have
occurred because JaBUTi does not work integrated as
an Eclipse plug-in, requiring that the user knows how
to use it. This is usually disguised by Eclipse,
through: the operation of class loading by the Java
Virtual Machine (JVM), and the procedure for
configuring the CLASSPATH variable, used by JVM
to find the third-party classes in which the application
under test relies on to run.
Statements P1-Ja to P5-Ja presents the
participants’ perceptions regarding the Perceived
Usefulness of the JaBUTi tool. There was no
disagreement with statements P1-Ja to P5-Ja. Some
comments from the participants on JaBUTi's
Perceived Usefulness were: “The tool is very useful
for carrying out software tests” (Participant P06) and
“The tool helps me to better understand what data
flow was being performed” (Participant P07).
An Acceptance Empirical Assessment of Open Source Test Tools
383
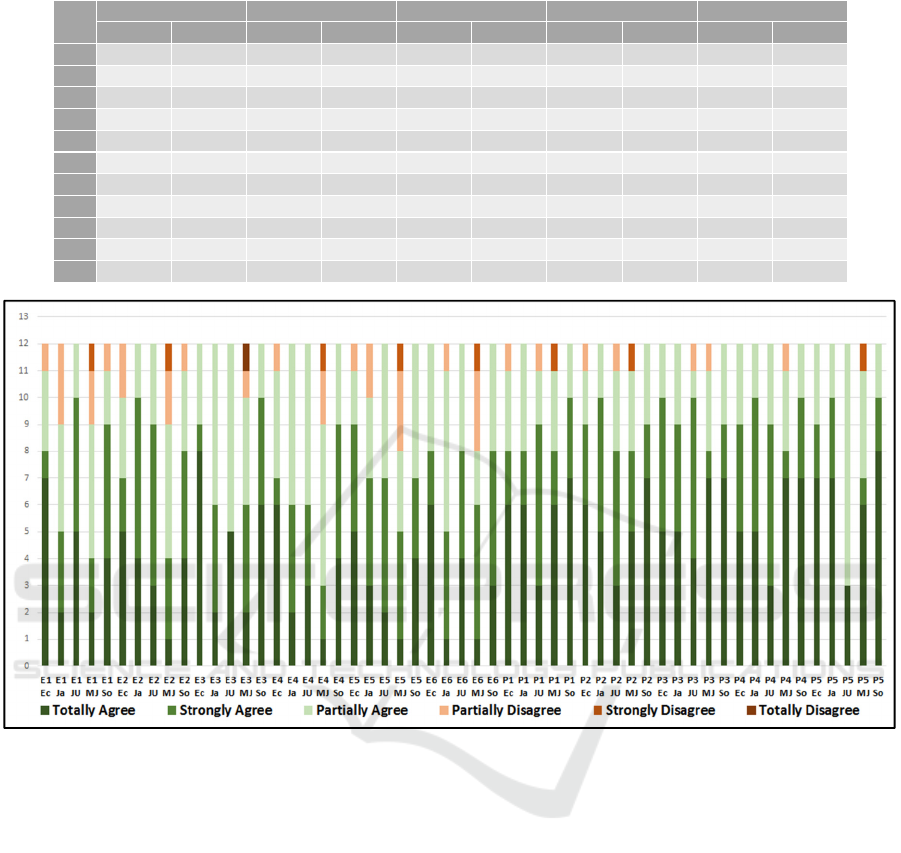
Table 3: Factorial validity for the TAM constructs.
EclEmma JaBUTi JUnit MuJava Sonar
P E P E P E P E P E
E1 0.773
0.528 0.154
0.894
0.193
0.894
0.448
0.762
0.354
0.859
E2
0.452 0.666
0.740
0.426 -0.012
0.869
0.446
0.713
0.550
0.768
E3
0.515 0.642 0.251
0.741
0.088 0.475 0.551
0.752
0.561 0.678
E4
0.357
0.911
0.400
0.771
-0.091
0.922
0.474
0.800
0.281
0.895
E5
0.483
0.783
0.170
0.879
-0.038
0.875
0.306
0.898
0.315
0.901
E6
0.208
0.927
0.298
0.887
0.231
0.725
0.349
0.877
0.234
0.927
P1 0.757
0.551
0.850
0.325
0.701
-0.125
0.838
0.482
0.938
0.303
P2 0.891
0.380
0.896
0.151
0.839
0.143
0.845
0.436
0.845
0.387
P3 0.839
0.324
0.905
0.219
0.817
0.068
0.879
0.402
0.826
0.440
P4 0.928
0.306
0.925
0.260
0.716
0.434
0.912
0.333
0.896
0.386
P5 0.869
0.324
0.785
0.205
0.837
0.025 0.687 0.589
0.932
0.201
Figure 2: Perceptions of participants on the tools.
4.3 Perception Regarding JUnit
In Figure 2, statements E1-JU to E6-JU show the
participants’ perceptions regarding the Ease of Use of
JUnit tool. There was no disagreement in any of the
statements about the Ease of Use of JUnit. P03 stated:
“This is an intuitive tool with great usability”.
Statements P1-JU to P5-JU presents the
participants’ perceptions regarding the Perceived
Usefulness of the JUnit tool. There was no
disagreement with statement P5-JU. Participant P12
stated that “The JUnit tool assists in identifying the
flaws by streamlining the process of specifying test
scenarios in a more agile way”. However, participant
P09 disagreed of statements P1-JU, P2-JU and P3-JU.
He indicated: “I do not agree with the items that state
that JUnit has improved my performance in testing,
and that JUnit has made it easier to test Java
programs even though the fastest test is always going
to be the manual test. However, at the unit phase, yes,
JUnit helps a lot in the execution of the tests”. This
may have happened due to the use of JUnit occurring
with relatively simple applications and in a single
version of the product. When a product is developed
incrementally and the size of the product grows with
each interaction, the development of the automated
unit testing is seen as necessary and of great
importance to ensure that the main parts of the
application are always tested after each
change/evolution.
4.4 Perception Regarding MuJava
In Figure 2, statements E1-MJ to E6-MJ show
participants’ perceptions about the Ease of Use of the
MuJava tool. In all these statements, there was more
than one participant disagreeing. There were four
ICEIS 2017 - 19th International Conference on Enterprise Information Systems
384

disagreements regarding statements E5-MJ and E6-
MJ. Participant P03 stated: “The tool has low
usability and is not intuitive. Although it works, I need
attention to achieve my goals”. Regarding statement
E4-MJ, participant P10 disagreed and indicated: “I
had difficulties in being able to use the tool. But I need
to gain more skill to use it…”.
Statements P1-MJ to P5-MJ presents the
perceptions of the participants regarding the
Perceived Usefulness of the MuJava tool. Several
participants agreed with the statements of this
construct. However, participant P12 stated that “In
the market we see the difficulty in applying this type
of test with this tool due to still depending on the
analysis of the equivalent mutants. Thus, automating
this process is unlikely. But its use helps a lot in the
perception of failures that may still happen and which
structural tests are not able to identify the problems”.
As quoted by participant P12, one of the difficulties
of applying mutation testing in the market is the
analysis of the equivalent mutants. This occurs when
creating a mutant, because it will not necessarily
represent a defect. It may be that the mutation
generates a program equivalent to the original
program, and in that case, regardless of the test
performed, the program and the equivalent mutant
will always produce the same results for any domain
input value.
It is possible to think in mutation test as being
a defect model, which can be used to evaluate the
quality of the test sets. Assuming that there are two
test sets T1 and T2, whose quality is to be evaluated,
when T1 and T2 are run against a set of mutants, the
equivalent mutants will remain alive for both T1 and
T2. Thus, the test set that kill more mutants can be
considered more effective at detecting defects
regardless of the analysis of the living mutants.
4.5 Perception Regarding Sonar
In Figure 2, statements E1-So to E6-So present the
participants’ perceptions regarding the Ease of Use of
Sonar. The participants agreed with the statements
E3-So, E4-So, E5-So and E6-So. Participant P03
indicated that “...it is possible to use it adaptively, it
has great usability and compatibility...”.
Among statements E1-So to E6-So there was only
one disagreement with the statements E1-So and E2-
So. Participant P07 stated: “...I found it a bit difficult
to set it up...”. This difficulty may be related to the
wide range of existing plug-ins for Sonar and the
large amount of data displayed on the dashboard.
Statements P1-So to P5-So present the
participants’ perceptions regarding the Perceived
Usefulness of the Sonar tool. There was no
disagreement with P1-So to P5-So. Participant P03
stated “The tool allows adaptation and
personalization while accomplishing its work in a
very effective and efficient way”.
5 CONCLUSIONS AND FUTURE
WORK
There are several tools that support test automation
using different test criteria or stages of the testing
process. Identifying which tool(s) has (have) high
ease of use and which tool contributes positively to
what it proposes is not a trivial task. In a course on
Software Testing and Automation, participants were
invited to evaluate some test tools using a Post-Test
Questionnaire based on the Technology Acceptance
Model (TAM). The obtained quantitative results
demonstrated that the use of TAM was effective to
evaluate the test tools, i.e. the Post-Test
Questionnaire used is reliable and valid. In addition,
the results demonstrated which tools were considered
easier to use and more useful. There was a great
acceptance by the participants regarding the Sonar
tool. The tool that obtained the greatest number of
disagreements with regards to the TAM constructs
was MuJava. This may have happened because, for
the participants, it was not intuitive.
A great advantage of acceptance evaluation of test
tools is to identify the difficulties of the participants
during the use of the tool. The improvement of the
tool in this sense could allow a competitive advantage
in the market in relation to other existing tools. That
is, when the participant disagrees that a tool is easy to
learn, means that it needs to be improved to become
more intuitive.
In every evaluation, there are threats that could
affect the validity of results (Wohlin et al., 2002). The
construct validity may have been influenced by the
measure that was applied in the user’ perceptions. We
alleviated this threat by using the measures that are
commonly employed in acceptance evaluations of a
technology: Ease of Use and Perceived Usefulness
(Laitenberger e Dreyer, 1998). In addition, a
reliability analysis was performed to ensure internal
validity and consistency of the statements used for
each measure. The main threat to the conclusion
validity was the size of the sample. The small number
of data points is not ideal from the statistical point of
view, but this is a known problem in studies of
Software Engineering (Fernandez et al., 2012). Not
all participants answered to the TAM questionnaire
An Acceptance Empirical Assessment of Open Source Test Tools
385

from all test tools. Therefore, we excluded these
participants from the final analysis, avoiding in this
way to make a biased evaluation.
The TAM questionnaires were incorporated into
the Moodle
7
project. This allows that other
researchers apply the Post-Test Questionnaires to
evaluate the acceptance of others tools. From this
initiative, we hope to contribute to the evolution and
improvement of software test tools, more specifically,
open source tools.
ACKNOWLEDGEMENTS
The authors are grateful to the participants who
applied the TAM questionnaire after using the test
tools. We would like to acknowledge the financial
support granted by CAPES, CNPq, FAPESP and
FAPEAM (process number 062.00578/2014).
REFERENCES
Babar, M.A., Winkler, D. and Biffl, S. (2007). “Evaluating
the Usefulness and Ease of Use of a Groupware Tool
for the Software Architecture Evaluation Process”. In
International Symposium on Empirical Software
Engineering and Measurement, pp. 430–439.
Boehm, B., Basili, V. R. (2001). “Software Defect
Reduction Top 10 List”. Computer, IEEE Computer
Society Press, v. 34, pp. 135 – 137.
Calefato, F., Lanubile, F., Minervini (2010), P. “Can Real-
Time Machine Translation Overcome Language
Barriers in Distributed Requirements Engineering?” In
IEEE International Conference on Global Software
Engineering, pp. 257-264.
Carmines, E. G., Zeller, R. A. (1979). “Reliability and
Validity Assessment”. In SAGE Pub., 72 pages.
Davis, F. (1989). “Perceived usefulness, perceived ease of
use, and user acceptance of information technology”. In
MIS Quarterly, v. 13, n. 3, pp. 319 – 339.
Debbarma, M. K., Debbarma, S., Debbarma, N., Chakma,
K., Jamatia, A. (2013). “A Review and Analysis of
Software Complexity Metrics in Structural Testing”. In
International Journal of Computer and Communication
Engineering, v. 2 (2), pp. 129-133.
Delahaye, M., Bousquet, L. (2015). “Selecting a software
engineering tool: lessons learnt from mutation
analysis”. In Software: Practice and Experience, v. 45,
n. 7, pp. 875 – 891.
Fernandez, A., Abrahão, S., Insfran, E., Matera, M. (2012).
“Further analysis on the validation of a usability
inspection method for model-driven web
development”. In Proceedings of International
7
http://napsol.icmc.usp.br/moodle/
symposium on Empirical software engineering and
measurement (ESEM), Lund, Sweden, pp. 153-156.
Feldt, R., Torkar, R., Ahmad, E., Raza, B. (2010).
“Challenges with Software Verification and Validation
Activities in the Space Industry”. In International
Conference on Software Testing, Verification and
Validation (ICST), pp. 225-234.
Field, A. (2013). “Discovering Statistics Using SPSS”. In
Sage Publications (CA), Edition 4, 915 pages.
IEEE Computer Society, SWEBOK, “A Guide to the
Software Engineering Body of Knowledge,” 2004.
Johns, R (2005). “One Size Doesn't Fit All: Selecting
Response Scales For Attitude Items”. In Journal of
Elections, Public Opinion, and Parties, v. 15 (2), pp.
237-264.
King, W. R., He, J. (2006). “A meta-analysis of the
technology acceptance model”. In Information and
Management. v.43 (6), pp. 740–755.
Laitenberger, O., Dreyer, H. M. (1998). “Evaluating the
usefulness and the ease of use of a Web-based
inspection data collection tool”. In International
Software Metrics Symposium, pp. 122–132.
Lanubile, F., Mallardo, T., Calefato, F. (2003). “Tool
support for Geographically Dispersed Inspection
Teams”. In Software Process Improvement and
Practice, v. 8, pp. 217–231.
Monier, M., El-Mahdy, M. M. (2015). “Evaluation of A
Guide to the Software Engineering Body of Knowledge
automated web testing tools”. In International Journal
of Computer Applications Technology and Research, v.
4 (5), pp. 405 - 408.
Naik, K., Tripathy, P. (2008). “Software Testing and
Quality Assurance: Theory and Practice”. In Wiley-
Spektrum, 1st Edition, 648 pages.
Roper, M. (1994). “Software Testing”. McGrall Hill, 149
pages.
Sharma, M., Angmo, R. (2014). “Web based Automation
Testing and Tools”. In International Journal of
Computer Science and Information Technologies, v. 5
(1), pp. 908 – 912.
Steinmacher, I., Conte, T. U., Treude, C., Gerosa, M. A.
(2016). “Overcoming Open Source Project Entry
Barriers with a Portal for Newcomers”. In International
Conference on Software Engineering, Austin, pp. 1-12.
Tahbildar, H., Borbora, P., Khataniar, G. P. (2013)
Teaching Automated Test Data Generation Tools for C,
C++, and Java Programs. In International Journal of
Computer Science & Information Technology
(IJCSIT), v. 5 (1), pp. 181-195.
Wohlin, C., Runeson, P., Höst, M., Ohlsson, M. C.,
Regnell, B., Wessl, A. (2000). “Experimentation in
software engineering: an introduction”. In Kluwer
Academic Publishers, 236 pages.
Zhu, H., Hall, P. A. V., May, J. H. R. (1997). “Software unit
test coverage and adequacy”. In ACM Computing
Surveys, v. 29 (4), pp. 366-427.
ICEIS 2017 - 19th International Conference on Enterprise Information Systems
386
