
Towards Integrated Infrastructures for Smart City Services: A Story of
Traffic and Energy Aware Pricing Policy for Charging Infrastructures
Upama Nakarmi and Mahshid Rahnamay Naeini
Department of Computer Science, Texas Tech University, Lubbock, TX, U.S.A.
Keywords:
Critical Infrastructures, Smart City, Integrated Framework, Probabilistic Modeling, Electric Vehicles,
Charging Infrastructure, Power Grid, Pricing Mechanism, Load Distribution.
Abstract:
Developing smart-city solutions and services, which lead to optimal utilization of cities’ limited resources and
enhancement of their reliability and efficiency, requires collaboration of currently vertical and isolated city
infrastructures. The interdependency among critical infrastructures makes such collaborative solutions even
more essential. In this paper, two of such critical infrastructures, including the electric-vehicle (EV) charging
infrastructure and the electric infrastructure, are considered and an integrated framework for modeling their
interactions are developed. This model is a probabilistic model based on a networked Markov chain frame-
work, which enables capturing of stochastic aspects of these two systems and how they affect each other.
Using the developed model and a proposed algorithm, which works hand in hand with the model, charging
prices are assigned for the EV charging stations with the goal of increasing the likelihood of having balanced
charging and electric infrastructures. The role of the cyber infrastructure in such collaborative solutions are
discussed through the charging and power infrastructure pricing scheme. The presented results show the im-
portance of integrated modeling and the pricing solution, which considers the state of both systems. We hope
that this study and modeling approach can be extended to other smart city solutions and other interdependent
infrastructures.
1 INTRODUCTION
Cities are key elements in developing resilient and
sustainable societies and nations. The global urban
population is expected to grow by 72% by 2050 ac-
cording to recent studies (Heilig, 2012). Such urba-
nization trend suggests the need for smarter solutions
for managing future cities. We believe one of the key
enablers of smarter solutions for cities is collabora-
tion and cooperation among various smart-city infra-
structures in order to optimize city services and so-
lutions. The importance of this cooperation is due to
the increasing interdependency among critical infra-
structures and the fact that the operation state of one
infrastructure can affect the operation of other infra-
structures. In this paper, we will focus on energy and
transportation critical infrastructures and discuss how
their cooperation can lead to a more reliable opera-
tion of the energy system and improve certain aspects
of transportation systems through one source of their
interdependency: the electric vehicles (EVs) charging
infrastructure. On the other hand, the cyber infra-
structure will play a key role in enabling such collabo-
ration and cooperation among infrastructures, while
also explicitly benefit from the reliable energy system
as the source of electricity.
The increase in the number of hybrid electric
transportation systems, including plugin hybrid EVs
and hybrid electric trains have introduced new inter-
dependencies between the energy and transportation
infrastructures (He et al., 2013), (Liu, 2012), (Rah-
man et al., 2014), (Hatton et al., 2009), (Lee et al.,
2015), (Recker and Kang, 2010), (Bass and Zim-
merman, 2013). For instance, vehicle-to-grid (V2G)
technology allow EVs to discharge their energy to
the power grid using bi-directional power electronic
dc/ac interfaces, which can help in stabilizing the po-
wer grid during disturbance and power shortage (Pil-
lai and Bak-Jensen, 2010), (Liu et al., 2011). Another
source of interdependency between energy and trans-
portation infrastructures comes from the EV charging
infrastructure. The EV charging infrastructures are
emerging in cities (Sioshansi, 2012) similar to the tra-
ditional gas stations. On one hand, in the charging
infrastructure, traffic patterns and population distribu-
tion can affect the energy demand in the electric grid
at various times and locations. On the other hand,
the demand on the energy grid can affect the char-
208
Nakarmi, U. and Naeini, M.
Towards Integrated Infrastructures for Smart City Services: A Story of Traffic and Energy Aware Pricing Policy for Charging Infrastructures.
DOI: 10.5220/0006303202080218
In Proceedings of the 6th International Conference on Smart Cities and Green ICT Systems (SMARTGREENS 2017), pages 208-218
ISBN: 978-989-758-241-7
Copyright © 2017 by SCITEPRESS – Science and Technology Publications, Lda. All rights reserved

ging price and consequently affect the traffic pattern
in the transportation system. Such interdependencies
are important as, for instance, during the peak-energy-
consumption hours, inappropriate energy pricing sig-
nals at charging stations that motivate EV users to use
specific charging stations, along with other factors,
can lead to energy demand profiles that result in in-
stability of the electric grid and in worse cases power
outages (Wagner et al., 2013). As such, it is essential
to design and operate these charging infrastructures
while considering the interdependency between elec-
tric and transportation systems and the state of these
systems. In particular, designing pricing incentives
can provide a controlling mechanism for interdepen-
dency and reliable operation of these systems. The
incentives will be communicated to the users through
the cyber infrastructure.
Since various aspects of the energy and transporta-
tion systems are dynamic and stochastic, in this paper
we adopt an abstract probabilistic approach to mo-
del the demand and traffic distribution in EV char-
ging infrastructures. The goal of the model is to iden-
tify incentives, when and where they are needed, to
design dynamic energy pricing signals based on the
state of both of the systems, such that the incentives
help in appropriate distribution of load in both sys-
tems and orchestrating their operation. The propo-
sed approach is based on the influence theory (Asa-
vathiratham, 2000), which is a mathematically trac-
table probabilistic framework based on a network of
Markov chains. This framework allows modeling of
interactions among components of both the charging
and the electric infrastructures based on a data-driven
dynamic probabilistic approach. Based on this pro-
babilistic model, we identify incentives in terms of
charging price using a topological sort on the active
influence graph of the charging infrastructure. The
identified incentives based on this model lead to hig-
her probabilities of stable and balanced systems.
2 BACKGROUND
In this paper, we review the related work in two main
categories. First, as the focus of this paper is on
charging infrastructures, we review efforts on diffe-
rent aspects of design, operation and optimization of
charging infrastructures. Second, we briefly review
work on modeling, simulation, operation and design
of integrated and interdependent infrastructure frame-
works for smart cities.
2.1 Charging Infrastructures
In recent years, a large body of work is focused on op-
timal placement of EV charging stations (Hess et al.,
2012), (He et al., 2013), (Wagner et al., 2013), (Sweda
and Klabjan, 2014), (Chen and Hua, 2014), (Guo and
Zhao, 2015), (Li et al., 2015), (Vazifeh et al., 2015),
(Xiong et al., 2015). In particular, optimization for-
mulations with various criteria have been used for ad-
dressing this problem (Hess et al., 2012), (Wagner
et al., 2013), (Li et al., 2015), (Guo and Zhao, 2015).
Examples of such criteria include, minimizing the trip
time of EVs to access charging stations (Hess et al.,
2012), maximizing the coverage of charging stations
(Wagner et al., 2013), minimizing trip and queuing
time (Li et al., 2015), and maximizing sustainability
from the environment, economics and society per-
spective (Guo and Zhao, 2015). In the work presented
in (Chen and Hua, 2014), (Vazifeh et al., 2015), the
set cover algorithm is used to optimize the location of
charging stations from a set of possible locations. In
addition, agent-based (Sweda and Klabjan, 2014) and
game-theoretic approaches (He et al., 2013), (Xiong
et al., 2015) have also been adopted in characterizing
optimal deployment of charging infrastructures. Re-
ference (Islam et al., 2015) presents a more detailed
review of various approaches used for the optimal de-
ployment of EV charging stations.
Another research aspect of charging infrastructu-
res is their pricing mechanisms. Studies of traditio-
nal fueling infrastructures (Walsh et al., 2004), (Weis
et al., 2010) show that the price of fuel impact the
behavior of drivers, which suggests that the charging
price for EVs can also impact the users’ choice and
behavior. Specifically, authors in (Xiong et al., 2016),
discuss that the optimal placement of charging sta-
tions will be insufficient to handle rapid changes in
traffic patterns and urbanization, hence an efficient
pricing model that also minimize the social cost of
traffic congestion and congestion at EV charging sta-
tions is needed. As another example, the impact of
energy price and the interplay between the price and
other factors, such as cost and emissions, on the char-
ging decisions have been studied in (Sioshansi, 2012).
Besides the studies on the impact of price on charging
decisions and traffic patterns, some efforts are focused
on designing and optimizing pricing and analyzing
their impact on the users’ behavior and the system
operation. Examples of such efforts include the work
presented in (Lee et al., 2015), which uses a game
theoretical approach to study the price competition
among EV charging stations with renewable power
generators and also discusses the benefits of having
renewable resources at charging stations. Similarly,
game-theoretic approaches that model a game bet-
Towards Integrated Infrastructures for Smart City Services: A Story of Traffic and Energy Aware Pricing Policy for Charging Infrastructures
209

ween the electric grid and their users, specifically for
EV charging, in order to design pricing schemes, have
been studied, for example in (Tushar et al., 2012). The
model in (Tushar et al., 2012) provides strategies to
EV chargers to choose the amount of energy to buy
based on a pricing scheme to operate the charging in-
frastructures at their optimal levels.
The work presented in this paper is closest to the
studies on pricing mechanism design and also the in-
terplay between the electric and EV charging infra-
structures. At the same time, it is different in the ap-
proach as it considers the stochastic dynamics of the
interdependent EV charging infrastructures and the
electric grid and their local interactions in designing
the charging prices at stations.
2.2 Integrated and Interdependent
Infrastructures for Smart Cities
The vision of smart cities has been described in diffe-
rent ways among practitioners and academia (Chou-
rabi et al., 2012). Hall (Bowerman et al., 2000) vi-
sions the smart city as a city that monitors and in-
tegrates conditions of all of its critical infrastructu-
res to optimize its resources and services to its ci-
tizens. Similar smart city visions has been descri-
bed in (Harrison et al., 2010), (Commission et al.,
2014). In the last decade a large body of work has
emerged in modeling and understanding interdepen-
dent infrastructures. The general concepts of interde-
pendencies among critical infrastructures, challenges
in modeling interdependent systems and their cont-
rol and recovery mechanisms have been intensively
discussed in (Amin, 2002), (Little, 2002), (Rinaldi,
2004), (Min et al., 2007). These works mainly dis-
cuss the intrinsic difficulties in modeling interdepen-
dent systems and suggest new methodologies for their
modeling and simulation as a single coupled system.
The majority of the integrated infrastructure modeling
has been focused on analyzing the reliability of cou-
pled systems and the negative aspects of the interde-
pendencies among critical infrastructures (Shao et al.,
2011), (Shin et al., 2014), (Das et al., 2014). The work
presented in the current paper is an effort to present an
abstract and unified framework to model interactions
among infrastructures, which can be used to design
various smart-city solutions based on the state of inte-
racting systems, for instance, the pricing mechanism
based on the state of the EV charging infrastructure
and the electric grid.
3 SYSTEM MODEL
In this section, we describe our system model for the
interdependent EV charging and energy infrastructu-
res; however, the model is adequately general to be
applied to any interdependent infrastructure with in-
teracting components. The schematics of the system
under study is depicted in Figure 1. As the figure
shows, our study considers three layers in the system:
(1) the power/electric grid layer, (2) the EV charging
infrastructure layer, and (3) the cyber layer, which
enables the collaborative solution for the pricing bet-
ween layer 1 and 2. Our modeling is mainly focused
on the electric and the EV charging infrastructures.
While the cyber layer is not a part of the theoreti-
cal model, we will discuss its key role in Section 3.1.
The interactions among the layers of this system can
be summarized as following. The EV charging in-
frastructure receives energy from the power grid and
thus the load on charging stations may affect the load
on power substations. The pricing scheme, which de-
pends on the state of both power and EV charging in-
frastructures, will be communicated through the cyber
layer to the users. Finally, the communicated price
will affect the load distribution over the charging in-
frastructure and subsequently the load on power sub-
stations.
First, let us present the system model for the
charging infrastructure. We denote the set of char-
ging stations in a region in the smart city by C =
{C
1
,C
2
,...,C
k
}. For simplicity, we assume that the
charging stations are distributed over a grid region
such that each cell in the grid holds one charging sta-
tion as shown in Figure1a). The charging stations are
connected over a directed graph G = (C ,E), where
E represents the set of directed links specifying the
possibility of travel between charging stations for the
users. For instance, e
i j
∈ E implies that users in the
cell containing the station C
i
can travel to station C
j
for charging. These links help specifying the con-
straints on the travel for charging, for instance, based
on the distance that the users are willing to travel and
the distance that a EV with the need for charging can
travel before it runs out of energy. We will explain
later that when the right incentives are applied then
there is a likelihood for each user to travel to other
stations with direct links. In this paper, we focus on
a graph, in which charging stations in adjacent cells
are connected. Other graphs with different topologies
can also be considered and will not change the model.
Next, we describe the power infrastructure layer.
In this paper and as the first step toward this mo-
deling, we simplify the intra-system model for the po-
wer infrastructure by only considering the power grid
substations denoted by S = {S
1
,S
2
,...,S
m
} and their
SMARTGREENS 2017 - 6th International Conference on Smart Cities and Green ICT Systems
210

Abstract
Substation
(b)
(a)
CYBER
POWER
TRANSPORT
Substation
Substation
Substation
Substation
Figure 1: Interconnected networks of electric/power, charging infrastructure and cyber infrastructure.
internal dynamics (as will be explained in Section
3.1). In other words, we do not focus on the com-
plete power grid model with generators and power li-
nes; instead we only focus on substations as abstract
and aggregated points of contact with the EV char-
ging infrastructure. In future, we will expand the mo-
del to capture more detailed internal interactions in
the power system. To model the inter-system inte-
ractions between the power and charging infrastruc-
tures we assume that multiple charging stations be-
long to the distribution network of one substation, as
such we consider a set of inter-system links denoted
by L, where L
i j
∈ L specifies that charging station C
i
affect the load of substation S
j
. In this model, C
i
∈ C
should have a link to one specific S
j
∈ S while each S
j
can have multiple incoming links from different ge-
ographically co-located charging station. Also, note
that there will be no links from S
j
to any node in C .
Such interactions and the effects of power substations
on charging stations will be indirectly through the in-
centives communicated by the cyber layer. Based on
the above discussion, the total integrated system can
be denoted by a graph as G
u
= (C ∪S ,E ∪L). Howe-
ver, the model for the system is not simply a graph.
Next, we will explain how each component in this
graph stochastically and dynamically evolves and in-
teracts with other components. We will specifically
present a model to capture such dynamics. We have
chosen a probabilistic approach for the modeling as
various aspects of this system is stochastic. For in-
stance, the state of a charging station (e.g., being busy
or not) varies probabilistically at different times of the
day and week and due to EV users mobility pattern
and behavior. The state of the load in a substation
also varies due to stochastic nature of the demand.
The interactions among components are also stochas-
tic and as components influence each other depending
on their state. For instance, if charging stations, which
have a link to substation S
j
, become busy and overlo-
aded with lots of demand then this increased demand
will increase the likelihood of S
j
to become overlo-
aded and hinder the stability of the power grid. In
such cases, we would like to distribute the load in the
system using pricing incentives to increase the wil-
lingness of EV users to travel to other charging stati-
ons. These stochastic interactions and dynamics will
be modeled in an Influence Theoretic framework as
explained next.
3.1 Influence Model for Integrated
Infrastructures
Here, we briefly review the Influence Model (IM) as
first introduced in (Asavathiratham, 2000), (Asavathi-
ratham et al., 2001) and present an IM-based frame-
work for modeling the integrated charging and power
infrastructures.
The IM is a framework consisting of a weighted
and directed graph of interconnected nodes, in which,
the internal stochastic dynamics of each node is re-
presented by a Markov Chain (MC) and the states of
the nodes varies in time due to the internal transitions
of MCs as well as the external transitional influen-
ces from other nodes. The weights on the directed
links represent the strength of influences that nodes
receive from one another. In the following, we put
the IM model in perspective with respect to the inte-
grated charging and power infrastructures. In our mo-
del, graph G
u
with two types of links and nodes (as
introduced in Section 3) will serve as the underlying
graph for the IM. To represent the internal dynamics
of nodes, we consider that the state of the charging
Towards Integrated Infrastructures for Smart City Services: A Story of Traffic and Energy Aware Pricing Policy for Charging Infrastructures
211

stations can be abstracted to three levels: (1) underlo-
aded, (2) normal, and (3) overloaded levels. As such,
we define a MC with state space of size three for each
C
i
∈ C . These states help describing the load (in terms
of energy demand) on a charging station at each time.
In general, the state of a C
i
may change due to de-
parture or arrival of EV users. On the other hand, we
model a substation S
j
with an internal MC, which has
two possible states: normal and stressed. These states
specify if a power substation is overloaded and stres-
sed or it is working under normal conditions. The
transition probability matrix of the internal MC for a
node, say node i ∈ C ∪ S , is denoted by A
ii
, which is
an m × m row stochastic matrix, where m is the size
of the state space. We use a data driven approach to
characterize the transition probabilities of these inter-
nal MCs based on datasets of system dynamics and
simulations as will be explained later. The links in
graph G
u
specify the influence relation among the no-
des. In particular, there are two types of influences
in our model: (1) when a charging station influences
another charging station, then it means there is a like-
lihood that it will send users (using proper incentives)
to the influenced station, and (2) when a charging sta-
tion influences a power substation, then it means that
there is a likelihood that the charging station increases
the energy load on the power substation to a level that
could change the state of the power substations (e.g.,
from normal to stressed). The weights on the links
also specify the strength of the influence. Specifically,
the influences among the nodes of the network is cap-
tured by the influence matrix denoted by D, where
each element d
i j
is a number between 0 and 1 repre-
senting the amount of influence that node i receives
from node j. The larger the d
i j
is the more influence
the node i receives from node j; with the two extreme
cases being d
i j
= 0 meaning that node i does not re-
ceive any influence from node j and d
i j
= 1 meaning
that the next state of node i deterministically depends
on the state of node j. Note that receiving influence
from a node itself, i.e., d
ii
, specifies how much the
state evolution of a node depends on its internal MC.
The total influence that a node receives should add up
to unity i.e.,
∑
n
j=1
d
i j
= 1, and therefore, matrix D is a
row stochastic matrix too.
In IM, the status of a node, say node i, at time
t is denoted by s
i
[t], a vector of length m, where m
is the number of possible states for the node. At
each time, all the elements of s
i
[t] are 0 except for
the one which corresponds to the current state of the
node (with value 1). In our model, s
i1
[t], s
i2
[t], and
s
i3
[t] correspond to overloaded, normal and underlo-
aded states, respectively, for charging stations. Simi-
larly, s
i1
[t] and s
i2
[t] correspond to normal and stres-
sed states for power substations, respectively. The sta-
tuses of all the nodes concatenated together as S[t] =
(s
1
[t]s
2
[t]...s
n
[t]) described the state of the whole sy-
stem in time t, where n = |C ∪ S | and |.| denotes the
cardinality of the set.
The influence matrix D specifies how much two
nodes influence each other. In order to specify how
the states of the nodes will change due to the influen-
ces, we also need state-transition matrices A
i j
, which
capture the probabilities of transiting to various states
due to the state of the influencing node. Matrix A
ii
represents the special case of self-influence, which is
described by the internal MC of the node. Note that
the A
i j
matrices are row stochastic. In the general
IM (Asavathiratham, 2000), the collective influences
among the nodes in the network is summarized in the
total influence matrix H defined as:
H = D
0
⊗ {A
i j
} =
d
0
11
A
11
··· d
0
1n
A
1n
.
.
.
.
.
.
.
.
.
d
0
n1
A
n1
··· d
0
nn
A
nn
, (1)
where D
0
is the transpose of the matrix D and ⊗ is
the generalized Kronecker multiplication of matrices
(Asavathiratham, 2000). Finally, based on the the to-
tal influence matrix H the evolution equation of the
model is defined as
p[t + 1] = S[t]H, (2)
where vector p[t + 1] describes the probability of va-
rious states for all the nodes in the network in the next
time step. Steady state analysis of IM has some simi-
larities with that of MCs and has been discussed for
various scenarios in (Asavathiratham, 2000), (Asava-
thiratham et al., 2001). For a more detailed discus-
sion on the IM please refer to (Asavathiratham, 2000),
(Asavathiratham et al., 2001).
The work in (Siavashi, 2016) extends the original
IM to a constraint or rule-based influence framework
such that the influences among the nodes can dynami-
cally get activated and deactivated depending on the
state of the system. Also, as explained in (Siavashi,
2016), influencing can change the state of the influ-
encer as well (transiting from overload to normal due
to sending load to another station). (Siavashi, 2016)
specifically defined a constraint matrix C, where the
entry c
i j
for i, j ∈ C ∪ S is a binary variable speci-
fying whether node i gets influenced by node j or not.
In particular, c
i j
= 1 indicates that node i gets influ-
enced by node j and c
i j
= 0 indicates otherwise. Mo-
reover, each node always influences itself based on
its internal MC (i.e., c
ii
= 1 for all i ∈ C ∪ S ). As
explained in (Siavashi, 2016), one can define the va-
lue of c
i j
according to boolean logic to capture the
rules of interactions in the network. In other words,
SMARTGREENS 2017 - 6th International Conference on Smart Cities and Green ICT Systems
212

c
i j
s are functions of the state of the nodes. For in-
stance, when a charging station in the EV charging
infrastructure is in overloaded state and based on G
u
it has a link to another station, which is underloaded,
the influence over that link should get activated to
motivate the EV users to travel from the overloaded
state to underload state. These types of rules can be
specified using boolean functions such as the follo-
wing examples. Function c
i j
= s
i3
s
j1
+ s
i2
s
j1
, where
i, j ∈ C specifies the rules that can be applied to the
transport layer of the model to show influences from
charging station j to charging station i. Specifically, a
transport node i will receive influence from transport
node j if node i is underloaded and node j is over-
loaded or if node i is normal and node j is overloa-
ded. Also, the power substations receive influences
from the charging stations because overloaded char-
ging stations can cause a power substation to go to
overloaded state. Example of boolean function des-
cribing this rule is c
k
= s
k1
∏
j∈C
S
k
s
ji
+s
k2
∏
j∈C
S
k
s
ji
,
where k ∈ S and ∈ C and C
S
k
⊆ C is the set of
charging stations connected to the power substation
k. Specifically, a power substation, say k will receive
influence from charging station when all the char-
ging stations connected to the power substation are
overloaded. As a power station is generally built with
a capacity to accommodate large demand, the power
substation will go to a stressed state provided that all
the influence links connected to it are activated. This
is just one example of influence rule and other condi-
tions to specify the rules are also possible.
Note that as the goal of the integrated study of
these two systems is to increase the probability of ha-
ving power substations in normal conditions and char-
ging stations not overloaded, the interaction rules de-
fined in C should support this goal. In order to achieve
this goal the influences among the charging stations
should be engineered such that it forces the whole
system toward desirable states. The second type of
influence, which is from the charging station to po-
wer substations cannot be engineered and we assume
that when the charging stations, which are receiving
energy from a substations, are overloaded they influ-
ence (increase the likelihood) the substation to transit
to a stressed state.
In (Siavashi, 2016), the constraint matrix C
and the influence matrix D are used to define the
constraint-based influence matrix denoted by E, as
E = D ◦ C + I ◦ (D × (1 − C
0
)), (3)
where ◦ is the Hadamard product (aka entrywise pro-
duct), 1 is the matrix with all elements equal to 1 and
C
0
is the transpose of matrix C. Using E, the IM-
based state evolutions can be summarized as
H = E
0
⊗ {A
i j
}, (4)
and p[t + 1] = S[t]H.
As discussed in (Siavashi, 2016), this formulation
may or may not allow the asymptotic analysis of the
behavior of the system. However, no matter if the ana-
lytical solution of the model exists or not, this model
can be used for Monte-Carlo simulation of the beha-
vior of the system in order to study how influences
and interactions affect the state of the whole system.
Based on this formulation, as the state of the system
varies in time, various sets of influences get activated.
Note that in IM, when a node influences another node,
it may result in state change for the influenced node
based on the adjusted transition probabilities that are
captured through H and the formulation of p[t + 1].
As such, an activated influence in our model increa-
ses the probability of transitioning to a normal state
for an underloaded charging station due to receiving
load from the influencer (based on our definition of
influence). In real-world, proper incentives for the
users are needed to make that influence occur (trans-
fer of load from one charging station to another). As
such, to achieve the goal of the system which is incre-
asing the probability of normal states, we use the sta-
tus of the influence links (active or inactive) to guide
the charging price design. In the next section, we ex-
plain how this model will help in designing proper
prices and together with the rules of interactions can
lead to more balanced system for both EV charging
and power infrastructures.
4 MECHANISM FOR DESIGNING
CHARGING PRICE AT EV
CHARGING STATIONS
The model described in the previous section needs an
external factor in real-world scenarios to provoke an
EV user to travel from one charging station to another
for charging (i.e., activating the described influence
between charging stations in real-world). This exter-
nal factor can be in terms of incentives or hampers
that an EV user may get if they move from one cell
to another. A good incentive would be lower char-
ging prices (whenever the influence should be active)
in the station, which should receive some load. The
lower prices can motivate the EV users to move from
their currently occupied cell to the other station. Ho-
wever, not every EV user will respond to such incen-
tives in the same way and thus not every user will
travel from the first cell. Particularly, the probabilistic
nature of the IM helps in capturing the random beha-
vior of the users. Intuitively, the higher the influence
strength the more we expect that the users travel to
Towards Integrated Infrastructures for Smart City Services: A Story of Traffic and Energy Aware Pricing Policy for Charging Infrastructures
213

the other station, which can help in characterizing the
price reduction that is needed. A key point to notice is
that the cyber layer plays a key role in letting the de-
sired influences to occur to let the system identify its
next states based on IM. Specifically, the cyber layer
should communicate the lower charging price only to
the users in the cell that is influencing the station. Ot-
herwise, if the reduced price is communicated in the
system globally and all the EV users in the city know
about the reduced price in a station, this will activate
influences among neighbor stations (neighbors are de-
fined as according to G
u
) that should not be activated
according to the IM model. Thus, in order to only
activate the influences that the IM model identifies for
leading the system to a more balanced system in each
step, the cyber layer plays a key role in communica-
ting the prices to the right EV users based on their
location.
Algorithm 1: Algorithm for Price Assignment to Char-
ging Stations.
1: Input Graph of active
influences, G
t
(C ,E
a
(t)). A maximum electricity
price limit A and a reduction factor in price, α.
2: Output Charging price in each charging
station in C such that the price of the influencer
station is higher than the influenced station.
3: Calculate the topological sort T for G
t
.
4: for i=1 to |C | do
5: if |I(T(i))| = 0 then
6: Price(T(i)) = A
7: else
8: Price(T(i))=
∑
j∈I(T(i))
Price( j)/|I(T(i))|
9: end if
10: end for
11: Return Price.
In our model based on IM, whenever the set of
activated influence links varies, we need to identify
new set of prices for each station such that if station
say i has an active influence link to station j, then the
price at station i should be higher than that of station
j. To identify the set of prices that satisfy this con-
dition in the whole system, we propose the algorithm
presented in Algorithm 1. This algorithm is similar
to a constrained graph coloring problem. However,
the problem of price assignment to the stations based
on the above constraint is solvable with complexity
O(|C | + |E|), which is because the graph of active in-
fluences denoted by G
t
(C ,E
a
(t)) and obtained from
simulation of IM at step t is a directed and acyclic
graph (note that E
a
(t) ⊆ E , also note that E
a
(t) does
not include self-influences as they do not affect the
pricing). This property is due to the rule set with the
goal of balancing the load in the system, which ne-
ver result in a cycle in the graph of active influences.
In other words, the rule set in the model is very im-
portant to ensure that the load is not circulating in the
system and purposely directed to the proper charging
stations. Algorithm 1 for price assignment uses a to-
pological sort of the graph and then assigns the prices
based on the identified order such that the prices ens-
ure that the stations appearing later in the topological
sort have lower prices (as they should receive influen-
ces or loads). In our algorithm, we consider a maxi-
mum price limit of A and each price reduction occurs
by a constant α. The values of A and α are conside-
red fixed in this paper for simplicity, but can be varia-
ble and adjusted based on other factors in the system.
In this algorithm, function I(.) receives a node and
returns the set of nodes, which influences the input
node.
5 EVALUATION AND RESULTS
In order to demonstrate the process of assigning pri-
ces to the charging stations dynamically as the system
evolves in time while trying to lead both systems to
more balanced states, we use an example network as
shown in Figure 2 with 12 charging stations, which
receive their energy from two power substations. In
this example, we used a data driven approach to ex-
tract some of the parameters of the IM using available
data sets of traffic information. Specifically, we used
the taxi data in (Piorkowski et al., 2009), which con-
tained GPS trajectories of 536 taxis in San Francisco,
California from May 17, 2009-July 10, 2009 specifi-
cally to estimate A
ii
s. An example of A
ii
based on the
dataset is as following, where rows and columns are
ordered from overload to normal and then underload:
A
ii
=
0.89473684 0.1052632 0.00000000
0.07262570 0.8770950 0.05027933
0.07142857 0.2142857 0.71428571
.
(5)
In addition to A
ii
s, which characterize the internal dy-
namics of each station, we also need to consider A
i j
s
to specify how the influences between two stations re-
sult in state transitions. An example of A
i j
is shown
in (6) in which each column specifies the probability
of transition to overload, normal, and underload, re-
spectively, depending on each row, which specifies
the state of the influenced node. For simplicity and
due to lack of detailed information in the datasets to
characterize this matrix for all cells, we have simpli-
fied this matrix to have equal transition probabilities
independent of the state of the influenced node (i.e.,
the same rows). Based on our model and the rules of
SMARTGREENS 2017 - 6th International Conference on Smart Cities and Green ICT Systems
214

influences, in order to lead the systems to balanced
states a station only tries to send load to another sta-
tion if the other station is not overloaded. As such the
last row of the matrix in (6) does not play a role in the
analysis.
A
i j
=
0.2 0.5 0.3
0.2 0.5 0.3
0.2 0.5 0.3
. (6)
Similarly, an example of A
ii
for power substations
is as following where rows and columns are ordered
from normal to stressed:
A
ii
=
0.8 0.2
0.5 0.5
. (7)
Since the detailed dynamics of the power grid is not
considered in this paper, we only focus on how their
state change when they are stressed by charging stati-
ons. But to consider the effects of internal dynamics
of the power grid, we consider a small probability that
a power substation changes state from normal to stres-
sed due to different parameters in the system other
than the charging stations (here this value is chosen to
be 0.2). When the system is stressed (i.e., the second
row on the matrix in (7)) then we assume there is an
equal chance to get into normal state or stay stressed
based on internal dynamics. However, as a part of
influences in our IM-based model whenever the char-
ging stations go back to normal or underloaded states
then they can externally help the power substation to
transit back to the normal state. Specifically, the set of
rules for this study can be described as: (1) node i gets
influenced by node j if and only if node i is underlo-
aded and node j is overloaded or node i is in normal
state and node j is overloaded for charging stations,
and (2) for the influences between the power substa-
tions and the charging stations, the power substation
gets influenced by a charging station if the power sta-
tion is normal and the charging stations receiving po-
wer service from the substation are overloaded or if
the power substation is stressed and the charging sta-
tions are normal or underloaded.
As mentioned earlier, based on the state of the
components in the system, the influences among no-
des may get activated and deactivated. In Figure 3, we
show two samples of active influence graphs for the
network shown in Figure 2. The activated links bet-
ween charging stations suggest that the load should be
transferred from one station to the station on the end
of the directed link.
The set of activated influences in each iteration
prompts a change of state in the charging stations and
power substations as shown in Figures 4 and 5. Spe-
cifically, Figures 4a, 4b and 4c show the distribution
1
2
3
4
5 6
7
8
9
10
11
12
14
Transport Nodes
Initial State
Substation
13
Substation
Figure 2: The integrated charging and power infrastructures
model with 12 charging stations and two substations (i.e.,
graph G
u
).
1
2
3
4
5 6
7
8
9
10
11
12
14
Transport Nodes
Iteration 34
Substation
13
Substation
1
2
3
4
5 6
7
8
9
10
11
12
14
Transport Nodes
Iteration 477
Substation
13
Substation
Figure 3: Two samples of active influence graph.
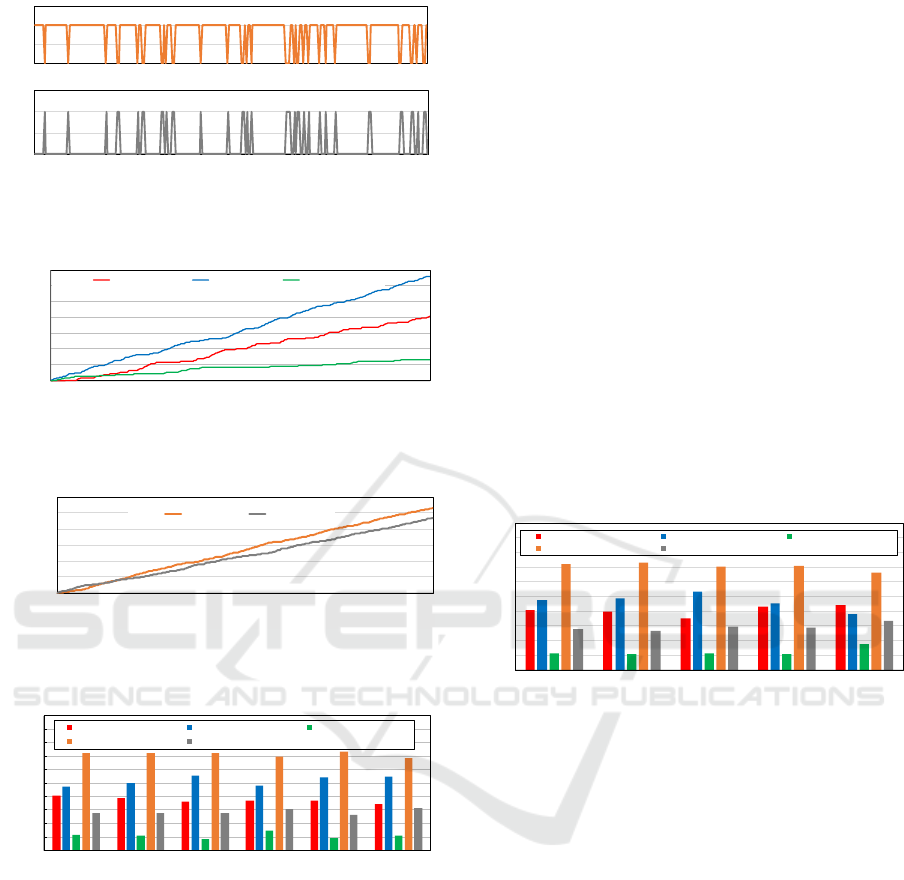
of the number of charging stations in underload, nor-
mal and overload states in each iteration respectively.
Although the distributions are fluctuating but it can
be observed from Figures 6 and 7 that the aggregated
behavior of the system is independent of the initial
state of the system as the likelihood of normally loa-
ded charging stations and normal power substations is
higher than other states. The results in Figures 8 and
9 are obtained over 1000 steps of the IM simulation.
Figure 8 shows the state distribution of the charging
stations and power substations with various initial sta-
tes.
0
5
10
15
(a)
0
5
10
15
(b)
0
5
10
15
1
21
41
61
81
101
121
141
161
181
201
221
241
261
281
301
321
341
361
381
401
421
441
461
481
(c)
Figure 4: Number of charging stations in each iteration in:
(a) underloaded, (b) normal, and (c) overloaded, states.
An important aspect of the influence model is the
set of rules that specify how the nodes should interact
and influence each other. To show how the rules of the
interactions affect the behavior of the system, here,
we have considered other influence rules similar to
the rules of interactions defined in (Siavashi, 2016) as
Towards Integrated Infrastructures for Smart City Services: A Story of Traffic and Energy Aware Pricing Policy for Charging Infrastructures
215
0
1
2
3
(a)
0
1
2
3
1 21 41 61 81 101 121 141 161 181 201 221 241
(b)
Figure 5: Number of power substations in each iteration in
various states: (a) normal state, and (b) stressed state.
0
1000
2000
3000
4000
5000
6000
7000
1
41
81
121
161
201
241
281
321
361
401
441
481
521
561
601
641
681
721
761
801
841
881
921
961
Overload
Normal
Underload
Figure 6: Aggregated states distribution for overloaded,
normal and underloaded states for charging stations.
0
200
400
600
800
1000
1200
1
41
81
121
161
201
241
281
321
361
401
441
481
521
561
601
641
681
721
761
801
841
881
921
961
Normal
Stressed
Figure 7: Aggregated state distribution for normal and stres-
sed states for the power substations.
0
0.1
0.2
0.3
0.4
0.5
0.6
0.7
0.8
0.9
1
Transport
Overload and
Power Normal
Transport
Overload and
Power
Stressed
Transport
Normal and
Power Normal
Transport
Normal and
Power
Stressed
Transport
Underload
and Power
Normal
Transport
Underload
and Power
Stressed
Transport Overload Transport Normal Transport Underload
Power Normal Power Stressed
Figure 8: State distribution of charging stations and power
substations with various initial states for the components.
follows:
• Rule 1: Node i gets influenced by node j if and
only if (iff) node i is underloaded and node j is
overloaded or node i is in normal state and node j
is overloaded.
• Rule 2: Node i gets influenced by (receives wor-
kload from) node j iff node i is underloaded and
node j is overloaded.
• Rule 3: Node i gets influenced by node j iff node
i is underloaded and node j is overloaded or node
i is underloaded and node j is in normal state.
• Rule 4: Node i gets influenced by node j iff either
node i is underloaded and node j is overloaded,
node i is underloaded and node j is in normal state
or node i is in normal state and node j is overloa-
ded.
• Rule 5: Node i gets influenced by node j iff either
node i is underloaded and node j is overloaded,
node i is underloaded and node j is in normal
state, node i is in normal state and node j is over-
loaded or node i is in normal state and node j is in
normal state too.
Note that these rules only focus on the interactions
among the charging stations and the influences among
charging stations and the power substations are assu-
med to be as before. Figure 9 shows the state distribu-
tion of nodes with all charging stations initially over-
loaded and all power substations initially normal for
different rules applied to the model. It can be seen that
rule 5 performs the worst among the all as the number
of overloaded charging stations are higher compared
to other cases.
0
0.1
0.2
0.3
0.4
0.5
0.6
0.7
0.8
0.9
1
Rule 1
Rule 2
Rule 3
Rule 4
Rule 5
Transport Overload Transport Normal Transport Underload
Power Normal Power Stressed
Figure 9: State distribution of charging stations and power
substations with all charging stations initially overloaded
and all power substations initially in normal states for diffe-
rent rules of interactions.
To design the incentives that enable influences and
lead to the results shown in Figures 6, 7, 8 and 9, we
need to design the prices for each charging station. To
do so, we have used Algorithm 1 over the active in-
fluence graph obtained at each step of the simulation
whenever there was a change in the active influence
graphs. Note that Algorithm 1 receives graphs simi-
lar to the ones shown in Figure 3 where the self-edges
are omitted. The price assignment based on this algo-
rithm at each station is shown in Table 1 for sample
steps of our simulation (with Rule 1). As it can be
observed from the table, initially all the twelve stati-
ons have the same price of A but the prices vary over
the network as the stochastic dynamics of the system
change the states of the nodes.
In this section, we showed our preliminary study
of collaborative pricing solution between the EV char-
ging and electric infrastructures based on our IM-
based model. Key takeaways from our results include:
SMARTGREENS 2017 - 6th International Conference on Smart Cities and Green ICT Systems
216

Table 1: Charging prices in each EV charging station over various iterations.
Charging Stations
Iteration 1 2 3 4 5 6 7 8 9 10 11 12
1 A A A A A A A A A A A A
18 A - α A A A A A A A A A A A
245 A A - α A A A - α A A A A A A A
246 A A A A A A A A A A A A
247 A A A - α A A A A - α A - α A - α A A A
261 A A A A - α A - α A - α A - α A A A - α A A - α
446 A - α A A A A A A A A A A A
650 A A A A - α A - α A - α A - α A A A - α A A - α
892 A A A A - α A - α A - α A A A A - α A - α A - α
(1) by designing proper rules of interactions among
the integrated systems, the load distribution can be
improved in both systems, and (2) the pricing assig-
nment based on the obtained active influence graph
enables the implementation of appropriate influences.
6 CONCLUSIONS
In this paper, we discussed the importance of collabo-
rative solutions among critical infrastructures of smart
cities. We specifically emphasized that the smart city
solutions should consider the state of various systems
interacting with each other rather than only an indi-
vidual infrastructure. To demonstrate this point, in
this paper, we focused on interdependent EV char-
ging and the electric infrastructures and developed an
integrated framework for modeling their interactions
based on influence model, which is a networked Mar-
kov chain framework. We also proposed an algorithm,
which assigns prices to charging stations based on the
set of active links that can lead to more balanced sys-
tems. We discussed the role of the cyber infrastructure
in enabling this pricing scheme, which considers the
state of both of the systems. The work presented in
this paper is an effort toward using integrated models
for infrastructures to develop collaborative solutions
for smart cities. In future, we will study, both analy-
tically and using simulations, the role of various pa-
rameters of the model in the behavior of the system.
We also hope that this study and modeling approach
can be extended to other smart city solutions and in-
terdependent infrastructures.
REFERENCES
Amin, M. (2002). Toward secure and resilient interdepen-
dent infrastructures. Journal of Infrastructure Sys-
tems, 8(3):67–75.
Asavathiratham, C. (2000). The influence model: A tracta-
ble representation for the dynamics of networked mar-
kov chains. PhD thesis, Citeseer.
Asavathiratham, C., Roy, S., Lesieutre, B., and Verghese, G.
(2001). The influence model. IEEE Control Systems,
21(6):52–64.
Bass, R. and Zimmerman, N. (2013). Impacts of electric
vehicle charging on electric power distribution sys-
tems.
Bowerman, B., Braverman, J., Taylor, J., Todosow, H., and
Von Wimmersperg, U. (2000). The vision of a smart
city. In 2nd International Life Extension Technology
Workshop, Paris, volume 28.
Chen, C. and Hua, G. (2014). A new model for optimal
deployment of electric vehicle charging and battery
swapping stations. International Journal of Control
& Automation, 8(5).
Chourabi, H., Nam, T., Walker, S., Gil-Garcia, J. R., Mel-
louli, S., Nahon, K., Pardo, T. A., and Scholl, H. J.
(2012). Understanding smart cities: An integrative
framework. In System Science (HICSS), 2012 45th
Hawaii International Conference on, pages 2289–
2297. IEEE.
Commission, I. E. et al. (2014). Orchestrating infrastruc-
ture for sustainable smartcities. Published in Geneva,
Switzerland.
Das, A., Banerjee, J., and Sen, A. (2014). Root
cause analysis of failures in interdependent power-
communication networks. In Military Communicati-
ons Conference (MILCOM), 2014 IEEE, pages 910–
915. IEEE.
Guo, S. and Zhao, H. (2015). Optimal site selection of
electric vehicle charging station by using fuzzy topsis
based on sustainability perspective. Applied Energy,
158:390–402.
Harrison, C., Eckman, B., Hamilton, R., Hartswick, P.,
Kalagnanam, J., Paraszczak, J., and Williams, P.
(2010). Foundations for smarter cities. IBM Journal
of Research and Development, 54(4):1–16.
Hatton, C., Beella, S., Brezet, J., and Wijnia, Y. (2009).
Charging stations for urban settings the design of a
product platform for electric vehicle infrastructure in
dutch cities. In Towards zero emission: EVS 24 In-
ternational Battery, Hybrid and Fuel Cell Electric
Vehicle Symposium & Exhibition, 13-16 May 2009,
Towards Integrated Infrastructures for Smart City Services: A Story of Traffic and Energy Aware Pricing Policy for Charging Infrastructures
217

Stavanger, Norway. European Association of Electric
Road Vehicles.
He, F., Wu, D., Yin, Y., and Guan, Y. (2013). Optimal de-
ployment of public charging stations for plug-in hy-
brid electric vehicles. Transportation Research Part
B: Methodological, 47:87–101.
Heilig, G. (2012). World urbanization prospects: The 2011
revision. new york: United nations, department of
economic and social affairs (desa), population divi-
sion. Population Estimates and Projections Section.
Hess, A., Malandrino, F., Reinhardt, M. B., Casetti, C.,
Hummel, K. A., and Barcel
´
o-Ordinas, J. M. (2012).
Optimal deployment of charging stations for electric
vehicular networks. In Proceedings of the first works-
hop on Urban networking, pages 1–6. ACM.
Islam, M. M., Shareef, H., and Mohamed, A. (2015). A re-
view of techniques for optimal placement and sizing
of electric vehicle charging stations. Przeglad Elek-
trotechniczny, 91(8):122–126.
Lee, W., Xiang, L., Schober, R., and Wong, V. W. (2015).
Electric vehicle charging stations with renewable po-
wer generators: A game theoretical analysis. IEEE
Transactions on Smart Grid, 6(2):608–617.
Li, Y., Luo, J., Chow, C.-Y., Chan, K.-L., Ding, Y., and
Zhang, F. (2015). Growing the charging station net-
work for electric vehicles with trajectory data analy-
tics. In 2015 IEEE 31st International Conference on
Data Engineering, pages 1376–1387. IEEE.
Little, R. G. (2002). Controlling cascading failure: Un-
derstanding the vulnerabilities of interconnected in-
frastructures. Journal of Urban Technology, 9(1):109–
123.
Liu, J. (2012). Electric vehicle charging infrastructure as-
signment and power grid impacts assessment in bei-
jing. Energy Policy, 51:544–557.
Liu, R., Dow, L., and Liu, E. (2011). A survey of pev im-
pacts on electric utilities. In Innovative Smart Grid
Technologies (ISGT), 2011 IEEE PES, pages 1–8.
IEEE.
Min, H.-S. J., Beyeler, W., Brown, T., Son, Y. J., and Jo-
nes, A. T. (2007). Toward modeling and simulation of
critical national infrastructure interdependencies. Iie
Transactions, 39(1):57–71.
Pillai, J. R. and Bak-Jensen, B. (2010). Impacts of electric
vehicle loads on power distribution systems. In 2010
IEEE Vehicle Power and Propulsion Conference, pa-
ges 1–6. IEEE.
Piorkowski, M., Sarafijanovic-Djukic, N., and Grossglau-
ser, M. (2009). Crawdad data set epfl/mobility (v.
2009-02-24).
Rahman, I., Vasant, P. M., Singh, B. S. M., and Abdullah-
Al-Wadud, M. (2014). Intelligent energy allocation
strategy for phev charging station using gravitational
search algorithm. In AIP Conference Proceedings, vo-
lume 1621, pages 52–59.
Recker, W. W. and Kang, J. E. (2010). An activity-based
assessment of the potential impacts of plug-in hybrid
electric vehicles on energy and emissions using one-
day travel data. University of California Transporta-
tion Center.
Rinaldi, S. M. (2004). Modeling and simulating critical in-
frastructures and their interdependencies. In System
sciences, 2004. Proceedings of the 37th annual Ha-
waii international conference on, pages 8–pp. IEEE.
Shao, J., Buldyrev, S. V., Havlin, S., and Stanley, H. E.
(2011). Cascade of failures in coupled network
systems with multiple support-dependence relations.
Physical Review E, 83(3):036116.
Shin, D.-H., Qian, D., and Zhang, J. (2014). Cascading
effects in interdependent networks. IEEE Network,
28(4):82–87.
Siavashi, E. (2016). Stochastic modeling of net-
work interactions: Conditional influence model.
Texas Tech Master Thesis (https://ttu-ir.tdl.org/ttu-
ir/handle/2346/67107).
Sioshansi, R. (2012). Or forum-modeling the impacts of
electricity tariffs on plug-in hybrid electric vehicle
charging, costs, and emissions. Operations Research,
60(3):506–516.
Sweda, T. M. and Klabjan, D. (2014). Agent-based infor-
mation system for electric vehicle charging infrastruc-
ture deployment. Journal of Infrastructure Systems,
21(2):04014043.
Tushar, W., Saad, W., Poor, H. V., and Smith, D. B. (2012).
Economics of electric vehicle charging: A game the-
oretic approach. IEEE Transactions on Smart Grid,
3(4):1767–1778.
Vazifeh, M. M., Zhang, H., Santi, P., and Ratti, C. (2015).
Optimizing the deployment of electric vehicle char-
ging stations using pervasive mobility data. arXiv pre-
print arXiv:1511.00615.
Wagner, S., G
¨
otzinger, M., and Neumann, D. (2013). Op-
timal location of charging stations in smart cities: A
points of interest based approach.
Walsh, K., Enz, C. A., and Canina, L. (2004). The impact
of gasoline price fluctuations on lodging demand for
us brand hotels. International Journal of Hospitality
Management, 23(5):505–521.
Weis, C., Axhausen, K., Schlich, R., and Zbinden, R.
(2010). Models of mode choice and mobility tool ow-
nership beyond 2008 fuel prices. Transportation Rese-
arch Record: Journal of the Transportation Research
Board, (2157):86–94.
Xiong, Y., Gan, J., An, B., Miao, C., and Bazzan, A. L.
(2015). Optimal electric vehicle charging station pla-
cement. In Proceedings of the 24th International Joint
Conference on Artificial Intelligence (IJCAI), pages
2662–2668.
Xiong, Y., Gan, J., An, B., Miao, C., and Soh, Y. C. (2016).
Optimal pricing for efficient electric vehicle charging
station management. In Proceedings of the 2016 Inter-
national Conference on Autonomous Agents & Multi-
agent Systems, pages 749–757. International Founda-
tion for Autonomous Agents and Multiagent Systems.
SMARTGREENS 2017 - 6th International Conference on Smart Cities and Green ICT Systems
218
