
Does CAI Improve Early Math Skills?
Haya Shamir, Kathryn Feehan and Erik Yoder
Waterford Institute, 1590 East 9400 South, Sandy, UT, 84093, U.S.A.
Keywords: Computer-Assisted Instruction (CAI), Math, Early Childhood.
Abstract: The Waterford Early Math and Science Program is a computer-assisted instruction program that ensures
individualized learning for kindergarten through first grade students. The Waterford curriculum was assigned
to students in a school district in Indiana for the 2015-2016 school year. The Mobile Classroom: Math
assessment was administered to students at the beginning, middle, and end of the school year to assess math
skills across multiple strands. Analysis revealed statistically significant higher end of year scores on most
assessment strands made by kindergarten and first grade students that used the Waterford Early Math and
Science Program, indicating that Waterford curriculum improves early math skills.
1 INTRODUCTION
The achievement gap is the difference in academic
success between students of ethnic minority and/or
students of low socioeconomic status and their White
student counterparts and/or students of higher
socioeconomic status (Maulbeck, 2015). This
academic achievement gap separates the lower- and
higher-achieving students from one another, and the
gap widens as students continue into later grades
(Harris et al., 2016). If not addressed, the gap can be
widened in schools when students of all
demographics are not taught according to their needs:
According to Heckman’s research, early
interventions followed by high quality education are
most effective in preventing the achievement gap
between students of low socioeconomic status and
students of high socioeconomic status (Education,
2011). Clearly, students of lower socioeconomic
status need to have access to effective curriculum to
prepare them for academic success despite their
backgrounds.
Students need basic operational knowledge and
number competence in order to succeed in
mathematics when entering elementary school
(Jordan et al., 2009; Welsh et al., 2010). Most children
acquire numeracy knowledge before they enter
kindergarten, and this basic numerical knowledge or
lack thereof impacts mathematical success in school
through high school (Claessens and Engel, 2013;
National Mathematics Advisory Panel, 2008).
Moreover, early numeracy skills assessed in
kindergarten as measured by test scores and teacher
reports predicted mathematics performance in first
grade (Aunio and Niemivirta, 2010), in third grade
(Jordan et al., 2009), and through eighth grade
(Claessens and Engel, 2013). Early math achievement
is predictive of later math, reading, and science
achievement, so foundational knowledge of math is
essential for success in school (Claessens and Engel,
2013).
Computer-assisted instruction (CAI) is the
presentation of different forms of educational media
material in an interactive, instructional way. While
teachers conduct large group instruction meant for
many students to learn a subject, CAI allows
individual students to take control of their learning
which increases students’ flexibility, interactivity,
and engagement (Jethro et al., 2012). According to
research of CAI in the classroom setting, early
childhood instruction using CAI can improve
mathematical performance (Aunio and Niemivirta,
2010) in comparison to a typical public classroom
setting. Moreno (2006) suggests a cognitive theory of
learning with media (CTLM), wherein students learn
better when given opportunities to reflect on
information they have learned, where multimedia
presentations of material are more conducive to
retention, and where words and graphics expand
working-memory capacity. CAI presents material
with animation and immediate feedback,
individualizing the learning process.
Differences in academic achievement and
cognitive abilities in the early years lead to a need for
Shamir, H., Feehan, K. and Yoder, E.
Does CAI Improve Early Math Skills?.
DOI: 10.5220/0006266702850292
In Proceedings of the 9th International Conference on Computer Supported Education (CSEDU 2017) - Volume 2, pages 285-292
ISBN: 978-989-758-240-0
Copyright © 2017 by SCITEPRESS – Science and Technology Publications, Lda. All rights reserved
285

technology applications that scaffold, are
individualized, and adjust to a child’s ability level
(Wang et al., 2010). This need for individualized
educational technology programs includes programs
targeting students of all demographics. CAI
technology can significantly improve mathematics
achievement in at-risk pre-kindergarten students
(Clements et al., 2011), at-risk elementary school
students (Clements and Sarama, 2008), and middle
and high school students (Barrow et al., 2009) in
comparison to traditional classrooms. However,
while computer-assisted instruction has been well
documented to improve the early literacy and math
academic achievement, studies have also proven that
computer-assisted instruction presents challenges to
students from low-income families (Kitchen and
Berk, 2016; Slavin and Lake, 2008). Results are not
all in favor of CAI incorporated with in-school
instruction, so further research is needed to examine
the impact of CAI technology on literacy and math
scores of early elementary students (Cheung and
Slavin, 2011; Macaruso and Walker, 2008).
The purpose of the present study was to evaluate
the effectiveness of the Waterford Early Math and
Science Program in improving early math skills of
kindergarten through second grade students. The
computer-assisted instruction program, we predict,
will improve math scores when incorporated into
early elementary school programs.
2 METHODS
2.1 Participants
This study consisted of 602 students enrolled in a
public school district in Indiana during the 2015-2016
school year. The majority of students in the study are
White, and approximately half of the students qualify
for free lunch.
The experimental group for kindergarten
consisted of 114 students, and the control group
consisted of 58 students. For first grade, the
experimental group consisted of 68 students, and the
control group consisted of 255 students.
2.2 Materials
2.2.1 The Waterford Early Math and
Science Program (EMS)
The program offers a comprehensive, computer-
adaptive math and science curriculum for pre-
kindergarten through second grade students. The
software presents a wide range of multimedia-based
activities in an adaptive sequence tailored to each
student’s initial placement and his or her individual
rate of growth throughout the complete math and
science curriculum.
2.2.2 Mobile Classroom: Math (mCLASS:
Math)
The assessment mCLASS: Math was designed to
assess early mathematics skills and identify at-risk
students in need of remedial early mathematics
assistance. The assessment measures fundamental
skills required by the Common Core State Standards
in mathematics for kindergarten through third grade.
2.3 Procedure
Students were expected to use EMS for thirty minutes
per day, five days per week, throughout the 2015-
2016 school year. Usage was tracked within the
program and monitored weekly by Waterford
personnel, and total minutes of usage of EMS for the
school year per group was calculated.
The mCLASS: Math assessment was
administered three times throughout the school year,
at the beginning, middle, and end of the year.
The experimental group for kindergarten
consisted of students that used EMS for more than
1,000 minutes throughout the 2015-2016 school year,
and the control group consisted of students that used
EMS for less than 400 minutes throughout the 2015-
2016 school year. For first grade, the experimental
group consisted of students that used EMS for more
than 1,000 minutes throughout the 2015-2016 school
year, and the control group consisted of students that
did not use EMS.
3 FINDINGS
3.1 Kindergarten
3.1.1 Group Differences using ANCOVAs
ANCOVAs examining group differences in
mCLASS: Math end of year scores while covarying
for beginning of year scores were conducted (see
Figures 1-2).
Analysis of Number Identification end of year
scores, while covarying for beginning of year scores,
revealed a significant difference between groups, F(1,
168) = 7.34, p < .01, due to higher end of year scores
made by students who used Waterford (M = 32.38)
CSEDU 2017 - 9th International Conference on Computer Supported Education
286
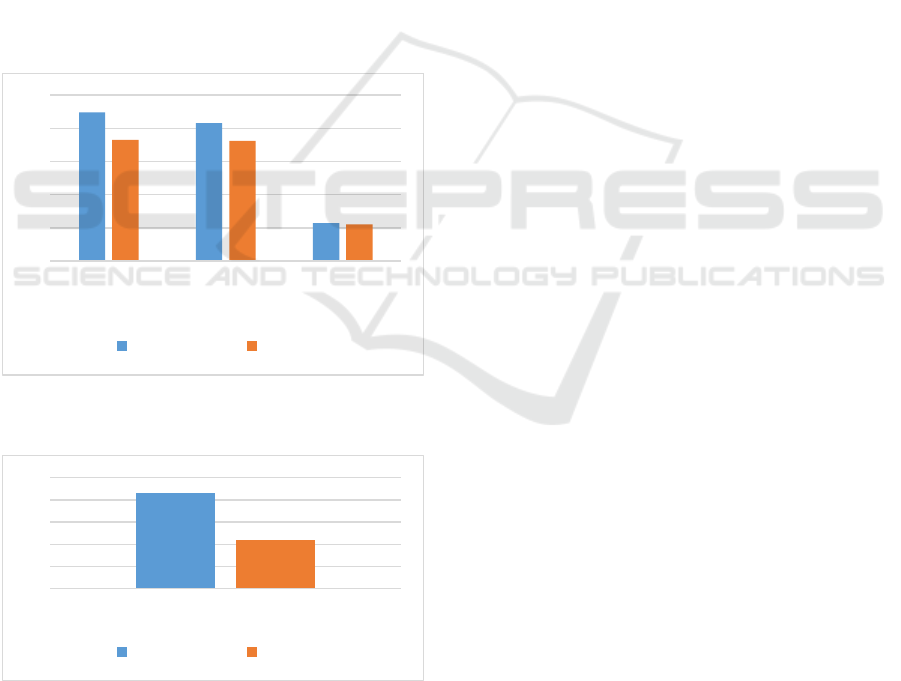
than by control students (M = 28.25). Effect size (d =
0.42).
Analysis of Quantity Discrimination end of year
scores, while covarying for beginning of year scores,
revealed a significant difference between groups, F(1,
168) = 4.30, p < .05, due to higher end of year scores
made by students who used Waterford (M = 30.80)
than by control students (M = 28.12). Effect size (d =
0.32).
Analysis of Counting end of year scores, while
covarying for beginning of year scores, did not reveal
a significant difference between groups, F(1, 168) =
3.43, p = .066, however Waterford students had
higher end of year scores (M = 88.64) than control
students (M = 84.33).
Analysis of Missing Number end of year scores,
while covarying for beginning of year scores, did not
reveal a significant difference between groups, F(1,
168) = 0.04, p = .839, however Waterford students
had higher end of year scores (M = 15.70) than
control students (M = 15.53).
Figure 1: Kindergarten mCLASS: Math end of year scores
by substrand.
Figure 2: Kindergarten mCLASS: Math Counting end of
year scores.
3.1.2 Group Differences by Demographics
using ANCOVAs
Further analysis was conducted to examine the effects
of gender, lunch program, and special education
status on Number Identification end of year scores
(see Figure 3).
There was no significant interaction between the
effects of gender and Waterford curriculum on
Number Identification end of year scores, covarying
for beginning of year scores, F(1, 166) = 2.90, p =
.091. Simple effects analysis showed that for females,
students in the experimental group significantly
outperformed students in the control group. Male
students’ scores in the experimental group were
slightly higher than in the control group, but the
difference was not significant.
There was no significant interaction between the
effects of lunch program and Waterford curriculum
on Number Identification end of year scores,
covarying for beginning of year scores, F(2, 164) =
1.10, p = .334. Simple effects analysis showed that for
reduced lunch, students in the experimental group
significantly outperformed students in the control
group. Free lunch and regular lunch students’ scores
in the experimental group were slightly higher than in
the control group, but the difference was not
significant.
There was no significant interaction between the
effects of special education status and Waterford
curriculum on Number Identification end of year
scores, covarying for beginning of year scores, F(1,
166) = 0.53, p = .468. Simple effects analysis showed
that for students with no special education status, the
experimental group significantly outperformed the
control group. For students with active special
education status, scores in the experimental group
were slightly higher than in the control group, but the
difference was not significant.
Further analysis was conducted to examine the effects
of gender, lunch program, and special education
status on Quantity Discrimination end of year scores
(see Figure 4).
There was no significant interaction between the
effects of gender and Waterford curriculum on
Quantity Discrimination end of year scores,
covarying for beginning of year scores, F(1, 166) =
0.12, p = .729. Simple effects analysis showed that for
males and females, students’ scores in the
experimental group were slightly higher than in the
control group, but the difference was not significant.
There was no significant interaction between the
effects of lunch program and Waterford curriculum
on Quantity Discrimination end of year scores
10
15
20
25
30
35
Number
Identification
Quantity
Discrimination
Missing
Number
Experimental Control
80
82
84
86
88
90
Counting
Experimental Control
Does CAI Improve Early Math Skills?
287
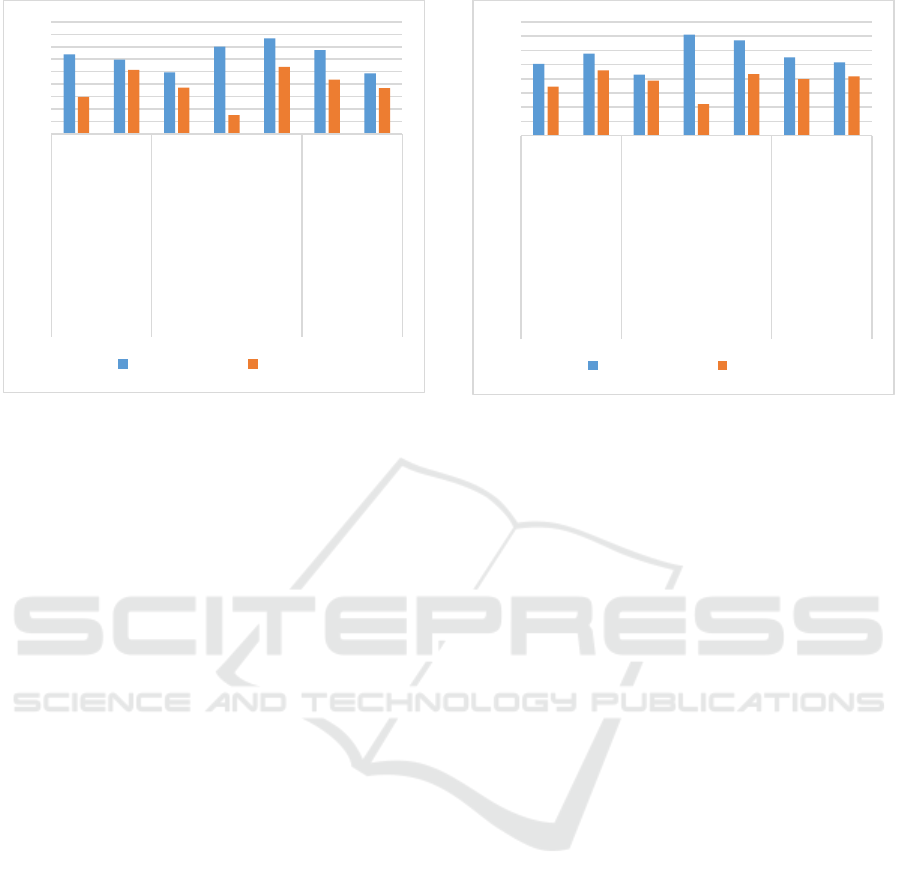
Figure 3: Number identification end of year scores by
demographics.
covarying for beginning of year scores, F(2, 164) =
2.41, p = .093. Simple effects analysis showed that for
reduced lunch and regular lunch, students in the
experimental group significantly outperformed
students in the control group. Free lunch students’
scores in the experimental group were slightly higher
than in the control group, but the difference was not
significant.
There was no significant interaction between the
effects of special education status and Waterford
curriculum on Quantity Discrimination end of year
scores, covarying for beginning of year scores, F(1,
166) = 0.17, p = .677. Simple effects analysis showed
that for students with no special education status and
active special education status, scores in the
experimental group were slightly higher than in the
control group, but the difference was not significant.
3.2 First Grade
3.2.1 Group Differences using ANCOVAs
ANCOVAs examining group differences in
mCLASS: Math end of year scores while covarying
for beginning of year scores were conducted (see
Figures 5-6).
Analysis of Number Identification end of year
scores, while covarying for beginning of year scores,
did not reveal a significant difference between
groups, F(1, 320) = 0.06, p = .813, however
Waterford students (M = 52.40) scored slightly
higher than control students (M = 52.12).
Analysis of Number Facts end of year scores,
while covarying for beginning of year scores,
Figure 4: Quantity discrimination end of year scores by
demographics.
revealed a significant difference between groups, F(1,
320) = 9.06, p < .01, due to higher end of year scores
made by students who used Waterford (M = 14.02)
than by control students (M = 12.69). Effect size (d =
0.34).
Analysis of Quantity Discrimination end of year
scores, while covarying for beginning of year scores,
revealed a significant difference between groups, F(1,
320) = 5.88, p < .05, due to higher end of year scores
made by students who used Waterford (M = 42.17)
than by control students (M = 39.78). Effect size (d =
0.27).
Analysis of Counting end of year scores, while
covarying for beginning of year scores, did not reveal
a significant difference between groups, F(1, 320) =
0.66, p = .416, however Waterford students (M =
107.08) scored slightly higher than control students
(M = 106.03).
Analysis of Missing Number end of year scores,
while covarying for beginning of year scores,
revealed a significant difference between groups, F(1,
320) = 15.07, p < .01, due to higher end of year scores
made by students who used Waterford (M = 25.90)
than by control students (M = 23.12). Effect size (d =
0.43).
Analysis of Next Number end of year scores,
while covarying for beginning of year scores,
revealed a significant difference between groups, F(1,
320) = 6.18, p < .05, due to higher end of year scores
made by students who used Waterford (M = 23.77)
than by control students (M = 22.09). Effect size (d =
0.28).
20
22
24
26
28
30
32
34
36
38
Female
Male
Free Lunch
Reduced Lunch
Regular Lunch
No Special
Education
Active Special
Education
Gender Lunch Program Special
Education
Status
Experimental Control
20
22
24
26
28
30
32
34
36
Female
Male
Free Lunch
Reduced Lunch
Regular Lunch
No Special
Education
Active Special
Education
Gender Lunch Program Special
Education
Status
Experimental Control
CSEDU 2017 - 9th International Conference on Computer Supported Education
288
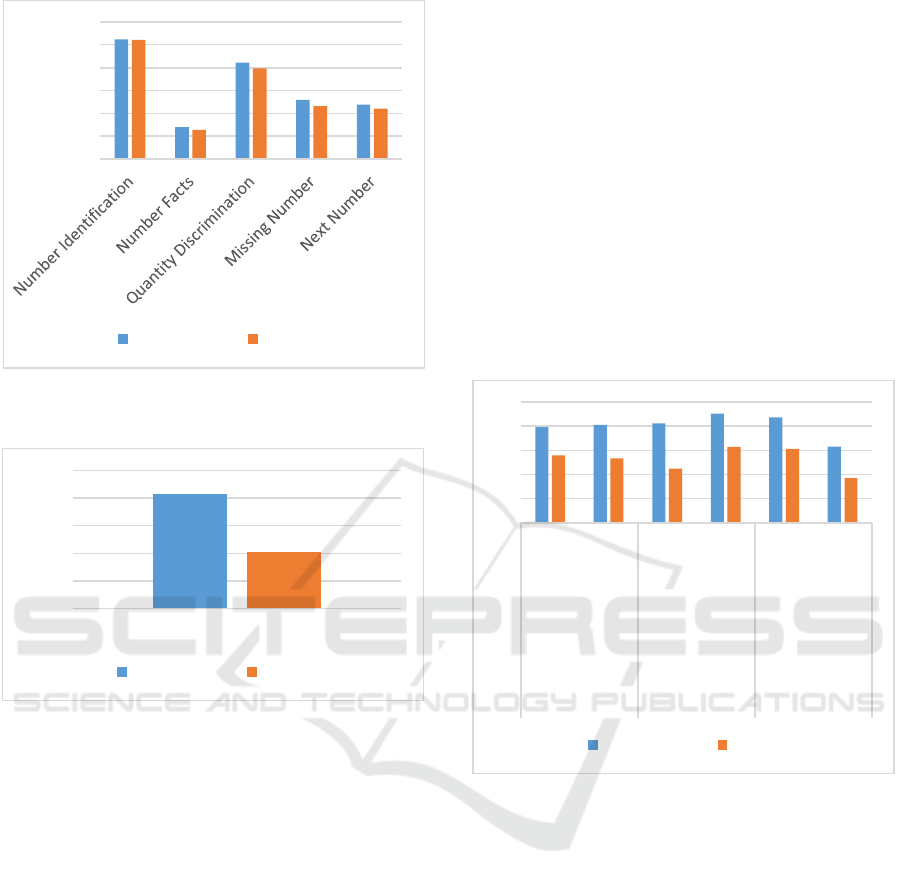
Figure 5: First grade mCLASS: Math end of year scores by
substrand.
Figure 6: First grade mCLASS: Math counting end of year
scores.
3.2.2 Group Differences by Demographics
using ANCOVAs
Further analysis was conducted to examine the effects
of gender, lunch program, and special education
status on Number Facts end of year scores. (see
Figure 7).
There was no significant interaction between the
effects of gender and Waterford curriculum on
Number Facts end of year scores, covarying for
beginning of year scores, F(1, 317) = 0.05, p = .818.
Simple effects analysis showed that for males,
students in the experimental group significantly
outperformed students in the control group. Female
students’ scores in the experimental group were
slightly higher than in the control group, but the
difference was not significant.
There was no significant interaction between the
effects of lunch program and Waterford curriculum
on Number Facts end of year scores, covarying for
beginning of year scores, F(2, 310) = 2.86, p = .059.
Simple effects analysis showed that for free lunch and
regular lunch, students in the experimental group
significantly outperformed students in the control
group.
There was no significant interaction between the
effects of special education status and Waterford
curriculum on Number Facts end of year scores,
covarying for beginning of year scores, F(1, 317) =
.00, p = .982. Simple effects analysis showed that for
students with no special education status, the
experimental group significantly outperformed the
control group. For students with active special
education status, scores in the experimental group
were slightly higher than in the control group, but the
difference was not significant.
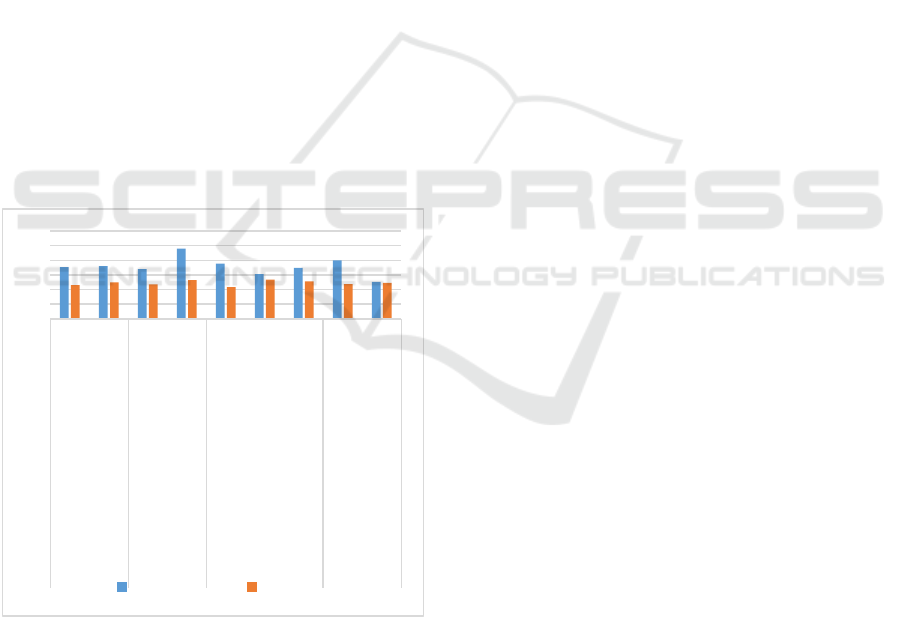
Figure 7: First grade number facts end of year scores by
demographics.
Further analysis was conducted to examine the effects
of gender, LEP status, lunch program, and special
education status on end of year Quantity
Discrimination scores (see Figure 8).
There was no significant interaction between the
effects of gender and Waterford curriculum on
Quantity Discrimination end of year scores,
covarying for beginning of year scores, F(1, 317) =
0.01, p = .918. Simple effects analysis showed that for
males and females, students’ scores in the
experimental group were slightly higher than in the
control group, but the difference was not significant.
There was no significant interaction between the
effects of LEP status and Waterford curriculum on
Quantity Discrimination end of year scores,
covarying for beginning of year scores, F(1, 317) =
0.56, p = .457. Simple effects analysis showed that
0
10
20
30
40
50
60
Experimental Control
105
105,5
106
106,5
107
107,5
Counting
Experimental Control
10
11
12
13
14
15
Female
Male
Free Lunch
Regular Lunch
No Special
Education
Active Special
Education
Gender Lunch Program Special
Education
Status
Experimental Control
Does CAI Improve Early Math Skills?
289
Non-LEP students’ scores in the experimental group
were slightly higher than in the control group,
approaching significance. LEP students’ scores in the
experimental group were slightly higher than in the
control group, but the difference was not significant.
There was no significant interaction between the
effects of lunch program and Waterford curriculum
on Quantity Discrimination end of year scores,
covarying for beginning of year scores, F(2, 310) =
0.37, p = .694. Simple effects analysis showed that for
free lunch, students in the experimental group
significantly outperformed students in the control
group. Reduced lunch and regular lunch students’
scores in the experimental group were slightly higher
than in the control group, but the difference was not
significant.
There was no significant interaction between the
effects of special education status and Waterford
curriculum on Quantity Discrimination end of year
scores, covarying for beginning of year scores, F(1,
317) = 2.01, p = .158. Simple effects analysis showed
that for students with no special education status, the
experimental group significantly outperformed the
control group. For students with active special
education status, scores in the experimental group
were slightly higher than in the control group, but the
difference was not significant.
Figure 8: First grade quantity discrimination end of year
scores by demographics.
Further analysis was conducted to examine the effects
of gender, LEP status, lunch program, and special
education status on end of year Missing Number
scores (see Figure 9).
There was no significant interaction between the
effects of gender and Waterford curriculum on
Missing Number end of year scores, covarying for
beginning of year scores, F(1, 317) = 0.17, p = .682.
Simple effects analysis showed that for males and
females, students in the experimental group
significantly outperformed students in the control
group.
There was no significant interaction between the
effects of LEP status and Waterford curriculum on
Missing Number end of year scores, covarying for
beginning of year scores, F(1, 317) = 1.47, p = .227.
Simple effects analysis showed that Non-LEP
students in the experimental group significantly
outperformed students in the control group. LEP
students’ scores in the experimental group were
slightly higher than in the control group, but the
difference was not significant.
There was no significant interaction between the
effects of lunch program and Waterford curriculum
on Missing Number end of year scores, covarying for
beginning of year scores, F(2, 310) = 0.32, p = .730.
Simple effects analysis showed that for free lunch and
regular lunch, students in the experimental group
significantly outperformed students in the control
group. Reduced lunch students’ scores in the
experimental group were higher than in the control
group, approaching significance.
There was no significant interaction between the
effects of special education status and Waterford
curriculum on Missing Number end of year scores,
covarying for beginning of year scores, F(1, 317) =
0.32, p = .574. Simple effects analysis showed that for
students with no special education status, the
experimental group significantly outperformed the
control group. For students with active special
education status, scores in the experimental group
were slightly higher than in the control group, but the
difference was not significant.
Further analysis was conducted to examine the
effects of gender, LEP status, lunch program, and
special education status on Next Number end of year
scores (see Figure 10).
There was no significant interaction between the
effects of gender and Waterford curriculum on Next
Number end of year scores, covarying for beginning
of year scores, F(1, 317) = 0.07, p = .787. Simple
effects analysis showed that for males, students in the
experimental group significantly outperformed
students in the control group. Female students’ scores
in the experimental group were slightly higher than in
the control group, but the difference was not
significant.
35
37
39
41
43
45
47
Female
Male
Non-LEP
LEP
Free Lunch
Reduced Lunch
Regular Lunch
No Special Education
Active Special Education
Gender LEP Status Lunch Program Special
Education
Status
Experimental Control
CSEDU 2017 - 9th International Conference on Computer Supported Education
290
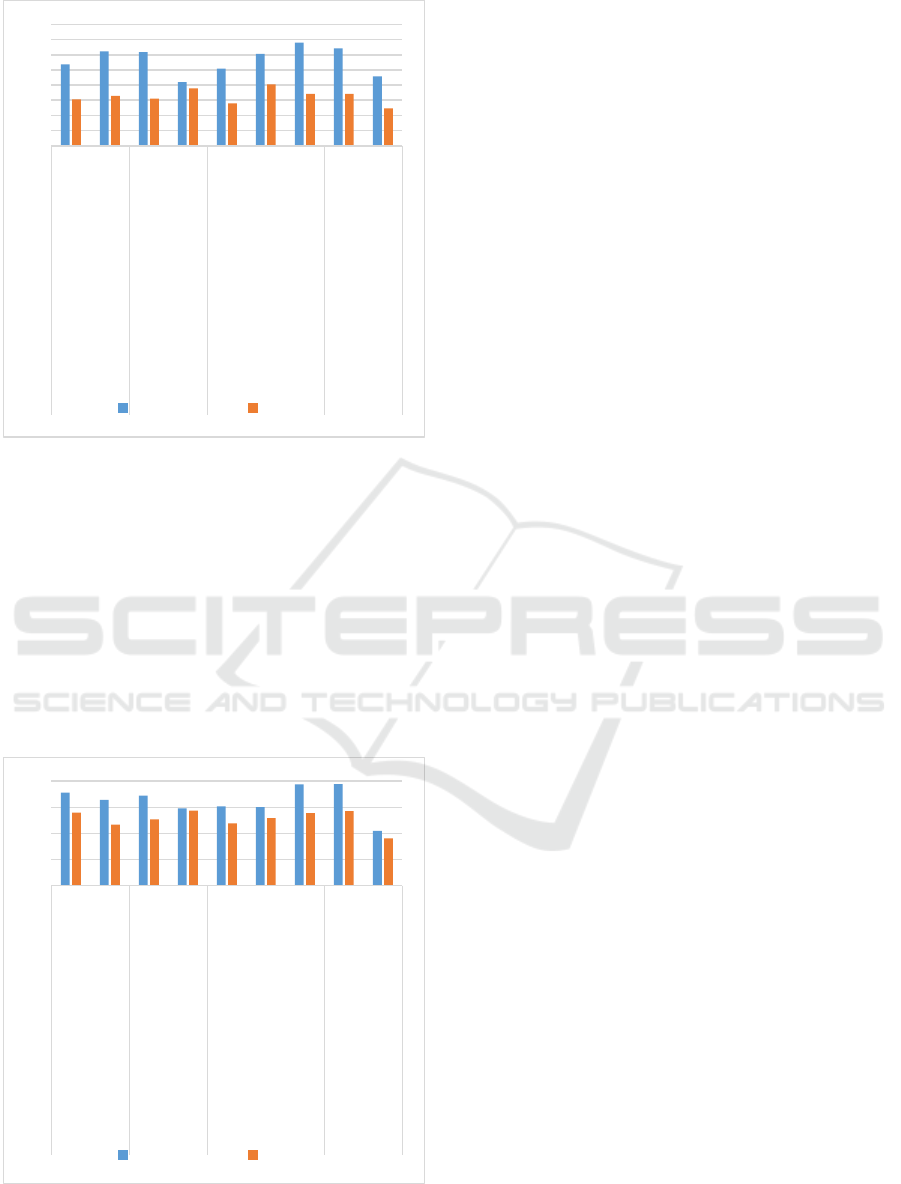
Figure 9: First grade missing number end of year scores by
demographics.
There was no significant interaction between the
effects of lunch program and Waterford curriculum
on Next Number end of year scores, covarying for
beginning of year scores, F(2, 310) = 0.26, p = .775.
Simple effects analysis showed that for regular lunch,
students in the experimental group significantly
outperformed students in the control group. Free
lunch and reduced lunch students’ scores in the
experimental group were slightly higher than in the
control group, but the difference was not significant.
Figure 10: First grade quantity discrimination end of year
scores by demographics.
There was no significant interaction between the
effects of special education status and Waterford
curriculum on Next Number end of year scores,
covarying for beginning of year scores, F(1, 317) =
1.03, p = .312. Simple effects analysis showed that for
students with no special education status, the
experimental group significantly outperformed
students in the control group. For students with active
special education status, scores in the experimental
group were slightly higher than in the control group,
but the difference was not significant.
4 DISCUSSION
According to previous research of CAI programs in
early childhood education, early mathematical
performance can be improved by incorporating CAI
technology into an existing school curriculum (Aunio
and Niemivirta, 2010). Similar to previous studies,
performance on various strands of math were higher
for students who used the Waterford Early Math and
Science Program, indicating the benefit of adding
CAI to an existing curriculum. Almost universally,
students in the experimental group outperformed
students in the control group across demographics
and across grades. These findings are supported by
previous findings that CAI technology improves early
math scores when added to an existing curriculum
(Ecalle et al., 2013; Falth, Gustafson et al., 2013;
López, 2010).
Students who had the most usage of the CAI
software showed the highest achievement on the
assessments, which suggests that if the software was
implemented with the minimum usage expectations
for all students, the positive effects on academic
achievement would have been even higher. A
limitation of this study is that the students were from
a single school district, and the vast majority of
students were Caucasian. Having a more ethnically
diverse sample, as well as students from multiple
school districts, would allow these results to be more
generalizable. The addition of CAI in a classroom
setting, overall, provides effective individual
instruction for each student in early math.
REFERENCES
Aunio, P., & Niemivirta, M. (2010). Predicting children’s
mathematical performance in grade one by early
numeracy. Learning and Individual Differences, 20,
20
21
22
23
24
25
26
27
28
Female
Male
Non-LEP
LEP
Free Lunch
Reduced Lunch
Regular Lunch
No Special Education
Active Special Education
Gender LEP Status Lunch Program Special
Education
Status
Experimental Control
17
19
21
23
25
Female
Male
Non-LEP
LEP
Free Lunch
Reduced Lunch
Regular Lunch
No Special Education
Active Special Education
Gender LEP Status Lunch Program Special
Education
Status
Experimental Control
Does CAI Improve Early Math Skills?
291

427-435. doi:10.1016/j.lindif.2010.06.003.
Barrow, L., Markman, L., & Rouse, C. E. (2009).
Technology'sedge: The educational benefits of
computer-aided instruction. American Economic
Journal: Economic Policy, 1(1), 52-74.
Cheung, A. C., & Slavin, R. E. (2011). The Effectiveness
of Education Technology for Enhancing Reading
Achievement: A Meta-Analysis. Center for Research
and Reform in Education.
Claessens, A., & Engel, M. (2013). How important is where
you start? Early mathematics knowledge and later
school success. Teachers College Record, 115(6), 1-29.
Clements, D. H., & Sarama, J. (2008). Experimental
evaluation of the effects of a research-based preschool
mathematics curriculum. American Educational
Research Journal.
Clements, D. H., Sarama, J., Spitler, M. E., Lange, A. A.,
& Wolfe, C. B. (2011). Mathematics learned by young
children in an intervention based on learning
trajectories: A large-scale cluster randomized
trial. Journal for Research in Mathematics
Education, 42(2), 127-166.
Education, E. C. (2011). Care. European Commission.
Ecalle, J., Kleinsz, N., & Magnan, A. (2013). Computer-
assisted learning in young poor readers: The effect of
grapho-syllabic training on the development of word
reading and reading comprehension. Computers in
Human Behavior, 29, 1368-1376.
Falth, L., Gustafson, S., Tjus, T., Heimann, M., &
Svensson, I. (2013). Computer-assisted interventions
targeting reading skills of children with reading
disabilities—a longitudinal study. Dyslexia, 19(1), 37-
53. doi: 10.1002/dys.1450.
Harris, P., Bennett, R., Hines, E., Mayes, R., & Vega, D.,
2016. Achievement gap: A look back and a way
forward. JV Journal of Educational Research and
Interdisciplinary Studies, 1(2), 7-15.
Jethro, O. O., Grace, A. M., & Thomas, A. K. (2012). E-
learning and its effects on teaching and learning in a
global age. International Journal of Academic
Research in Business and Social Sciences, 2(1), 203-
210.
Jordan, N. C., Kaplan, D., Ramineni, C., & Locuniak, M.
N. (2009). Early math matters: Kindergarten number
competence and later mathematics outcomes.
Developmental Psychology, 45(3), 850-867.
Kitchen, R., & Berk, S. (2016). Educational technology: An
equity challenge to the Common Core. Journal for
Research in Mathematics Education, 47(1), 3-16.
López, O. S. (2010). The digital learning classroom:
Improving English language learners’ academic
success in mathematics and reading using interactive
whiteboard technology. Computers & Education,
54(4), 901-915.
Macaruso, P., & Walker, A. (2008). The efficacy of
computer-assisted instruction for advancing literacy
skills in kindergarten children. Reading Psychology,
29(3), 266-287.
Maulbeck, J. (2015). The gap in conceptualizing
achievement in America’s public schools: An analysis
of the achievement gap. Conference: Equity and
Opportunity Studies Fellowship Conference, Rutgers
University at Newark, NJ.
Moreno, R. (2006). Learning in high-tech and multimedia
environments. Association for Psychological Science,
15(2), 63-67.
National Mathematics Advisory Panel. (2008). The final
report of the national mathematics advisory panel. U.S.
Department of Education.
Slavin, R. E., & Lake, C. (2008). Effective programs in
elementary mathematics: A best-evidence
synthesis. Review of Educational Research, 78(3), 427-
515.
Wang, F., Kinzie, M. B., McGuire, P., & Pan, E. (2010).
Applying technology to inquiry-based learning in early
childhood education. Early Childhood Education
Journal, 37, 381-389. doi: 10.1007/s10643-009-0364-
6.
Welsh, J., Nix, R., Blair, C., Bierman, K., & Nelson, K.,
2010. The development of cognitive skills and gains in
academic school readiness for children from low-
income families. Journal of Educational Psychology,
102(1), 43–53. doi:10.1037/a0016738.
CSEDU 2017 - 9th International Conference on Computer Supported Education
292
