
An Interval Distribution Analysis for RTI+
Fabian Witter
1
, Timo Klerx
1
and Artus Krohn-Grimberghe
2
1
Department of Computer Science, Paderborn University, Paderborn, Germany
2
Department of Business Information Systems, Paderborn University, Paderborn, Germany
{fwitter, timok}@mail.upb.de, artus@aisbi.de
Keywords:
Statistical Distribution Analysis, Outlier Detection, Deterministic Real-Time Automata, Sequence-based
Anomaly Detection, ATM Fraud Detection.
Abstract:
The algorithm RTI+ learns a Probabilistic Deterministic Real-Time Automaton (PDRTA) from unlabeled timed
sequences. RTI+ is an efficient algorithm that runs in polynomial time and can be applied to a variety of
real-world behavior identification problems. Nevertheless, we uncover a lack of accuracy in identifying the
intervals (or time guards) of the PDRTA. This inaccuracy can lead to wrong predictions of timed sequences in
the learned model. We show by example that segments in intervals that are not covered by training data are
responsible for this effect. We call those segments gaps and name three types of gaps that can appear. Two of
the types cause wrong predictions of sequences and should thus be removed from the model. Therefore, we
introduce our novel Interval Distribution Analysis (IDA) which utilizes statistical outlier detection to identify
and remove gaps. In the context of ATM fraud detection, we show that IDA can improve the results of RTI+ in
a real-world scenario.
1 INTRODUCTION
The algorithm Real-Time Identification from Positive
Data (RTI+) was developed by Verwer et al. (Verwer
et al., 2010) to identify real-time behavioral models
from positive data. RTI+ runs in polynomial time and
can identify sufficiently large models to be able to
learn the behavior of real-world systems (Verwer et al.,
2010). Hence, it is a practically valuable algorithm
which can be applied to a wide range of behavioral
scenarios of log-emitting systems, e.g. ATM fraud
detection or elevator breakdown prediction.
In this paper, we reveal a weakness of RTI+. The
models learned by RTI+ may include a wider variety
of time values than the training data yields. Hence,
it underfits the data regarding the time values. This
effect is reflected in widened intervals which are part
of the model. We call the segments of the intervals,
that are not covered by the training data, gaps. To
overcome this imprecision of RTI+, we introduce our
novel Interval Distribution Analysis (IDA). IDA uti-
lizes statistical outlier detection to detect and remove
the gaps and, thus, improves the model quality.
The paper is structured as follows: We start with a
description of the algorithm RTI+ which our research
is based on in Section 2. In Section 3 we go into de-
tails of RTI+ and analyze the origin of gaps in intervals.
Furthermore, we describe the negative impact of gaps
in assigning probabilities to sequences. Our conse-
quent next step is to introduce our IDA procedure for
detecting and removing those gaps in Section 4. There
we describe the metrics that IDA uses and how RTI+
and IDA collaborate. Subsequently, we apply RTI+
and IDA to the problem of ATM fraud detection in Sec-
tion 5 to point out the impact of IDA in a practical use
case. Moreover, in Section 6 we give an outlook of the
future development of IDA by describing alternative
algorithms to solve the problem. This is followed by
a review of related work in Section 7. In the end, we
summarize the main points of the paper and conclude
on IDA in Section 8.
2 BASICS: RTI+
In this section we describe the algorithm RTI+ (in-
troduced by Verwer et al. in (Verwer et al., 2010)).
This algorithm identifies real-time behavior models in
polynomial time.
RTI+ is based on the Evidence-Driven State Merg-
ing (EDSM) algorithm (Lang et al., 1998). It computes
a model out of a finite multiset of unlabeled timed
sequences. A timed sequence is a chain of symbols ex-
tended by the time delays between them. As a model,
Witter, F., Klerx, T. and Krohn-Grimberghe, A.
An Interval Distribution Analysis for RTI+.
DOI: 10.5220/0006146603510358
In Proceedings of the 6th International Conference on Pattern Recognition Applications and Methods (ICPRAM 2017), pages 351-358
ISBN: 978-989-758-222-6
Copyright
c
2017 by SCITEPRESS – Science and Technology Publications, Lda. All rights reserved
351

Verwer et al. use a Probabilistic Deterministic Real-
Time Automaton (PDRTA) which is an extended De-
terministic Real-Time Automaton (DRTA) (cf. (Dima,
2001)). A PDRTA is defined as follows:
Definition 1
(PDRTA)
.
A Probabilistic Determinis-
tic Real-Time Automaton (PDRTA) is a four-tuple
A = hA
0
,H, S ,T i, where
• A
0
= hQ, Σ,∆, q
0
i
is a DRTA without accepting
states, where
– Q is a finite set of states
– Σ is a finite set of symbols
– ∆ is a finite set of timed transitions
– q
0
is the start state
• H
is a finite set of histogram bins
h = [v,v
0
]
with
v,v
0
∈ N
• S
is a finite set of symbol probability distributions
S
q
= {Pr(s | q) | s ∈ Σ,q ∈ Q}
• T
is a finite set of histogram bin probability distri-
butions T
q
= {Pr(t ∈ h | q) | h ∈ H,q ∈ Q}
The DRTA is extended by probability distributions for
symbols and time delays which are modeled by global
histogram bins. These probability distributions are
used for learning the model and later also for predict-
ing sequences.
q
0
q
1
δ
a
: a [1, 3]
δ
b
: b [4, 7]
δ'
a
: a [8, 10]
q
2
δ
c
: c [4, 10]
δ
d
: d [1, 10]
δ'
c
: c [1, 3]
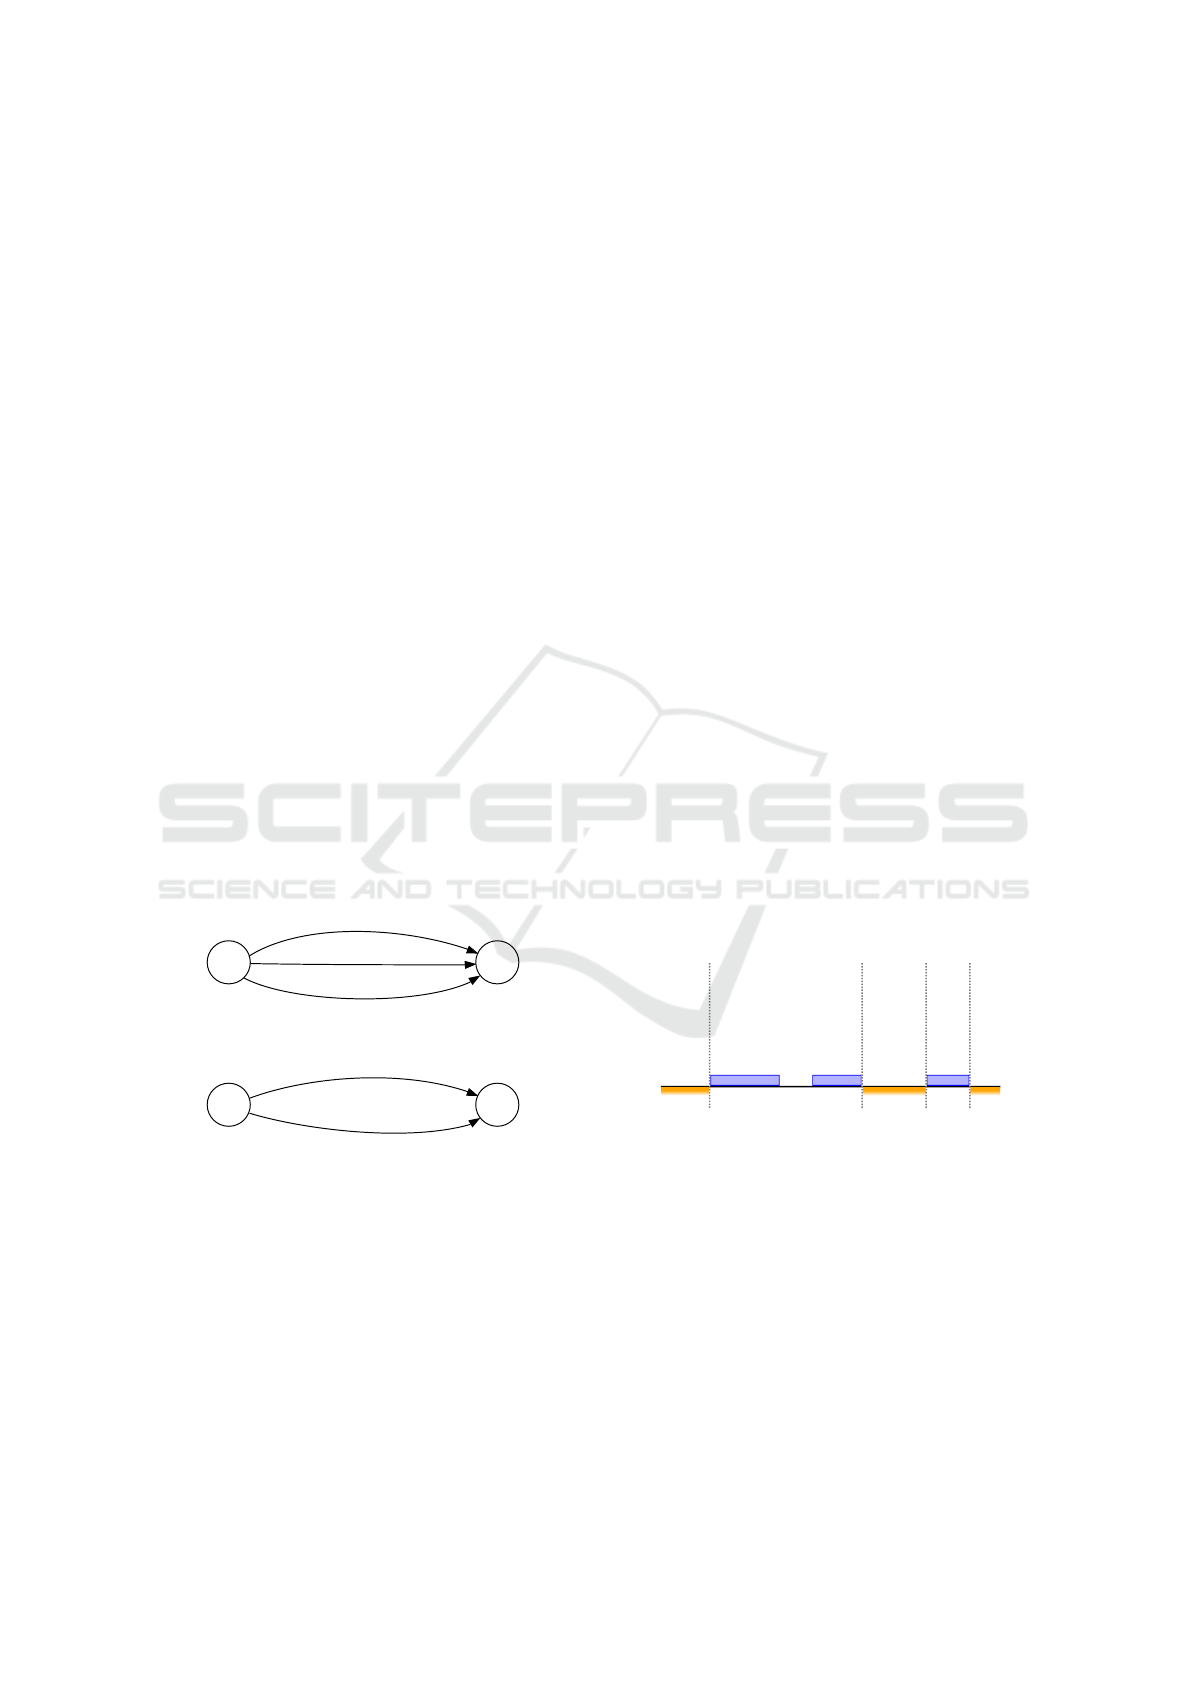
H = { [1, 3], [4, 7], [8,10] }
Figure 1: Example PDRTA with three states and six transi-
tions.
An example PDRTA is shown in Fig. 1. This
PDRTA consists of three states where
q
0
is the start
state indicated by the sourceless transition on the
left.
q
0
has three outgoing transitions which all have
state
q
1
as target. For example when in state
q
0
, the
symbol
a
with a time delay of
2
time units will use
transition
δ
a
. The symbol
a
can also take transition
δ
0
a
when it is delayed with a time in
[8,10]
. The three
histogram bins for time delays are shown below the
automaton structure. For reasons of clarity we do not
show the probability distributions S and T . But there
exist probabilities for each state to be left with a cer-
tain symbol and a time delay in a certain histogram
bin. Both probability distributions are independent of
each other. In the following, we describe the routine
and methods of RTI+ to construct a PDRTA from a
multiset of training sequences.
The goal of RTI+ is to find a small PDRTA that de-
scribes the training sequences sufficiently well. RTI+
starts with generating a Prefix Tree Acceptor from
training sequences. Initially the intervals (time guards)
of the transitions are chosen as the global minimum
and maximum of time delays in the training sequences.
Hence, the structure of the tree is equal to the untimed
version of the tree (when time delays are ignored).
This initial model may be missing time-dependent sub-
structures and may contain multiple similar substruc-
tures. The task of RTI+ is to identify these two types
of substructures. In case of a missing time-dependent
substructure, the PDRTA is specialized (SPLIT), while
in case of multiple similar substructures, the PDRTA
is generalized to compress the model (MERGE).
To improve the initial tree, RTI+ iterates within the
red-blue coloring framework (inherited from EDSM)
over the tree and manipulates it with a MERGE oper-
ation for compression (inherited from EDSM) and a
newly introduced SPLIT operation for specialization.
The pseudo code of this routine can be found in Algo-
rithm 3 in Section 4 alongside with the routine for our
novel distribution analysis.
The MERGE operation is used to generalize the
model by combining two similar substructures into a
new one with a preferably small loss of model qual-
ity regarding the training sequences. The merging
process of the substructures starts by merging two cor-
responding states in each substructure into one state.
All transitions of the two states are preserved which
can cause non-determinism in the outgoing transitions
of the merged state. To solve this problem, all target
states of non-deterministic transitions are merged re-
cursively, too, until the model is deterministic again.
Note that a MERGE operation can also create cycles or
combine two subtrees.
The SPLIT operation has a different goal than a
MERGE. Instead of generalizing the model, SPLITS
aim to specialize by creating time-dependent substruc-
tures that model the training sequences more precisely.
This is done by splitting an interval of a transition at
a certain time value. For the two resulting transitions,
both appending subtrees are recomputed on the basis
of the training sequences. Since a wrong SPLIT can be
made undone by the more powerful MERGE operation,
SPLITS will always be preferred to MERGES.
Usually, many possibilities to perform MERGES
and SPLITS exist in every iteration of RTI+. For de-
termining useful operations and for deciding which of
these operations to perform, Verwer et al. introduce a
statistical Likelihood Ratio Test (LRT) for PDRTAs.
ICPRAM 2017 - 6th International Conference on Pattern Recognition Applications and Methods
352
In each iteration RTI+ tests all possible SPLITS and
MERGES before greedily performing the operation that
results in a PDRTA which should model the training
sequences best. RTI+ may also perform no operation
at all if the actual PDRTA is the best option. Before
presenting our approach to improve SPLITS of time
values we describe and identify the reason for improve-
ment in the next section.
3 GAPS IN INTERVALS
In this section we first describe the problem of RTI+
when creating time intervals of timed transitions, fol-
lowed by two reasons why intervals are identified in-
correctly.
The intervals of the transitions of PDRTAs that are
learned by RTI+ may contain segments that are not
covered by sequences from the training set. In the
following we refer to these segments as gaps.
For demonstrating the influence of RTI+ in creating
intervals with gaps, we use the PDRTA from Fig. 1 to
sample a set of training sequences. Afterwards we let
RTI+ recreate the automaton. For our example we only
consider the transitions between state
q
0
and state
q
1
which are shown in Fig. 2(a). There exist three tran-
sitions
δ
b
,
δ
a
and
δ
0
a
that go from state
q
0
to state
q
1
.
Transition
δ
b
is used for symbol
b
and time delays in
interval
[4,7]
. In addition, transition
δ
a
(resp.
δ
0
a
) is
used for symbol a and interval [1,3] (resp. [8,10]).
q
0
q
1
δ
a
: a [1, 3]
δ
b
: b [4, 7]
δ'
a
: a [8, 10]
(a) Transitions between state
q
0
and state
q
1
in
the original PDRTA shown in Fig. 1.
q
0
q
1
δ
~
a
: a [1, 10]
δ
~
b
: b [1, 10]
(b) Transitions between state
q
0
and state
q
1
in
the PDRTA generated by RTI+.
Figure 2: Differences for an excerpt of the PDRTA in Fig. 1.
The transitions of the PDRTA trained with RTI+
are shown in Fig. 2(b). In contrast to the original
automaton the transitions
δ
a
and
δ
0
a
are now modeled
by a single transition
e
δ
a
. Furthermore, the interval
of
e
δ
b
is extended compared to the original
δ
b
. This
is caused by the disability of RTI+ to detect gaps in
intervals. For
e
δ
b
these gaps are in
[1,3]
and
[8,10]
while for
e
δ
a
the gap is in [4,7].
After exemplarily showing the existence of gaps in
intervals, we investigate the reasons for those gaps to
appear in learned PDRTAs. Fig. 3 shows a visualiza-
tion of the three different types of gaps in an interval.
The blue bars mark segments of time delays that are
covered by sequences of the training set. The gaps are
caused by one of the following reasons:
Symbol Diversity.
Multiple symbols have different
domains of time delays. Since the initial tree is con-
structed with intervals defined by the global minimum
and maximum of delays in the training set, large gaps
may appear at the beginning or the end of intervals (cf.
Fig. 3). The gaps in
e
δ
b
are caused by this effect.
Time Delay Partitioning.
Time delays of a sym-
bol are partitioned into several disconnected subdo-
mains. Intervals then contain gaps between the sub-
domains, e.g. the subdomains
[x,x
0
]
and
[y,y
0
]
with
x ≤ x
0
y ≤ y
0
surround a gap between
x
0
and
y
. This
applies for the gap in the interval of
e
δ
a
. In this exam-
ple we say
3 8
related to the global maximum delay
of
10
. These gaps can be a lot larger in real-world
scenarios. We visualized this gap type in Fig. 3.
Training Set Incompleteness.
The finite set of train-
ing sequences usually does not contain all possible
sequences of the (infinite) model space. Therefore,
some time delays within the domain(s) of a symbol
may not be included in the training set for some states
in the PDRTA. These missing time delays also form
gaps. One of those gaps is shown in Fig. 3. The gaps
of this type may not only appear in between covered
segments but also next to gaps of the other two types.
Time delays
Training Set
Incompleteness
Time Delay
Partitioning
Symbol Diversity
Symbol Diversity
}
}
}
}
Figure 3: Visualization of the different gap types Symbol
Diversity, Time Delay Partitioning and Training Set Incom-
pleteness in an interval.
All of the gap types mentioned above are poten-
tially included in PDRTAs that were learned by RTI+.
But only Training Set Incompleteness is part of the nor-
mal behavior model. Hence, a PDRTA should return
a probability of zero for test sequences that contain
time delays lying in gaps of types Symbol Diversity
and Time Delay Partitioning. This result cannot be
guaranteed since Verwer et al. model the histogram
bin probability distributions independently of the sym-
bol probability distributions. In fact, such sequences
An Interval Distribution Analysis for RTI+
353

can inherit a positive probability from other symbols’
time delays. For example the pair of symbol and
time delay
(a,5)
is not part of the original PDRTA
in Fig. 2(a). Nevertheless, it receives a positive proba-
bility for its time delay from the histogram bin
[4,7]
in the reconstructed PDRTA in Fig. 2(b). This his-
togram bin is only used by pairs with symbol
b
in the
original PDRTA and, hence, in the training sequences.
Thus, the false probability assignment can cause false
sequence predictions and should be avoided.
This problem could be easily overcome by using a
symbol-dependent histogram bin probability distribu-
tion. But when designing RTI+, Verwer et al. decided
to model the probabilities for symbols and histogram
bins independently to avoid that the size of PDRTAs is
increased by a polynomial factor (Verwer et al., 2010).
This feature should be left untouched as the structural
identification ability of RTI+ is recognizably good.
Our approach is to extend RTI+ by a new feature
that simulates symbol-dependency for time delays. In
contrast to the real symbol-dependency, our extension
can be easily adapted and its impact on the resulting
PDRTA can be scaled based on the needs for the cur-
rent problem domain. In the following section we
introduce the new feature called Interval Distribution
Analysis (IDA) in detail.
4 INTERVAL DISTRIBUTION
ANALYSIS (IDA)
In this section we describe the Interval Distribution
Analysis (IDA) that removes segments of intervals that
are not part of the normal behavior model.
Above we described how time delays that are not
part of the model can inherit positive probabilities. In
our approach, we try to avoid this wrong assignment
of probabilities by limiting the paths in the resulting
PDRTA. Thus, sequences which have time delays out-
side of the domains of the corresponding symbols do
not have a path in the PDRTA after the paths have been
limited. We limit the paths by removing gaps from
the intervals of transitions during training. To real-
ize this approach, we use the present SPLIT operation
with a new heuristic to determine and remove empty
segments in intervals.
First, reconsider which gaps should be removed
and which should be kept according to the three cases
described in the previous Section 3. The gaps from
the first two types Symbol Diversity and Time Delay
Partitioning are clearly not part of the normal behavior
of the process to be modeled and should be removed.
In Fig. 3, we underlined the segments that should be
removed from the PDRTA in orange color. On the
contrary the gaps of the third type Training Set Incom-
pleteness are part of the normal behavior that is not
covered by the training set and, hence, should be kept.
To be able to distinguish between gaps to remove
and gaps to keep, we make an initial assumption for
the training set: We assume that the gaps from the
third case Training Set Incompleteness are smaller than
those from the other two cases because the training se-
quences represent the model to be learned adequately.
This transforms the problem to removing only larger
gaps. For detecting the larger gaps, we use statisti-
cal methods for distribution analysis on the distances
between covered elements in an interval. Therefore,
we call our new feature Interval Distribution Analy-
sis (IDA). IDA computes a maximally allowed gap
b
g
for an interval by collecting and analyzing the dis-
tances between neighbored covered elements. For this
analysis, we also consider the distances of size
0
be-
tween directly neighbored covered elements. Thus, we
are able to take connected blocks of covered elements
into account. To compute
b
g
from the collected dis-
tances, we perform a statistical outlier detection. We
use outlier-robust measures since the analyzed distribu-
tions of distances are unknown and our analysis should
not be distorted by outliers. After the outlier detection,
we remove the outlier distances that are larger than the
expected distances and, thus, are gaps.
A suitable measure is the outlier detection with Me-
dian Absolute Derivation (MAD) (Leys et al., 2013).
By using median and MAD, we define
b
g
as the upper
border for outliers as follows:
b
g
MAD
= m + 2.5 · MAD = m + 2.5 · median
{
|x
i
− m|
}
where
m
is the median of the collected distances
x
i
.
This formula is an outlier-robust and, thus, advisable
replacement for the outlier detection with mean and
standard deviation
µ + 2.5 · σ
(Leys et al., 2013). We
chose
2.5
as coefficient of the MAD which is mod-
erately conservative according to Leys et al. To get
b
g
MAD
= 0
, at least
50%
of the distances need to have
a length of 0.
Another way to calculate the border for outliers
is the Interquartile Range (IQR). This is an outlier-
robust standard method in statistics for outlier detec-
tion which was proposed by Tukey (Tukey, 1977).
b
g
is
then defined as:
b
g
IQR
= Q
3
+ 1.5 · IQR = Q
3
+ 1.5 · (Q
3
− Q
1
)
where
Q
i
are the quartiles. This method allows larger
gaps than
b
g
MAD
because more than
75%
of the dis-
tances need to have a length of 0 to get
b
g
IQR
= 0.
After
b
g
has been determined, the interval has to
be segmented at the correct positions with SPLITS to
remove the gaps. The borders of the resulting intervals
should be chosen wisely, especially not directly after a
ICPRAM 2017 - 6th International Conference on Pattern Recognition Applications and Methods
354
Input: A training set with timed sequences S
+
, a set of histogram
bins H and a significance level σ
Output: A small PDRTA A according to the input
1 Initially create PDRTA A as a tree from the input sequences in S
+
2 Color the start state q
0
of A red
3 while A contains non-red states do
4 Color blue all non-red target states of transitions with red
source states
5 Let δ = hq
r
,q
b
,s,[n,n
0
]i be the most visited transition from a
red state q
r
to a blue state q
b
6 if [n,n
0
] is an initial interval then
7 Check interval for empty spaces that should be removed
by performing IDA
8 if there exist such empty spaces then
9 Remove these empty spaces with SPLITS
10 if δ has not been modified by IDA then
11 Evaluate all possible MERGES of q
b
with red states
12 Evaluate all possible SPLITS of [n, n
0
]
13 if the lowest p-value of a SPLIT is less than σ then
14 Perform this SPLIT
15 else if the highest p-value of a MERGE is greater than σ
then
16 Perform this MERGE
17 else
18 Color q
b
red
Algorithm 1: Extended RTI+ (eRTI+) (adapted version of
the pseudo code in (Verwer et al., 2010)) which contains the
new IDA routine (blue, lines 6-10).
covered element. This results from the gap type Train-
ing Set Incompleteness which says that some time
delays may be missing in the training set. Hence, by
splitting the interval not directly before or after a cov-
ered element, we want to create small gaps of type
Training Set Incompleteness. For a margin between a
SPLIT position and covered elements, we chose
d
b
g
/2e
.
Thus, a gap between two neighbored covered elements
is at most of size
b
g
and the distance from the interval
borders to the first or last covered element is
d
b
g
/2e
after
the interval has been split according to IDA.
Our new IDA procedure has now to be integrated
into RTI+. We call this alternative procedure Extended
RTI+ (eRTI+). The empty gaps should only be re-
moved once from initial and untouched intervals. If
IDA would be applied again to a resulting interval,
IDA might lead to removing even more gaps unin-
tentionally from this interval. Hence, the following
change in the iteration routine of RTI+ will be applied
(cf. Algorithm 3, lines 6-10). After identifying the
most visited transition, RTI+ checks if the according
interval borders are the global minimum and maximum
of time delays in the training set which gives evidence
whether IDA already processed this interval. If the
interval is initial, IDA will be performed afterwards to
determine whether or not gaps can be removed from
the interval. If there are any gaps, they will be re-
moved with SPLITS and the iteration ends because the
determined most visited transition no longer exist in its
original form and has to be recomputed. If no gaps can
be removed, the original iteration routine with testing
SPLITS and MERGES will be performed.
To show the usefulness of our new feature, we re-
run our experiment from the beginning of Section 3.
But this time we deploy eRTI+ for reconstructing the
PDRTA. Within IDA we use
b
g
MAD
for determining
the maximally allowed gap. With the help of IDA
we are able to identify all transitions and intervals ex-
actly. Hence, all gaps have been detected and removed
correctly. Note that by using
b
g
IQR
, an exact reconstruc-
tion was not possible since
b
g
IQR
allows larger gaps
than
b
g
MAD
. Nevertheless, even with
b
g
IQR
we achieved
a PDRTA that is closer to the original one than the
PDRTA generated by the original RTI+ (cf. Fig. 2).
All in all, we are able to reduce or eliminate false
probability assignments for sequences by using IDA
in support of RTI+. With this result in mind, we evalu-
ate IDA in experiments on ATM fraud detection with
real-world data in the following section.
5 EXPERIMENTS WITH ATM
LOG DATA
In this section we compare RTI+ and eRTI+ in the
context of anomaly detection to detect ATM fraud.
When withdrawing money from an Automated Teller
Machine (ATM) the user usually inserts a card, enters
a pin, chooses the amount of money, takes out the card
again and finally the money. A delay is present be-
tween every of these steps. Additionally, some users
e.g. just insert the card without entering the pin but
pushing the cancel button and aborting the withdraw-
ing. Hence, a PDRTA is a suitable behavior model for
the withdrawing sequences of ATMs.
We use data from a publicly available ATM that
was gathered in the period of nine months. In this time
no attacks were registered, so the data set comprises
normal sequences with 15 million events, resulting in
size of
1.6
GB. To be able to measure the anomaly de-
tection effectiveness of RTI+ and eRTI+ we need data
containing fraud (attempts). As it is almost impossible
to get real-world data of ATM fraud and since the sim-
ulation in a laboratory is very expensive, we choose
to insert anomalies randomly into normal sequences.
Hence, we modify a normal sequence by either switch-
ing two events in a sequence (anomalous event) or
multiplying a single time value in a sequence (anoma-
lous event timing). For a given PDRTA
A
(learned
from normal sequences) we decide whether a given
sequence
s
is normal by calculating the probability of
An Interval Distribution Analysis for RTI+
355
s
given
A
. We do so by traversing the PDRTA
A
and
computing the symbol and time probability in every
state using the symbol and time probability distribu-
tions
S
and
T
. Then, we multiply all probabilities and
normalize by dividing by sequence length. Finally, we
compare the result of these operations with a threshold
and decide whether the given sequence
s
is abnormal
with respect to the PDRTA A.
For testing, we implemented four variants of IDA:
v1:
Use
b
g
MAD
and remove all gaps discovered by IDA
v2: Use
b
g
IQR
and remove all gaps discovered by IDA
v3:
Use
b
g
MAD
and remove only border gaps according
to IDA
v4:
Use
b
g
IQR
and remove only border gaps according
to IDA
We only present the results of IQR while removing
only border gaps (v4) or all gaps (v2). We do not show
the results of IDA with MAD because it always per-
formed worse than IQR (opposed to experiments with
artificial data). We measure the effectiveness of IDA
in terms of precision, recall and F-measure. The preci-
sion is the ratio between correctly detected anomalies
and all detected anomalies, while the recall is the ratio
between detected anomalies and all anomalies. The F-
measure (F1) is the harmonic mean between precision
and recall. In real-world scenarios a high precision
(low false positive rate) often improves existing busi-
ness cases without any negative side effect. Neverthe-
less, we want to detect all anomalies, thus present the
recall. The F-measure can be regarded as the trade-off
between precision and recall. Figures 4 and 5 show the
result of applying RTI+ with and without IDA when
optimizing for F1 and precision.
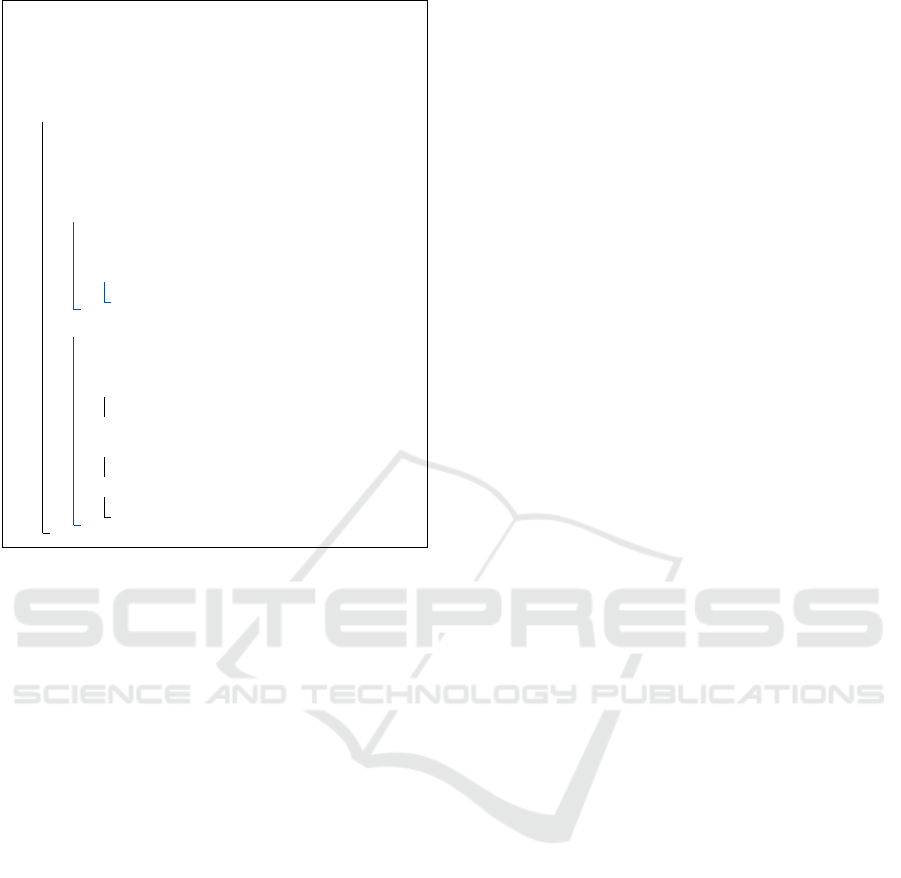
In general, IDA with IQR improves the recall and
often the F-measure. Additionally, IDA leads to more
false positives because more normal sequences have
no path in the inferred automaton as IDA removed
gaps on purpose.
When optimizing for F1 (Fig. 4), IDA v4 improves
the recall without a loss of precision while IDA v2
decreases recall and precision. The results in Fig. 5
(precision) are two fold. IDA variants 2 and 4 improve
recall and F1 at the cost of lower precision. As in
Fig. 4 IDA v4 achieves a similar precision as RTI+
but a higher recall while v2 drastically decreases the
precision. In the scenario of ATM fraud detection a
high precision is more important than a high recall
because false positives (low precision) are costly caus-
ing technicians to examine the ATM, whereas a recall
greater zero already yields an improvement.
Note that we applied eRTI+ with the same hyper-
parameter setting that we used for RTI+ to show the
change caused by IDA. Maybe, we could achieve a
orig. RTI+
eRTI+ with
IDA v4
eRTI+ with
IDA v2
0.2
0.4
0.6
0.8
0.67
0.67
0.55
0.49
0.55
0.48
0.56
0.6
0.51
2.44 · 10
−2
3.04 · 10
−2
4.33 · 10
−2
precision
recall
F-measure
normal seq. w/o path
Figure 4: Precision, recall, F-measure and relative frequency
of normal sequences without path for original RTI+ and
eRTI+ with IDA variants v4 and v2. The results had the best
F-measure for their RTI+ variant.
orig. RTI+
eRTI+ with
IDA v4
eRTI+ with
IDA v2
0.2
0.4
0.6
0.8
1
0.87
0.81
0.55
0.18
0.39
0.48
0.29
0.52
0.51
2.96 · 10
−3
1.04 · 10
−2
4.33 · 10
−2
precision
recall
F-measure
normal seq. w/o path
Figure 5: Precision, recall, F-measure and relative frequency
of normal sequences without path for original RTI+ and
eRTI+ with IDA variants v4 and v2. The results had the
highest precision with recall greater zero for their RTI+ vari-
ant.
better result when tuning the hyperparameters directly
for eRTI+ because RTI+ is very sensitive with respect
to the hyperparameter configuration. Additionally, the
real-world data set may cause odd results because the
data-generating process is not controllable.
All in all, IDA usually improves the F-measure and
recall compared to RTI+ in the ATM context. On the
other hand the precision most often drops which is not
desirable for ATM fraud detection. For other scenarios
a high F-measure may be more important than a high
precision, gaining a benefit from applying RTI+ with
IDA.
6 FUTURE WORK
During the development of IDA, we already had some
ideas to advance the IDA procedure. In this section,
we describe how we can apply alternative algorithms
to solve the IDA problem. Furthermore, we propose a
new approach for IDA and RTI+ to work together.
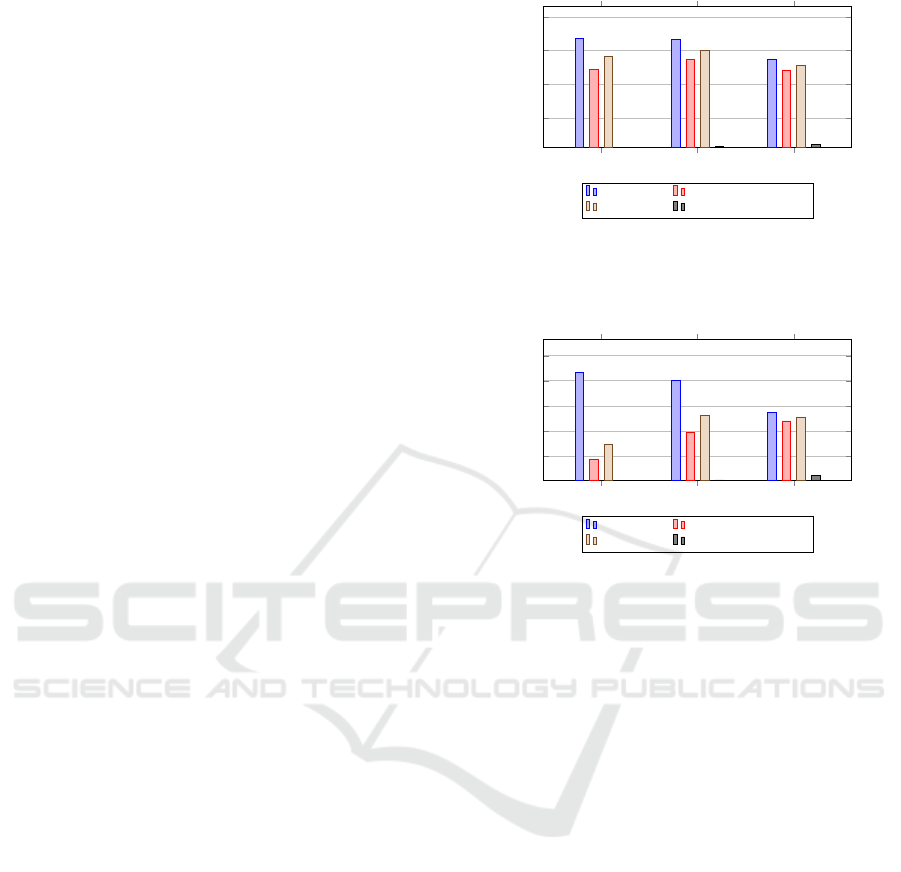
First, we interpret IDA in a different way: From a
more general perspective, the IDA procedure solves a
(one-dimensional) density-based clustering problem
ICPRAM 2017 - 6th International Conference on Pattern Recognition Applications and Methods
356
without a predefined number of clusters. In the con-
text of IDA, the unsplit segments of an interval form
clusters and the gaps between the clusters are removed.
Therefore, we can use established clustering algo-
rithms to identify gaps in an interval. Possible algo-
rithm candidates are DBSCAN (Ester et al., 1996),
OPTICS (Ankerst et al., 1999), and X-means (Pelleg
and Moore, 2000). By considering the frequency be-
sides the raw time values, we can transform IDA into
a two-dimensional clustering problem. This exten-
sion to two dimensions might lead to better results. In
Fig. 6(a) we show how IDA could look like with a clus-
tering algorithm. The histogram values are combined
into three clusters. The interval segments that are not
covered by a cluster are removed (orange underlin-
ing), while the covered segments are kept. Since the
density-based distance might be less important than
the time-based distance, we can think of an additional
weight parameter for eRTI+.
Time delays
Events per time delay
(a) The IDA problem solved with a two-
dimensional clustering algorithm. Four gaps
are detected.
Time delays
Events per time delay
(b) The IDA problem solved with a density
function. Three gaps are detected.
Figure 6: Alternative approaches for solving the IDA prob-
lem.
Apart from clustering, a completely different ap-
proach would be to learn a density function of the inter-
val where the parts without sequences will contain no
data. The method we use for learning the density can
be Kernel Density Estimation (Parzen, 1962) among
others. The learned function will possibly approach
zero for large gaps with high slope. We can split the
interval at the points where the density function ap-
proaches zero. Fig. 6(b) shows how the IDA problem
is solved with a density function. The density func-
tion is constructed from the histogram values and ap-
proaches zero four times. The interval segments where
the density function is zero are removed (orange).
As an alternative to density functions, we can also
fit general polynomials to the interval data. Accord-
ingly, we can chose from a wider range of methods,
e.g. Support Vector Regression (Drucker et al., 1997).
In contrast to density functions, general polynomials
can have values below zero where the slope is high.
Hence, we can identify gaps where the polynomial
is below zero and perform the necessary SPLITS at
the zero-crossings. By considering a high slope of a
learned function as an indicator for gaps, this approach
might produce more natural results than the original
IDA or the clustering approach.
Besides using alternative algorithms for IDA, we
can also alternate the strategy of applying IDA. Instead
of applying it actively during the training of a PDRTA,
we could also apply IDA passively on the final PDRTA
after RTI+ has terminated. We then iterate over all
states of the PDRTA and apply IDA to all outgoing
transitions of each state. If a transition between two
states is split, the new transitions will be created in
parallel between the same two states. Hence, the num-
ber of states in PDRTA is not increased by IDA and
the basic structure is preserved. With this new strategy
we want to avoid inconsistencies between the LRT and
IDA. With our original strategy (cf. Algorithm 3) this
inconsistency might occur when eRTI+ merges two
states based on the LRT which have already been pro-
cessed by IDA. Since the LRT cannot consider gaps, it
is possible that sequences from one state are merged
into the removed gaps of the other state. This will
negatively affect the quality and size of the PDRTA.
We can avoid this risk if we apply IDA on the PDRTA
after RTI+ finished the identification.
Based on the various possibilities to create alterna-
tive IDA procedures and apply them in two different
ways, we are confident to develop procedures that
are applicable to many different types (e.g. crude or
smooth) of training data. The validation of those pro-
cedures will be part of our future research.
7 RELATED WORK
Besides RTI+ other algorithms also infer automata
inference from timed sequences. In this section we
review other approaches and point out differences.
In (Verwer et al., 2012) Verwer et al. describe the
Real-Time Identification (RTI) algorithm. It is based
on the same idea as RTI+ but infers a DRTA with
accepting and rejecting states. Therefore, it requires
positive and negative labeled sequences for training.
The Bottom-Up Timed Learning Algorithm
(BUTLA) (Maier, 2015) learns a Probabilistic Deter-
ministic Timed Automaton (PDTA; very similar to a
PDRTA) from positive timed sequences. Opposed to
RTI+, BUTLA only performs a merge operation but
no split. Instead, it performs a global preprocessing of
An Interval Distribution Analysis for RTI+
357

all time values by fitting kernel density estimators and
computing their local minima. For every local mini-
mum BUTLA creates a subevent. This preprocessing
shall remove the necessity of split operations.
In (Klerx et al., 2014) a Probabilistic Determin-
istic Timed-Transition Automaton (PDTTA) and an
algorithm for learning PDTTAs are presented. The
learning algorithm does not split events (like BUTLA)
or transitions based on time values (like RTI+). In-
stead, it learns the event structure using any state-
of-the-art algorithm (e.g. ALERGIA; (Carrasco and
Oncina, 1994)) and approximates the time values per
transition via kernel density estimators. Hence, it mod-
els the time behavior in more detail, is easier to learn,
but cannot detect temporal substructures.
8 CONCLUSION
RTI+ is an efficient algorithm that learns PDRTAs
from timed sequences. We have revealed a deficit of
RTI+ in learning broadened intervals for time values.
Combined with the independence of symbol and time
probability distributions, this deficit leads to wrong
predictions of sequences. We have investigated that
two of three types of gaps cause the broadened inter-
vals and developed our novel IDA procedure to remove
those gaps. IDA has been integrated into the RTI+ al-
gorithm, which we now call Extended RTI+ (eRTI+).
We have shown that IDA is an effective way to elim-
inate the disadvantage of the independent time and
symbol probability distributions used by RTI+. For
our experiment with an artificial example PDRTA, IDA
was able to identify and remove all gaps in intervals.
IDA was also able to improve the results in the exper-
iment with ATM fraud detection. Although IDA did
not work optimal on this real-world data, we are confi-
dent that this result can be improved further. IDA is a
very flexible and adaptable procedure. As mentioned
in Section 6, we want to apply IDA after RTI+ has
terminated instead of integrating IDA into the proce-
dure in the future. Furthermore, we plan to replace our
statistical outlier detection by established clustering
algorithms and density estimation procedures.
REFERENCES
Ankerst, M., Breunig, M. M., Kriegel, H.-P., and Sander,
J. (1999). OPTICS: Ordering Points to Identify the
Clustering Structure. In SIGMOD’99, ACM Interna-
tional Conference on Management of Data, pages 49–
60. ACM.
Carrasco, R. C. and Oncina, J. (1994). Learning Stochas-
tic Regular Grammars by Means of a State Merging
Method. In ICGI’94, 2nd International Colloquium
on Grammatical Inference and Applications, pages
139–152. Springer.
Dima, C. (2001). Real-Time Automata. Journal of Automata,
Languages and Combinatorics, 6(1):3–23.
Drucker, H., Burges, C. J. C., Kaufman, L., Smola, A. J.,
and Vapnik, V. (1997). Support Vector Regression Ma-
chines. In NIPS’96, 9th Neural Information Processing
Systems Conference, pages 155–161. MIT Press.
Ester, M., Kriegel, H.-P., Sander, J., and Xu, X. (1996). A
Density-Based Algorithm for Discovering Clusters in
Large Spatial Databases with Noise. In KDD’96, 2nd
International Conference on Knowledge Discovery and
Data Mining, pages 226–231. AAAI Press.
Klerx, T., Anderka, M., Kleine B
¨
uning, H., and Priesterjahn,
S. (2014). Model-Based Anomaly Detection for Dis-
crete Event Systems. In ICTAI’14, 26th IEEE Interna-
tional Conference on Tools with Artificial Intelligence,
pages 665–672. IEEE Computer Society.
Lang, K. J., Pearlmutter, B. A., and Price, R. A. (1998). Re-
sults of the Abbadingo One DFA Learning Competition
and a New Evidence-Driven State Merging Algorithm.
In ICGI’98, 4th International Colloquium Conference
on Grammatical Inference, pages 1–12. Springer.
Leys, C., Ley, C., Klein, O., Bernard, P., and Licata, L.
(2013). Detecting Outliers: Do Not Use Standard
Deviation around the Mean, Use Absolute Deviation
around the Median. Journal of Experimental Social
Psychology, 49(4):764–766.
Maier, A. (2015). Identification of Timed Behavior Mod-
els for Diagnosis in Production Systems. PhD thesis,
University of Paderborn.
Parzen, E. (1962). On Estimation of a Probability Den-
sity Function and Mode. The Annals of Mathematical
Statistics, 33(3):1065–1076.
Pelleg, D. and Moore, A. W. (2000). X-means: Extending
K-means with Efficient Estimation of the Number of
Clusters. In ICML’00, 7th International Conference on
Machine Learning, pages 727–734. Morgan Kaufmann
Publishers Inc.
Tukey, J. W. (1977). Exploratory Data Analysis. Pearson.
Verwer, S., de Weerdt, M., and Witteveen, C. (2010). A
Likelihood-Ratio Test for Identifying Probabilistic De-
terministic Real-Time Automata from Positive Data.
In ICGI’10, 10th International Colloquium Conference
on Grammatical Inference, pages 203–216. Springer.
Verwer, S., Weerdt, M., and Witteveen, C. (2012). Efficiently
Identifying Deterministic Real-Time Automata from
Labeled Data. Machine Learning, 86(3):295–333.
ICPRAM 2017 - 6th International Conference on Pattern Recognition Applications and Methods
358
