
Development and Application of GIS-based Information System of
Landslide Hazard Map Induced by Earthquakes and Rainfall in
Korea
Han-Saem Kim
1
and Choong-Ki Chung
2
1
Earthquake Research Center, Korea Institute of Geoscience and Mineral Resources, Daejeon, Korea
2
Department of Civil and Environmental Engineering, Seoul National University, Seoul, Korea
Keywords: Information System, Landslide Hazard Map, GIS, Earthquake, Rainfall.
Abstract: Securing the slope stability for earthquake and rainfall by analysing the behaviour of slope structure is one
of the most important parts in landslide disaster preparation, especially in Korea including many mountain
areas. However, there is still a lack of systematic research on securing the slope stability for earthquake and
rainfall in Korea. Therefore, the systematic research on factors affecting the slope stability and evaluation
method of slope stability considering earthquake and rainfall induced factors should be needed. In this
study, integrated information system of landslide hazard map during earthquake and rainfall was developed.
The developed system built, within the frame of GIS, consists of a database (DB) containing all site
information and processed data in the system in the standard data formats, and the system software
performing various functions to manage and utilize the data in the database. The system software is
functionally divided into an input module, earthquake-induced landslide assessment module, rainfall-
induced landslide assessment module, and hazard mapping module. Study area is Cheonggye Mountain and
Deogyu Mountain in Korea, and landslide hazard map is constructed by using amplification factor obtained
from geometrical characteristics of slope and Severity Level linked with rainfall datasets based on the
developed system.
1 INTRODUCTION
Landslides are one of the most damaging natural
hazards in mountainous terrains with heavy
torrential rainfall as is in the case of Korea. Debris
flow damage includes losses in human life,
destruction of various facilities, damages to roads,
pipelines, and vehicles (Jakob and Hungr, 2005).
Mostly, post-event repair processes and works have
been only executed after debris-flow occurrences.
Recently, there has been an increase in both the
number of occurrences and costs for
countermeasures of debris-flows in Korea. In order
to sufficiently manage infrastructure from debris
flow occurrences, a method or system to assess the
hazard of debris flows during certain rainfall events
in a regional scale was needed.
Meanwhile, seismically triggered landslides are
one of the most damaging hazards associated with
earthquakes. They can not only cause the damage to
lives and structures directly, but also cease the
operation of the whole social systems by making the
roads and/or lifelines useless. For these reasons,
securing the slope stability for earthquake by
analysing the behaviour of slope structure is one of
the most important parts in earthquake preparation,
especially in Korea including many mountain areas.
However, there is still a lack of systematic research
on securing the slope stability for earthquake in
Korea. In this research, the systematic research on
factors affecting the slope stability for earthquake
and evaluation method of slope stability considering
earthquake induced factors should be needed.
Geographic Information System (GIS)
technologies could provide a powerful tool to model
the landslide hazards for their spatial analysis and
prediction (Mukhlisin et al., 2010). This is because
the collection, manipulation and analysis of the
environmental data on landslide hazard can be
accomplished much more efficiently and cost
effectively (Carrara and Guzzetti, 1999; Guzzetti et
al., 1999; Ghafoori and Lashkaripour, 2009;
Mukhlisin et al., 2010). Many GIS-based analysis
Kim, H-S. and Chung, C-K.
Development and Application of GIS-based Information System of Landslide Hazard Map Induced by Earthquakes and Rainfall in Korea.
In Proceedings of the 2nd International Conference on Geographical Information Systems Theory, Applications and Management (GISTAM 2016), pages 227-234
ISBN: 978-989-758-188-5
Copyright
c
2016 by SCITEPRESS – Science and Technology Publications, Lda. All rights reserved
227
models and quantitative prediction models of
landslide hazard have been proposed since the
beginning of GIS application in geo-hazards
research in the late 1980s (Carrara, 1983; Carrara et
al., 1991, 1995, 1999; Jade and Sarkar, 1993; Chung
et al., 1995, Chung and Fabbri, 1998, 1999, 2001).
In this study, integrated information system of
landslide hazard map during earthquake was
developed. The developed system built, within the
frame of GIS, consists of a database (DB) containing
all site information and processed data in the system
in the standard data formats, and the system software
performing various functions to manage and utilize
the data in the database. The system software is
functionally divided into an input module,
earthquake-induced landslide assessment module,
rainfall-induced landslide assessment module, and
hazard mapping module. For the earthquake-induced
landslide hazard, study area was Cheonggae
Mountain in Korea, and two-dimensional landslide
hazard map for dynamic factor of safety and
Newmark displacement was constructed by using
amplification factor obtained from geometrical
characteristics of slope based on the developed
system. And the rainfall-induced landslide hazard
module was applied on three expressway sections in
Korea; the Deogyu Mountain area of the Daejun-
Jinju Expressway. The reliability of the assessment
method was investigated by comparing actual
debris-flow occurrence and non-occurrence cases.
2 FRAMEWORK FOR
LANDSLIDE HAZARD
ASSESSMENT INDUCED BY
MULTI-SOURCE
2.1 Methodologies for Landslide
Hazard Assessment during
Earthquake
To evaluate the site-specific landslide hazard during
earthquake for macro-zonation of Korea (over 4 km
2
unit area), the digital map contained topography
layer (having digital elevation model) are usually
utilized as the backbone datasets (Kim, 2014). In
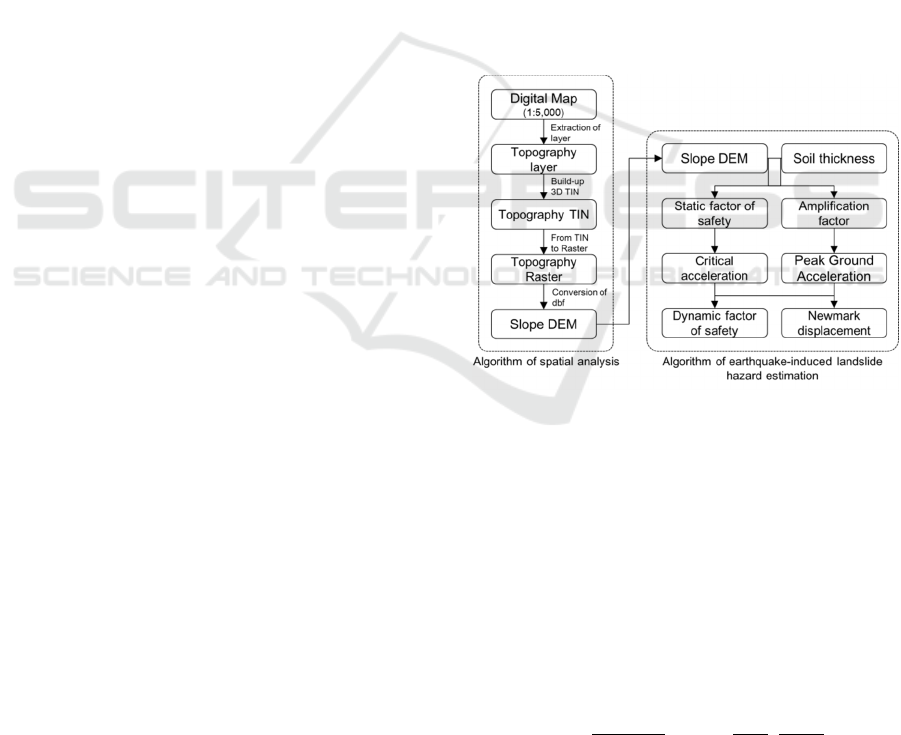
this study the, the systematic procedure for
earthquake-induced landslide hazard assessment
using digital map was newly proposed to develop
the digital information system (Figure 1).
For the processing of spatial analysis based on
ArcGIS, digital map (1:5,000 scales) provided by the
National Geographic Information Institute of Korea
was used. Of the entities within the digital map, only
the topography layers (type of polyline) entities were
extracted and used. With the elevation layers,
triangulated irregular network (TIN) was used for
construction of 2D continuous elevation and slope
DEM (type of raster). According to the algorithm of
TIN, TIN is a vector-based representation of the
physical land surface or sea bottom, made up of
irregularly distributed nodes and lines (Booth, 2000;
Shekhar and Xiong, 2008). The vertices of each
triangle are sample data points having three-
dimensional coordinates. These sample points are
linked with lines to form Delaunay triangles
(Shekhar and Xiong, 2008). The TINs are used to
store and display surface models of target area.
Linked with the DEM obtained from algorithm of
spatial analysis, landslide hazard during earthquake
can be simply estimated through the dynamic factor
of safety and the Newmark displacement derived
horizontal amplification factors for flexible slope
with inclined bedrock (Lee et al., 2014).
Figure 1: Systematic procedure architecture for landslide
hazard assessment during earthquakes.
To evaluate the seismic stability of a landslide,
both the pseudo-static method and the Newmark
sliding block method (1965) are most often used
simultaneously. In both methods, the target area is
assumed to have an infinite slope. To obtain the
factor of safety of the slope in a static condition, a
relatively simple limit-equilibrium model of an
infinite slope in material having both friction and
cohesive strength can be used. The factor of safety
(FS) in static conditions is as follows:
sin
1
γ
tan
tan
(1)
The pseudo-static method for seismic slope stability
is based on assumptions of the limit equilibrium and
GISTAM 2016 - 2nd International Conference on Geographical Information Systems Theory, Applications and Management
228
is still the most popular method in geotechnical
engineering practice. The pseudo-static analysis
provides an index of stability (the factor of safety)
but no information concerning deformations
associated with slope failure. Because the
serviceability of a slope after an earthquake is
controlled by deformations, analyses that predict
slope displacements provide a more useful
indication of the seismic slope stability (Kramer,
1996; Yin 2014). Newmark's method (1965) is a
landslide model to determine the cumulative
displacement of a landslide as a rigid-plastic block
that slides on an inclined plane.
2.2 Methodologies for Landslide
Hazard Assessment during Rainfall
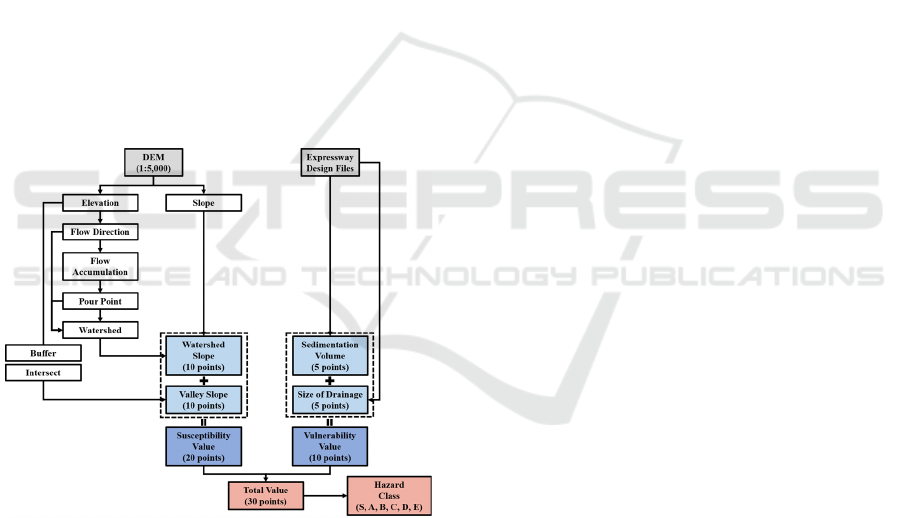
For the processing of attributes included in the KEC
method, a systematic sequence using the software
ArcGIS 10.1 was newly proposed (Figure. 2).
Various ArcGIS tools such as the [Spatial Analyst
Tools] and the [Analysis Tools] were used for a
quantitative and objective assessment of the
attributes.
Figure 2: Systematic procedure architecture for landslide
hazard assessment during rainfall.
For the processing of watershed slope and valley
slope datasets, DEMs provided by NGII of Korea
were used. Numerical maps with the highest
resolution were those of 1:1,000 scales. However,
1:1,000 scale numerical maps were only provided
for major urban areas. Because numerical maps of
the highest resolution provided for the whole Korean
Peninsula were those of 1:5,000 scales, numerical
maps with the scale of 1:5,000 were implemented in
the attribute processing for the Susceptibility Value.
Of the entities within the DEMs, only the
polyline entities having to elevation value were
extracted from numerical map and used for
construction of DEM. Because the system focuses
on the debris flow hazard assessment of expressway
facilities, the expressway layers were selected. For
the processing of slopes in the surround area of
expressway, elevation layers were also selected.
With the elevation layers of DEMs, elevation and
slope raster with the smallest cell sizes possible were
obtained. Because the minimum cell size that could
be considered with 1:5,000 DEMs were 5 meters,
raster with cell sizes of 5 by 5 meters were
processed. Based on the elevation raster, the flow
direction data sets were computed. The [Flow
Direction] tool creates a raster of flow direction
from each cell to its steepest downslope neighbour
(Olivera et al., 2002). From the flow direction raster,
the flow accumulation datasets were obtained. The
[Flow Accumulation] tool creates a raster of
accumulated flow into each cell. With a flow
accumulation grid, valleys may be defined through
the use of flow accumulation value (Olivera et al.,
2002). For a more accurate visualization of valley
areas, the properties of the flow accumulation grids
were altered in various ways. Through trial and
error, along with comparison with the actual field
investigations, the standard deviation of 0.1 was
concluded to visualize the valleys in the most
appropriate and realistic way.
After setting a pour point (output point) on the
route of the assessed expressway, the flow direction
and pour point were taken into consideration to
obtain the watershed. The [Watershed] indicates the
drainage areas contributing flow from the land
surface to the water system. Through the [Extract by
Mask] tool, the slopes of the cell in the watershed
area were obtained. Through the histogram in the
raster properties, the values for attributes of mean
watershed slope and area percentage of watershed
with slopes over 35° were acquired.
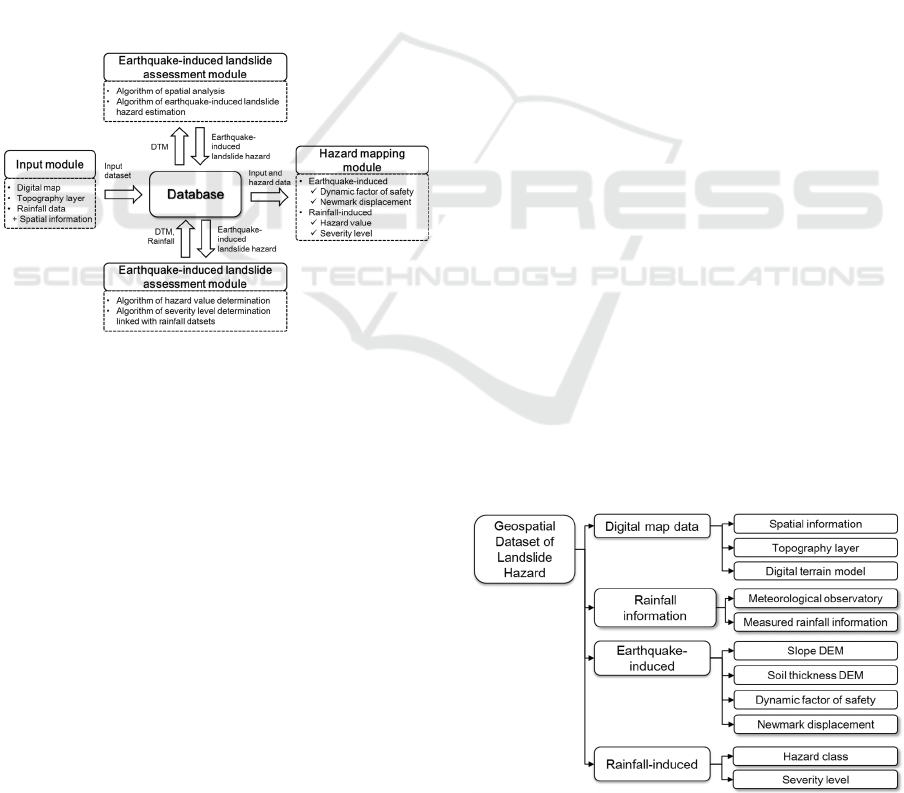
2.3 System Program
Based on the design schema described above, the
system structure consisting of a database and three
modules was established, as shown in Figure 2. The
spatial database using GIS platform is the backbone
of the developed system. It stores not only primary
collected field data such digital map, and topography
layer, rainfall datasets but also secondary processed
data obtained from the application of the modules of
the system. An input module provides an effective
way to store and arrange all collected field data in
Development and Application of GIS-based Information System of Landslide Hazard Map Induced by Earthquakes and Rainfall in Korea
229
the DB according to standard data formats (Figure
3). In the earthquake-induced landslide assessment
module, spatial analysis algorithm using digital map
and landslide hazard estimation algorithm are
designed as functional program language for
automatically systematic procedure (Figure 1). The
debris flow framework has four functional phases
with the database based on proposed schematic
sequence of debris flow hazard assessment (Figure
2). The hazard mapping module provides visual
functions such as 2D plane views, and 3D views
together with tabular formats in real-time.
With system software installed in a client PC,
connected to the server by network, a user manages
and utilizes the information in the DB. The system
software focuses on user friendly functions and real-
time applications. In particular, field data can be
entered into the DB very simply. Once stored in the
DB, all data can be utilized without difficulty in
each module of the system software.
Figure 3: Composition of framework for landslide hazard
assessment during earthquakes and rainfall.
Microsoft SQL Server was chose for the
GDBMS (Geospatial DataBase Management System)
of the developed system because of the robustness
and scalability of its GDBMS. Residing on the DB
server, the GDB contains information on all seven
classes: three primary collected field data and four
processed data. The data was standardized by
accompanies by establishing a relation between
geographic locations and other attribute information.
The primary classes of the data model and relations
between these classes are shown in Figure 4.
DB is the basic data format for GISs to refer to
attribute information, and to correlate and analyse
various datasets spatially. DB of the developed
system was established based on a two-dimensional
coordinate system. Sub-areas for a wide target area
are generally used in fields to promote the efficiently
of site-specific landslide hazard management. Also,
a digital map can be used as basic topographical
information of the system because it offers an easy
way to construct topographical information for a
target area. And topography layer (polyline) and
digital terrain model (raster) are extracted from
digital map to construct the DEM having numerical
spatial information.
Earthquake-induced landslide hazard information
consists of DEM information contained spatial
analysis results and hazard parameters. Spatial
analysis results contain the slope DEM, and soil
thickness DEM. And the hazard information
(dynamic factor of safety, Newmark displacement)
are automatically determined and stored in to
database with DEM.
Rainfall-induced landslide hazard information is
constructed according to the three phases. The first
phase, linked with the digital numerical map and
DEM, the watershed DEM and valley layer are
extracted using ArcGIS desktop program and input
system DB. And second phase, the susceptibility
value and venerability value for target route are
constructed into DB combined with geospatial
information. And the third phase, to transmit the
reliable rainfall monitoring data for target route from
the widely distributed meteorological observatory
server in real-time basis, the routes completed site
investigation for debris flow hazard were grouped
into the same datasets focusing on the adjacent
rainfall station in certain area. In addition, the
rainfall value for debris flow hazard assessment are
automatically computed based on monitoring
criterion with rainfall recurrence periods for road
design in Korea as soon as input rainfall monitoring
data to DB. Finally, following rainfall threshold
level for debris flow hazard (from KEC method),
severity levels composed of safe, caution, and
danger are determined as map symbol at target route
in real-time and alarmed as sound signal and
message window to notify the hazard status.
Figure 4: Database schema.
GISTAM 2016 - 2nd International Conference on Geographical Information Systems Theory, Applications and Management
230
Management of input or analysis results data is
the fundamental and indispensable function to run
the system software based on the DB. Therefore,
prior to input of attribute information, landslide
hazard information must be inputted in the DB.
Management of data is performed in the independent
window form according to the database structure.
Based on the management module, sub-modules are
combined using management program with
automated linking procedure: input module,
earthquake-induced landslide assessment module,
rainfall-induced landslide assessment module and
hazard mapping module.
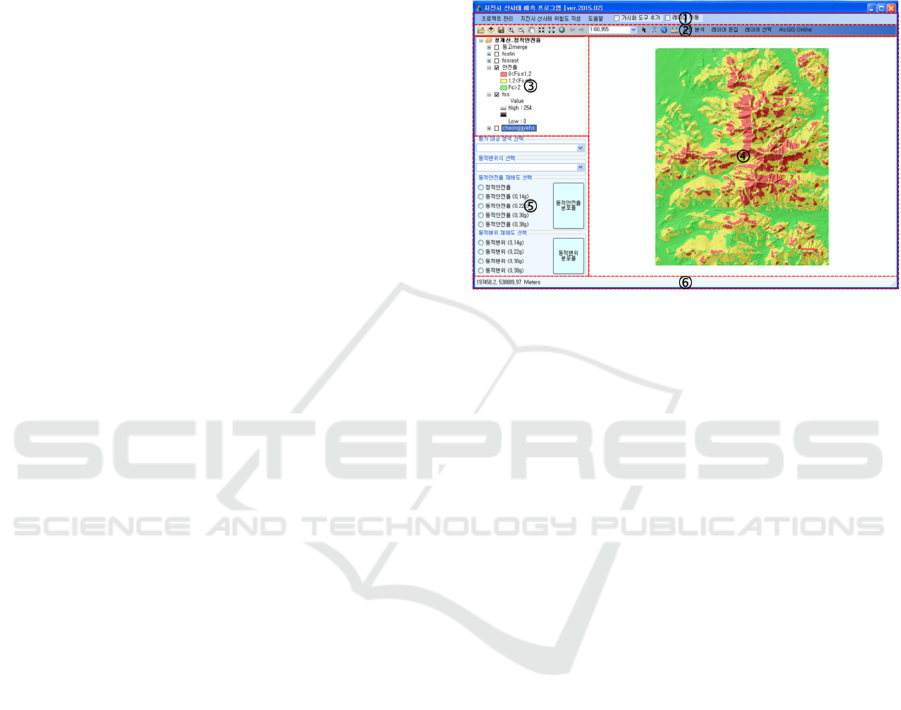
The main management program has various
functions: menu (), visualization tool (), layer
content (), map view (), set-up window of
earthquake scenario (), spatial coordinate content
(). From the menu, when users select the menu
function, the related sub-modules can be
implemented as sharing database. And site
information inputted from input modules and
landslide hazards estimated proposed assessment
framework are visualized on the map view, which
display the 2D spatial distribution of the satellite
map.
Project information and topographic information
of site information are managed in a same window
form, because this information generally is used to
identify locations of attribute information spatially.
Also, digital or satellite map are directly converted
into topographic information. Considering the
efficiency of data management, input of geographic
information for sub-area information and attribute
information was designed to be performed in input
window forms for attribute information. Geographic
information for attribute information is used to
display locations of attribute information on
topographic map, that is, background map. The
window forms for management of geographic
information for target site are shown Figure4.
Even though the earthquake and rainfall events
are rapidly occurred at wide region, site-specific
earthquake-induced landslide hazard assessment,
which is established by considering the
amplification factor obtained from geometrical
characteristics of slope. And these methods are not
simply applied at various site conditions, as
providing possible landslide hazard in every
instance. Therefore the wizard functions for
sequential earthquake-induced landslide hazard
assessment are developed in the integrated system.
And the wizard functions upon were arranged at left-
side of window form (). Users want to see desired
information in the DB in user-friendly and
functional manner. The output of attribute
information, which is provided by graphic user
interface (GUI), can be displayed in a tabular form
and graphic form. Tabular forms are generally used
to input, edit and view information in the DB, and
graphic forms provide intuitive views of the spatial
relationship between attributive information.
Figure 5: Main management program of integrated
information system.
The hazard mapping module displays all
attributive information in the database by using
tables and graphics according to its characteristics
either, on screen or as a document. Also, all data in
DB can be output as a chart or a graphic. The
graphic functions display interpolated data with field
data over an arbitrary domain at same time. All of
the charts, graphs and drawings can then be printed.
Especially, the debris flow hazard can be visualized
and forecasted as 2D maps overlain by satellite
images as a background maps. And the severity level
can be determined using zonation criteria in real-
time.
In this proposed framework, the computer-based
method for real-time assessment of spatial debris
flow hazard was embedded based on a stand-alone
system developed using Microsoft Visual BASIC,
the Esri ArcGIS developer tool (Esri, 2006; Lee and
Wong, 2001). The ArcGIS developer tool was
mainly used for development of the database,
evaluation of the results, and spatial visualization.
3 SYSTEMATIC FIELD
APPLICATION
3.1 Simulation Conditions
In this research, to validate the applicability and
effectiveness of the integrated landslide hazard
Development and Application of GIS-based Information System of Landslide Hazard Map Induced by Earthquakes and Rainfall in Korea
231
assessment system based on GIS, the systematic
field application was performed. For the earthquake-
induced hazard, Cheonggae Mountain in Korea is
selected as the target area, and the GIS technique is
used to construct a hazard map. Using the developed
system program, a pseudo-static analysis is used to
determine the factor of safety, and Newmark sliding
block analysis is used to determine the seismic
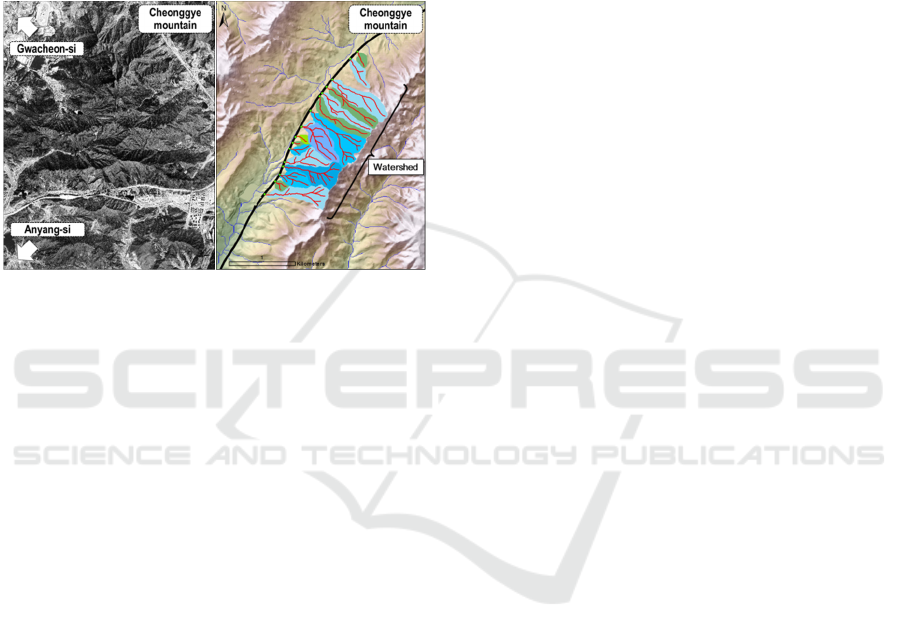
displacement. Figure 6 describes the satellite map
for target area.
(a) Cheonggye Mountain (b) Deogyu Mountain
Figure 6: Simulation tests conditions of earthquake
scenarios for the Cheonggye Mountain and rainfall
scenarios applied watershed analysis for the Deogyu
Mountain, Korea.
To construct a hazard map for a seismic
landslide, ArcGIS ver. 10.1, provided by
Environmental System Research Institute,
Inc.(ESRI), and a 1:5,000 digital map provided by
National Geographic Information Institute are used.
According to the soil survey of a site, the SPT-N
value from a standard penetration test is from 20 to
50. In this study, the soil survey information is
assumed to govern our entire target area, and the
SPT-N value of 35 is used to construct a hazard map.
From the SPT-N value, the internal friction angle of
40° is predicted by empirical correlation between N
and friction angle suggested by Meyerhof in 1956.
In this analysis, both c and S are assumed zero, and
γt is assumed to be 18 kN/m
2
in eq (1). Case of 0.14
g as peak ground acceleration (PGA) is used in this
analysis, and the information of the amplification
factor corresponding to the slope is used to evaluate
ac. And the Newmark displacement was calculated
using the representative empirical formula (proposed
by Ambraseys and Menu, 1988).
For rainfall-induced hazard, debris flows
occurred in the Deogyu Mountain area of the
Daejeon-Jinju Expressway in the summer of 2005
(312.0mm/day and 54.5mm/hr). All existing
watersheds in the test beds were analysed. Of all the
watersheds in the selected regions, the areas with
target structure (expressways) positioned on bridges
and tunnels, or near vast areas of fields were
excluded from the analysis due to their very low
likelihood of damage according to the condition of
debris-flow.
3.2 Landslide Hazard Map
3.2.1 Earthquake-induced Landslide
By using the slope DEM, soil depth, and internal
friction angle information, the factors of safety for
static and seismic slope stability are obtained. Figure
5 shows the results on the factor of safety under four
cases of different PGAs. The severity class of
dynamic factor of safety was categorized 3 levels
(‘Low’, ‘Moderate’, ‘High’). From Figure 7, the
factor of safety lower than 1 (‘High’ level) is
common in the four case for the Cheonggye
Mountain. And the area that has the distribution of
the factor of safety lower than 1 increases as the
PGA increase. In addition, the area that has the
distribution of the factor of safety higher than 2
decreases as the PGA increases.
Figure 7 shows the results of Newmark
displacement for each PGA event. The yield
acceleration is calculated, with factor of safety from
eq (1), and the Newmark displacement in each case
is calculated. And the severity class of Newmark
displacement was categorized 4 levels (‘Low’,
‘Moderate’, ‘High’, ‘Very high’). In case of 0.14g,
displacement more than 99% area is produced within
10mm because most of the factor of safety values in
each case is higher than 1, as shown in Figure 7(a),
and many factors are assumed or neglected in this
analysis. On the other hand, most of target area
(more than 85%) for PGA events (0.22g, 0.30g,
0.38g) was evaluated as ‘High’ level or ‘Very high’
level. Considering synthetically the dynamic factor
of safety and Newmark displacement, it is possible
that the Cheonggye Mountain can be damaged
‘High’ level (0<FS 1, displacement>50mm), in
condition of PGA event more than 0.22g.
3.2.2 Rainfall-induced Landslide
Applications of the rainfall-induced landslide hazard
assessment module show results which roughly
coincide with actual debris flow occurrences and
non-occurrences (Figure 8(a)). Occurrence cases are
roughly positioned in the upper right-hand side,
which indicate higher Susceptibility and
Vulnerability Values, whereas non-occurrence cases
GISTAM 2016 - 2nd International Conference on Geographical Information Systems Theory, Applications and Management
232
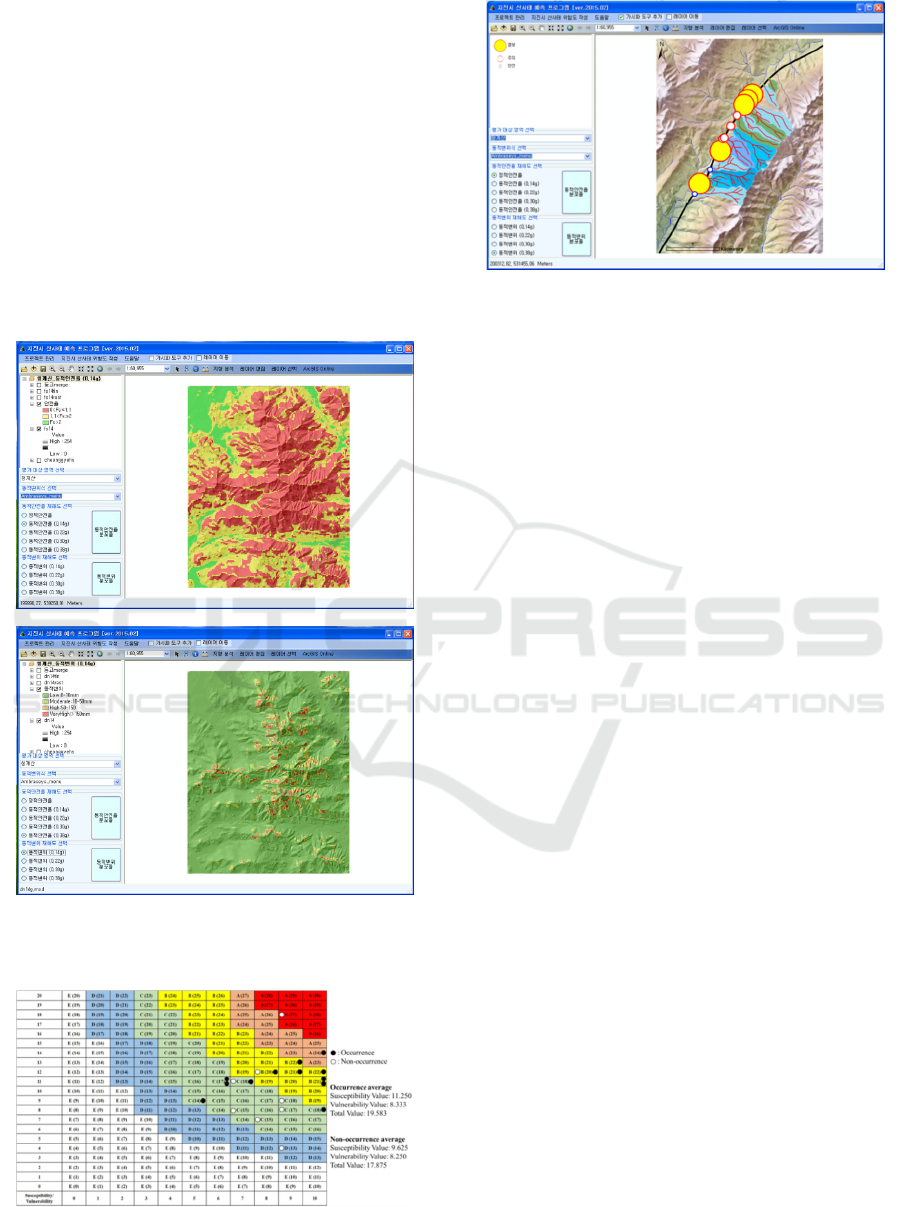
are located on the lower left side, with relatively
lower Susceptibility and Vulnerability Values.
Although this tendency may seem correct to some
extent, it does not always show flawless results. In
the hazard classes of C and D, both debris flow
occurrence and non-occurrence cases are mixed up,
not always indicating a result in which occurrences
have higher hazard classes, and non-occurrences
with lower classes. Figure 8(b) represented Severity
Level and Hazard Value for rainfall scenarios.
Among 17 pour point (or watershed), 6 danger
sections were predicted and 5 caution and 6 safe
sections were determined, in case of rainfall event
recorded as 312.0mm/day.
(a) Factor of safety (0.14g)
(b) Newmark displacement (0.14g)
Figure 7: Example of application results of earthquake-
induced landslide hazard.
(a) Susceptibility and Vulnerability Values of debris flow
occurrence and non-occurrence cases
(b) Severity Level and Hazard Value for rainfall scenarios
Figure 8: Application results of earthquake-induced
landslide hazard.
4 CONCLUSION AND
DISCUSSIONS
In this study, integrated information system of
landslide hazard map during earthquake and rainfall
was developed. The developed system built, within
the frame of GIS, consists of a database (DB), and
the system software performing assessment of
earthquake-induced and rainfall-induced landslide
hazard. The system software is functionally divided
into an input module, earthquake-induced landslide
hazard assessment module, rain-induced landslide
hazard assessment module, and hazard mapping
module. Study area is Cheonggae Mountain and
Deogyu Mountain in Korea, and two-dimensional
landslide hazard map for earthquake-induced
landslide parameters (dynamic factor of safety and
Newmark displacement) and rainfall-induced
landslide parameters (Severity Level and Hazard
Value) were constructed by using methodologies for
landslide hazard assessment during earthquake and
rainfall based on the developed system. And a
summary of the results is as follows.
(1) Developed program based on GIS is useful for
the construction of a landslide hazard map.
However, many factors for soil characteristics
are neglected or assumed specific values in this
analysis. Therefore, more exact data regarding
soil characteristics, such as cohesive strength,
internal friction, degree of saturation covering a
larger area, are required to construct a more
accurate seismic hazard map.
(2) Prediction of soil depth, yield acceleration and
seismic displacement, rainfall correlations
between hazard value using empirical equations
should be verified with actual field data to
construct a more accurate landslide hazard map
Development and Application of GIS-based Information System of Landslide Hazard Map Induced by Earthquakes and Rainfall in Korea
233

induced by multi-sources.
ACKNOWLEDGEMENTS
This research was supported by the Basic Research
Project of the Korea Institute of Geoscience and
Mineral Resources (KIGAM) and Integrated
Research Institute of Construction and
Environmental Engineering in Seoul National
University.
REFERENCES
Ambraseys, N. N. and Menu, J. M., 1988. Earthquake-
Induced Ground Displacements, Earthquake
Engineering and Structural Dynamics, 16, 985–1006.
Booth, B., 2000. using ArcGIS 3D Analyst: GIS by ESRI.
Esri Press.
Carrara, A., 1983. Multivariate Methods for Landslide
Hazard Evaluation, Mathematical Geology, 15, 403–
426.
Carrara, A., and Guzzetti, F., 1999. Use of GIS
Technology in the Prediction and Monitoring of
Landslide Hazard, Natural Hazards, 20, 117–135.
Carrara, A., Cardinali, M., Detti, R., Guzzetti, F., Pasqui,
V., and Reichenbach, P., 1991. GIS Techniques and
Statistical Models in Evaluating Landslide Hazard,
Earth Surface Processes and Landforms, 16, 427–445.
Carrara, A., Cardinali, M., Guzzetti, F., and Reichenbach,
P., 1995. GIS Technology in Mapping Landslide
Hazard. in: Carrara, a., Guzzetti, F. (Eds.),
Geographical Information Systems in Assessing
Natural Hazards. Kluwer Academic Publishers,
Dordrecht, the Netherlands, 135–175.
Chung, C. F., and Fabbri, a. G., 1993. Representation of
Geoscience Datafor Information Integration, Journal of
Non-Renewable Resources, 2(2), 122–139.
Chung, C. F., and Fabbri, a. G., 1998. Three Bayesian
Prediction Models for Landslide Hazard. in: Buccianti,
a. (Ed.), Proceedings of International Association for
Mathematical Geology 1998 Annual Meeting
(IAMG.98), Ischia, Italy, October 3 – 7, 1998, 204–
211.
Chung, C. F., and Fabbri, a. G., 1999. Probabilistic
Prediction Models for Landslide Hazard Mapping.
Photogrammetric Engineering and Remote Sensing
(PE&RS), 65 (12), 1388–1399.
Chung, C. F., and Fabbri, a. G., 2001. Prediction Models
for Landslide Hazard using Fuzzy Set Approach. in:
Marchetti, M., Rivas, V. (Eds.), Geomorphology and
Environmental Impact Assessment. a.a. Balkema,
Rotterdam, 31–47.
Chung, C. F., Fabbri, a. G., and Van Westen, C. J., 1995.
Multivariate Regression Analysis for Landslide
Hazard Zonation. in: Carrara, a., Guzzetti, F. (Eds.),
Geographical Information Systems in Assessing
Natural Hazards, Kluwer Academic Publishers,
Dordrecht, the Netherlands, 107–133.
Cho, S. W., Chung, E. S., and Kim, M. M., 2003.
Estimation of Slope Movement by Earthquake
Loading in the Region of Moderate Seismicity,
Journal of Korean Society of Civil Engineers, 23(4),
259–264.
Esri, 2006. Arcgis 9: using Arcgis Desktop. ESRI Press.
Ghafoori, M., Lashkaripour, G. R., 2009. A
Geomorphological Approach to Landslide
Susceptibility Assessment in Zoshk Valley, NE Iran.
in the 1st Regional Conference on Geo-Disaster
Mitigation and Waste Management.
Guzzetti, F., Carrara, a., Cardinali, M., and Reichenbach,
P., 1999. Landslide Evaluation: a Review of Current
Techniques and Their Application in a Multi-Scale
Study, Central Italy, Geomorphology, 31, 181– 216.
Jakob, M., Hungr, O., 2005. Debris-Flow Hazards and
Related Phenomena, Springer,
Jade, S., and Sarkar, S., 1993. Statistical Models for Slope
Stability Classification, Engineering Geology, 36, 91–
98.
Jibson, R. W., 1993. Predicting Earthquake-Induced
Landslide Displacements using Newmark's Sliding
Block Analysis, Transportation Research Record
1411, Transportation Research Board, Washington,
D.C., 9–17.
Kim, H. S., 2014. Integrated Earthquake Hazard
Assessment System with Geotechnical Spatial Grid
Information based on GIS, Seoul National University.
Kramer, S. L., 1996. Geotechnical Earthquake
Engineering, Prentice-Hall, NJ.
Lee, J. Y., Han, H. T., Baek, Y, Park, D. H., Lee, J. H.,
Park, I. J., 2014. Development of Prediction Method
Considering Geometrical Amplification
Characteristics of Slope II: Construction of Landslide
Hazard Map during Earthquakes in Seoul, J. Korean
Soc. Hazard Mitig, 14(5), 85–92.
Lee, J., Wong D. W. S., 2001. Statistical Analysis with
Arcview GIS, John Wiley & Sons, Canada.
Meyerhof, G. G., 1956. Penetration Tests and Bearing
Capacity of Cohesionless Soils, ASCE Journal of the
Soil.
Mukhlisin, M., Idris, I., Salazar, a. S., Nizam, K., and
Taha, R., 2010. GIS based Landslide Hazard Mapping
Rediction in Ulu Klang, Malaysia. ITB Scientific
Journal, 2A(2), 163–178.
Newmark, N. M., 1965. Effects of Earthquakes on Dams
and Embankments, Geotechnique, 15(2), 139–160.
Olivera, F., Furnans, J., Maidment, D., Djokic, D., Ye, Z.,
2002, Drainage Systems, Archydro: GIS for Water
Resource. ESRI Press, California.
Shekhar, S., and Xiong, H., 2008. Encyclopedia of GIS.
Springer Science & Business Media.
Yegian, M. K., Marciano, E., and Ghahraman, V. G.,
1991. Earthquake -Induced Permanent Deformations:
Probabilistic Approach, Journal of Geotechnical
Engineering, ASCE, 117(1), 35–50.
Yin, K. S. P. C. Y. Landslide Science for a Safer
Geoenvironment.
GISTAM 2016 - 2nd International Conference on Geographical Information Systems Theory, Applications and Management
234
