Investment Support System using the EVOLINO Recurrent Neural
Network Ensemble
Algirdas Maknickas
1
and Nijol˙e Maknickien˙e
2
1
Department of Information Technologies, Vilnius Gediminas Technical University, Saultekio 11, Vilnius, Lithuania
2
Department of Finance Engineering, Vilnius Gediminas Technical University, Vilnius, Lithuania
Keywords:
Ensembles, EVOLINO, Finance, Forecasting, Investment Portfolio, Orthogonality.
Abstract:
The chaotic and largely unpredictable conditions that prevail in exchange markets are of considerable interest
to speculators because of the potential for profit. The creation and development of a support system using
artificial intelligence algorithms provides new opportunities for investors in financial markets. Therefore, the
authors have developed a support system that processes historical data, makes predictions using an ensemble of
EVOLINO recurrent neural networks, assesses these predictions using a composition of high-low distributions,
selects an orthogonal investment portfolio, and verifies the outcome on the real market. The support system
requires multi-core hardware resources to allow for timely data processing using an MPI library-based parallel
computation approach. A comparison of daily and weekly predictions reveals that weekly forecasts are less
accurate than daily predictions, but are still accurate enough to trade successfully on the currency markets.
Information obtained from the support system gives investors an advantage over uninformed market players
in making investment decisions.
1 INTRODUCTION
Exchange markets are extremely dynamic, chaotic,
and largely unpredictable. They are influenced by
market participants, as well as by banking interven-
tions, manipulations, geopolitical events, natural dis-
asters, and other external events. However, the real
challenge of creating a support system for speculators
can be realized by artificial intelligence.
Decision making in uncertain markets requires
complex solutions covering several fields of science,
artificial intelligence, and investment. In the sci-
entific field of artificial intelligence, we found a
very interesting algorithm named EVOLINO (EVolu-
tion of recurrent systems with Optimal LINear Out-
put) (Schmidhuber et al., 2005a) , (Wierstra et al.,
2005). When trained using LongShort-Term Memory
(LSTM) (Hochreiter and Schmidhuber, 1997), (Gers
et al., 2000) recurrent neural networks (RNNs) with
co-evolving hidden neurons, EVOLINO can learn to
predict several time series that traditional RNNs can-
not. EVOLINO has been used to predict superim-
posed out-of-phase sine waves, certain input streams
based on grammatical rules, the parity problem with
display, and the Mackey–Glass time series (Schmid-
huber et al., 2005b), (Schmidhuber et al., 2007), as
well as in the modelling of competence as a self-
organizing process (Scharnhorst and Ebeling, 2005)
and robotic knot winding (Mayer et al., 2008).
Single neural networks have the qualities needed
to achieve this objective, but a group of them, con-
nected in different ways, can provide qualitatively
new solutions. Ensembles of neural networks have
been used to predict exchange rates (Zhang et al.,
2001), in single-step-ahead and multi-step-ahead pre-
diction problems (Assaad et al., 2008), for bankruptcy
prediction and credit scoring (Tsai and Wu, 2008),
wind power forecasting (Felder et al., 2010), and
noisy non-linear time series (Sheng et al., 2013).
The probabilities given by these ensemble predictions
are used in climate change research (Collins, 2007)
and probabilistic wind vector forecasting (McLean
Sloughter et al., 2013).
In investment theory, most attention is focused
on investment portfolio formation. The best known
studies in this area were conducted by Markowitz
(Markowitz, 1952), (Markowitz, 1987), (Markowitz,
2014), who proposed equations for maximizing
profit and minimizing risk. The adequate portfo-
lio (Rutkauskas, 2000) added a third component—
reliability. The formation and usage of this adequate
portfolio has been analysed in terms of profit stochas-
138
Maknickas, A. and Maknickien
˙
e, N..
Investment Support System using the EVOLINO Recurrent Neural Network Ensemble.
In Proceedings of the 7th International Joint Conference on Computational Intelligence (IJCCI 2015) - Volume 3: NCTA, pages 138-145
ISBN: 978-989-758-157-1
Copyright
c
2015 by SCITEPRESS – Science and Technology Publications, Lda. All rights reserved
ticity (Rutkauskas and Stankeviˇciene, 2003). Orthog-
onal portfolios were investigated in the context of a
saving and investment portfolio (Roll, 1980), and the
optimal orthogonal portfolio has become an important
risk management tool in investment decision making
processes (Asgharian and Hansson, 2005), (Asghar-
ian, 2011).
Investment strategies based on extremal data have
also been studied (Corwin and Schultz, 2012), (Ca-
porin et al., 2013). Hence, the high and low prices
in an exchange market are frequently predictable and
profitable for speculation.
One of the most important measures of feature
predictions is time. Short-term predictions of the
future behavior of a time series, using information
based only on past values, have been researched
(Farmer and Sidorowich, 1987), as has the predic-
tion of chaotic time series using artificial intelligence
(Samanta, 2011), (Chen, 2014), (Fonseca and G´omez-
Gil, 2014).
Our aim is to integrate knowledge of investment
theory and artificial intelligence to develop a support
system for speculating on the exchange markets. In-
formation obtained from the supportsystem must give
investors an advantage in making investment deci-
sions compared with uninformed market players. The
proposed support system for speculators includes five
steps: preparation of historical data, prediction by an
ensemble of EVOLINO RNNs, assessment of predic-
tions, investment portfolio formation, and verification
in the market. Our research compares two portfolios
based on different perspectives of the future: daily
and weekly time series.
2 SUPPORT SYSTEM
Figure 1 shows a block diagram of different stages
of our support system for investors in the currency
market. The data include historical fluctuations in ex-
change rates. The prediction model provides a full set
of forecasts, which is the basis for investment asset
allocation over the prediction assessment and portfo-
lio optimization. Verification in an imitation market
in real time demonstrates the reliability of the support
system.
2.1 Preparation of Historical Data
The selection of exchange rates for speculation in cur-
rency markets is based on the orthogonality of the
portfolio. Roll (1980) formulated the conditions un-
der which an investment portfolio solves the efficient
portfolio optimization problem. An orthogonal port-
folio is one which satisfies the following condition:
Var = Σ
ij
r
ij
σ
i
σ
j
= 0, (1)
where r
ij
is the correlation coefficient between tools i
and j, σ
i
is the standard deviation of tool i, and σ
j
is
the standard deviation of tool j.
When it is very difficult to reach Var = 0, we can
use ε to denote the degree of closeness to orthogonal-
ity:
Var =
∑
ij
r
ij
σ
i
σ
j
= ε. (2)
In our research, we use the GBP/AUD (British
pounds and Australian dollars), NZD/CAD (New
Zealand dollars and Canadian dollars), EUR/JPY
(Euro and Japanese yen) and USD/CHF (US dollars
and Swiss francs) exchange rates. The weekly ex-
change rates are recorded in a MySQL database on
a daily basis. Additionally, we record the XAUUSD
rate (gold against the US dollar). The optimal orthog-
onality of two “pupil and teacher“ data vectors can be
achieved by varying a ≥ 0 while seeking to minimize
the sum (Maknickas and Maknickiene, 2012):
min
N−1
∑
t=0
η
t
XXX/YYY
η
t−a
XAU/USD
. (3)
The best shift value a is then recorded in the MySQL
database for future usage. Note that we do not
use the direct η
t
i
exchange rate data (where in-
dex i denotes currency exchange rates GBP/AUD,
NZD/CAD, EUR/JPY, USD/CHF), but the following
rational logarithmic data of η
t
i
and η
t−1
i
:
l
j
t
= log(η
t
j
/η
t−1
j
). (4)
The logarithmic scale was chosen in case of lognor-
mal distribution of investigating data. So, a neural
network will learn unified data of logarithmic ratio-
nal exchange rates growth/decrease. Thus, in our
case, four different shift values must be found and
stored. When the best shift values have been deter-
mined, the EVOLINO RNN can begin the learning
process. EVOLINO RNN learning data must be in
the range [0,1], so the original data are normalized
according to the maximum value in the interval [0,T],
i.e.
l
1j
t
= l
j
t
/l
j
max
. (5)
The data prepared in this way can be used for LSTM
second-order RNN learning and validation. The pre-
dicted data should be obtained in the reverse algo-
rithm using the same value of l
j
max
. In the prediction
stage, all learned RNN predicted exchange rate val-
ues must be multiplied by l
j
max
. The exponent of each
predicted value is calculated as follows:
η
t
j
= η
t−1
j
exp(l
1j
t
l
j
max
), (6)
where η
0
j
is the first value in the predicted time series.
Investment Support System using the EVOLINO Recurrent Neural Network Ensemble
139
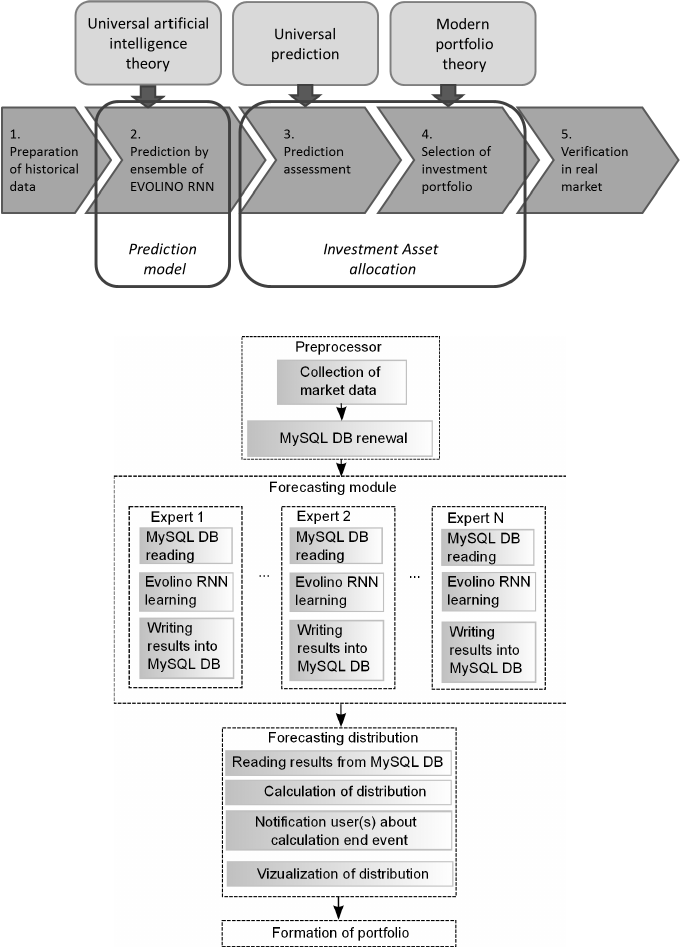
Figure 1: Diagram of support system for investors.
Figure 2: Diagram of prediction model.
2.2 Prediction by an Ensemble of
EVOLINO RNNs
The idea of using LSTM RNNs to predict exchange
rate time series is based on the formers ability to ob-
tain qualified prediction results for the Mackey–Glass
chaotic time series (Gers, 2001). This success could
be explained by investigations of Siegelmann (1999),
who proved that first-order RNNs could work as finite
state automata if their weights were integers, as Tur-
ing machines if their weights were rational numbers,
and as super Turing machines or hyper-computers if
their weights were real numbers. The EVOLINO
RNN is an LSTM second-order RNN, and researchers
(Goudreau et al., 1994) have shown that these are
strictly more powerful than first-order RNNs. Thus,
if LSTM works well for the prediction of Mackey–
Glass chaotic time series, it should work equally well
for the prediction of chaotic exchangerate time series.
The second basic idea of artificial prediction is
NCTA 2015 - 7th International Conference on Neural Computation Theory and Applications
140
that we should not only predict a single point in the
future, but a distribution of points. This means that
there are no single fixed points in the future, but rather
an infinite number of points with an appropriate prob-
ability of appearing in the future. This was taken
into account by our algorithm using an ensemble of
EVOLINO RNNs to obtain the predicted distribution
of possible exchange rate values. When using an en-
semble, we require unrealistic values to be filtered
out. In this case, the first–last percentile method was
used. Calculating the first and fourth percentiles al-
lows us to remove values in this range as unrealistic.
Finally, we obtain the future single-step ahead
(one week or one day in the current investigation)
distribution of possible exchange rate values, and use
this to make decisions about appropriate investments.
This can be done because the weights are globally
optimized using a genetic algorithm, and each opti-
mization sequence gives different values for a single
prediction point.
G
I
Input
I
Input
II
G
O
G
F
Output
Σ
Π
Π
Π
S
LSTM
LSTM
LSTM
LSTM
LSTM
Input
I
Input
II
Output
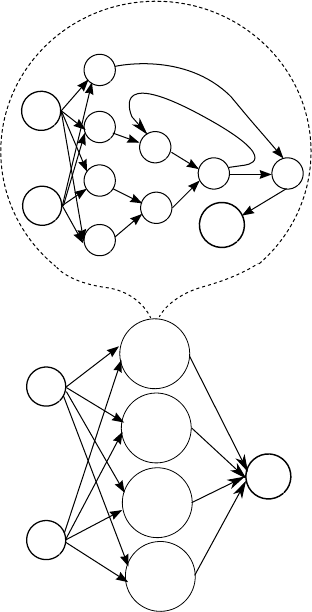
Figure 3: LSTM network with four memory cells.
The block diagram of EVOLINO recurrent neural
network is shown in Figure 3. EVOLINO RNN forms
LSTM network with N = 4n memory cells, where N
is total amount of neurons and n is amount of mem-
ory cells. The genetic evolution algorithm is applied
to each quartet of memory cells separately. The cell
has an internal state S together with a forget gate (G
F
)
that determines how much the state is attenuated at
each time step. The input gate (G
I
) controls access
to the cell by the external inputs that are summed into
the Σ unit, and the outputgate (G
O
) controls when and
how much the cell fires. Nodes Π represent the mul-
tiplication function and the linear regression Moore-
Penrose pseudo-inverse method used to compute the
output circle (Schmidhuber et al., 2005a), (Schmid-
huber et al., 2005b).
The EVOLINO forecasting module is presented
in Figure 2. The module consists of four parts: pre-
processor, forecasting, calculation of distribution and
formation of portfolio. The prerocessor part colect
data into MySQL data base. The forecasting part
learns, validates and predicts each expert(4xLSTM
neural network) in the separate thread. Finally, the
obtained prediction data are using for calculation of
future distribution and formation of portfolio. A de-
tailed description of neural network ensemble learnig,
validation and prediction using EVOLINO RNNs can
be found in Maknickiene and Maknickas (2013). En-
sembles of neural networks can take a number of
hours to reach a satisfactory convergence. Selection
of the optimal number in an ensemble has been inves-
tigated in earlier work (Maknickien˙e and Maknickas,
2013). The cycle of each predictive neural network
is divided into equal intervals, and every interval is
computed on a separate processor node. Hardware
acceleration is achieved using eight nodes of an In-
tel(R) Xeon(R) CPU E5645 @ 2.40 GHz on the
www.time4vps.eu cloud. An ensemble of 1008 pre-
dictive neural networks requires approximately 72 h
computation time. The forecast assumes the distribu-
tion has a particular shape. At the end of this step, the
support system user obtains the distribution and pa-
rameters such as the mean, median, mode, skewness,
and kurtosis.
2.3 Prediction Assessment
The prediction model outputs a multi-modal distribu-
tion, and its shape provides more information for in-
vestors. The standard deviation reflects the riskiness
of a decision, kurtosis indicates the dispersal of possi-
ble values, and skewness indicates the asymmetry of
the decision. Second and third modes also provide in-
formation about changes in the future exchange rate
value. When the historical data consist of closing val-
ues, the distribution of expected values predicts the
closing exchange rate for the next period. However,
close data are less informative for investors. Each in-
vestor makes a decision to buy the lowest data and sell
Investment Support System using the EVOLINO Recurrent Neural Network Ensemble
141
the highest data. Thus, for the prediction assessment,
we use the composition of two distributions, one of
which was produced using low data, the other using
high data. In real markets, decisions are made ac-
cording to the exchange rate value at the moment of
decision-making (Stankeviˇciene et al., 2014).
2.4 Selection of Investment Portfolio
Selection of investment portfolio using the composi-
tion of distributions should be made according to:
max
∑
n
i=1
p
pi
W
i
min
∑
n
i=1
p
li
W
i
,
, (7)
where p
pi
is the probability of profit, p
li
is the proba-
bility of loss, W
i
is part of the investment in exchange
rate i, and n is the number of exchange rates in the
portfolio.
This orthogonal optimal portfolio diversifies risk
and makes investment in exchange markets profitable.
Real-time verification in an imitation market allows
us to evaluate the investor support system in terms of
market profitability, risks, and reliability, as well as
the individual characteristics of the investors specu-
lating on the real market.
3 COMPARISON OF DAILY AND
WEEKLY PREDICTIONS
USING OUR SUPPORT SYSTEM
FOR INVESTORS
The time interval is a very important component in
chaotic processes. Predicting financial markets for
short periods is slightly easier than making long term
predictions. The hourly forecasts given by our sup-
port system required 16–18 h forecasting data. There
are insufficient historical data to produce a long-term
(e.g., monthly or annual) prognosis. The accumulated
experience with daily data forecasting allows us to go
one step into the future and use weekly exchange rate
forecasts.
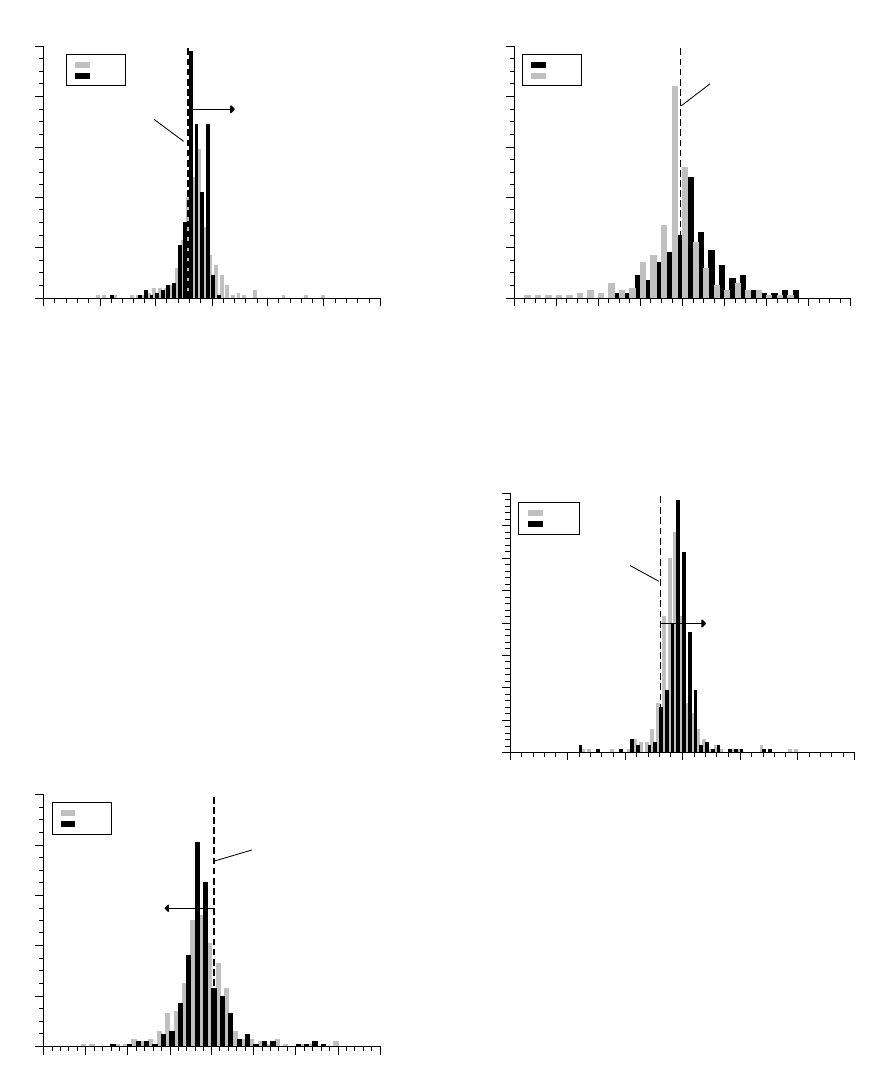
3.1 Daily Predictions
Short-term predictions were made using historical
data on daily highs and lows. Trading decisions can
be made using a composition of two distributions,
taking into account that the close value is the last
known real value. Figure 4 shows the composition
of distributions for the expected GBP/AUD exchange
rate. The modes of these distributions are to the left
of the close value, thus the trading decision must be
to sell. The modes of the EUR/JPY (Figure 5) and
NZD/CAD (Figure 6) exchange rate high-low distri-
butions are to the right of the close values, so the trad-
ing decision in these cases is buy.
GBP/AUD
frequency
0
10
20
30
40
50
60
70
80
exchange rate
1,8 1,85 1,9 1,95 2 2,05 2,1 2,15 2,2
high
low
sell
close value
Figure 4: Composition of high-low distributions of daily
GBP/AUD exchange rate predictions.
The probability of profit P
p
= 0.89 and the prob-
ability of loss P
l
= 0.11 in the case of the daily
GBP/AUD sell trading decision (Figure 4). For the
EUR/JPY
frequency
0
10
20
30
40
50
exchange rate
130 135 140 145 150 155
low
high
buy
close value
Figure 5: Composition of high-low distributions of daily
EUR/JPY exchange rate predictions.
EUR/JPY buy trading decision, the probability of
profit P
p
= 0.58 and the probability of loss P
l
= 0.42
(Figure 5). The probability of profit P
p
= 0.77 and the
probability of loss P
l
= 0.23 for the daily NZD/CAD
buy trading decision (Figure 6).
The portfolios are formed using equation (7).
The calculated weights are: W
D,gbp/aud
= 0.53,
W
D,eur/ jpy
= 0.11, and W
D,nzd/cad
= 0.36.
NCTA 2015 - 7th International Conference on Neural Computation Theory and Applications
142
NZD/CAD
frequency
0
20
40
60
80
100
exchange rate
0,75 0,8 0,85 0,9 0,95 1 1,05
low
high
buy
close value
Figure 6: Composition of high-low distributions of daily
NZD/CAD exchange rate predictions.
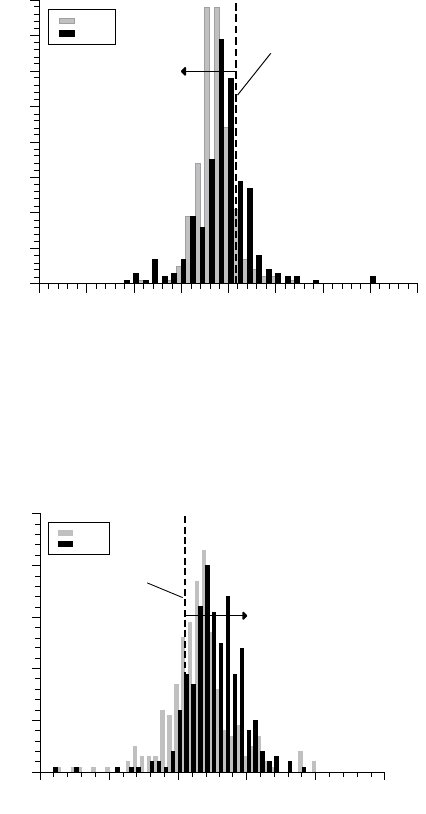
3.2 Weekly Time Period
Weekly predictions are made in the same way as daily
predictions, but with weekly historical exchange rate
data. Figure 7 shows the composition of weekly
GBP/AUD exchange rate expected value distribu-
tions. The modes of the distributions are to the left
of the close value, so the trading decision must be to
sell. The modes for EUR/JPY (Figure 8) are on oppo-
site sides of the close value, so buy or sell decisions
are very risky. The modes of the weekly NZD/CAD
(Figure 6) exchange rate high-low distributions are to
the right of the close value, so the trading decision
here is to buy. The probability of profit P
p
= 0.78 and
GBP/AUD
frequency
0
20
40
60
80
100
exchange rate
1,6 1,7 1,8 1,9 2 2,1 2,2 2,3 2,4
low
high
close value
sell
Figure 7: Composition of high-low distributions of weekly
GBP/AUD exchange rate predictions.
the probability of loss P
l
= 0.22 in the case of the
weekly GBP/AUD sell trading decision (Figure 7).
For the risky trading decision concerning the weekly
EUR/JPY rates, the probability of profit is P
p
= 0.502
and the probability of loss is P
l
= 0.498 (Figure 8).
EUR/JPY
frequency
0
20
40
60
80
100
exchange rate
60 80 100 120 140 160 180 200 220
high
low
close value
Figure 8: Composition of high-low distributions of weekly
EUR/JPY exchange rate predictions.
For the weekly NZD/CAD exchange rates, the but de-
NZD/CAD
frequency
0
10
20
30
40
50
60
70
80
exchange rate
0,6 0,7 0,8 0,9 1 1,1 1,2
low
high
close value
buy
Figure 9: Composition of high-low distributions of weekly
NZD/CAD exchange rate predictions.
cision gives a probability of profit P
p
= 0.89 and a
probability of loss P
l
= 0.11 (Figure 9). In this sce-
nario, the portfolio is constructed using equation 7
with only GBP/AUD and NZD/CAD data. The calcu-
lated weights are W
W,gbp/aud
= 0.42 and W
W,nzd/cad
=
0.58.
3.3 Comparison of Predictions
The accuracy of predictions based on our support sys-
tem for investors is presented on Table 1. Each ex-
change rate prediction was evaluated according to the
mean absolute percentage error (MAPE) when com-
paring the real future value with the mode of one of
the predicted distributions: high in the case of a buy
decision and low in the case of a sell decision. Our
results demonstrate that daily predictions were more
accurate than the weekly predictions.
Investment Support System using the EVOLINO Recurrent Neural Network Ensemble
143

Table 1: Comparison of the accuracy of daily and weekly
predictions.
MAPE (%)
Exchange rate low high
GBP/AUD daily 0.198 0.319
EUR/JPY daily 2.250 1.051
NZD/CAD daily 0.412 2.164
GBP/AUD weekly 1.993 1.874
EUR/JPY weekly 3.696 4.737
NZD/CAD weekly 3.498 2.814
Our support system for currency market was
tested on imitated market Oandainreal time Results of
trading using different strategies is presented in Fig-
ure 10. Strategy is determined by the choice of dif-
ferent risk levels of trading platform and choice of
portfolios. Conservative strategy has 1:10 leverage
and funds are shared equally. Moderate strategy has
1:20 leverage and the funds are divided in proportion
to the projected profit. Aggressive strategy has 1:50
leverage and the funds are divided in proportion to the
projected profit.
balance (euros)
99.800
100.000
100.200
100.400
100.600
100.800
101.000
101.200
101.400
101.600
date(days)
07−12 07−17 07−23 07−28 08−03 08−16 08−21
daily conservative
daily moderate
daily aggressive
weekly conservative
weekly moderate
weekly aggressive
Figure 10: Comparison of daily and weekly balances of dif-
ferent trading strategies in period from 08-07-2015 to 21-
08-2015.
Comparison of daily and weekly trading using dif-
ferent strategies shows sustainable growth of invest-
ment profit of all tests and allows to expect the good
annual results (10-18 %). Our support system for cur-
rency market speculators uses modern portfolio the-
ory for the diversification of risk. Orthogonality in an
investment portfolio (equations (1) and (2)) reduces
the risk of losing. A comparison of daily and weekly
portfolios is presented in Table 2.
Total profit of daily and weekly portfolios are very
similar, but weekly profit per trade is roughly twice
more daily profits per trade. So investor can get same
result with less trading time. Prediction of chaotic
processes like financial markets, is not simple process
where daily historical data easy can be changed by
Table 2: Comparison of daily and weekly portfolios.
portfolio total profit profit
per trade
daily conservative 1030.44 38.2
daily moderate 1186.53 45.6
daily aggressive 1451.83 63.1
weekly conservative 1207.05 100.6
weekly moderate 1393.96 116.2
weekly aggressive 1345.23 112.2
weekly data. Number of different events in one week
can more easy change the tendencies then in one day.
Lots of financial prediction tools can easy predict the
tendencies, but cannot predict extremes of the price
dynamic. Good tool of finance market prediction can
recognize the coming changes.
Investment support system using the EVOLINO
RNN ensemble is multilevel tool for investor. It con-
cludes not only ensemble of EVOLINO RNN with
function of prediction, but there are multilevel com-
putation creativity too.
4 CONCLUSIONS
We have developed a support system for currency
market investors by combining monitoring synergies
between different branches of science (economics,
mathematics, psychology, biology), the latest techno-
logical breakthroughs (online payments and artificial
intelligence), and investor experience. The decision
making support system is a useful tool for speculators
in the relatively risky currency market. Our research
aims to enhance future prospects. The comparison
of daily and weekly predictions provides the ability
to use the support system for the weekly forecasting
of exchange rates. The accuracy of weekly forecasts
is lower than that of daily predictions, but still ac-
curate enough to enable successful trading. Weekly
profit per trade is roughly twice more daily profits
per trade. The support system requires multi-core
hardware resources for timely data processing using
MPI library-based parallel computation. Information
obtained from the support system provides investors
with an advantage in making investment decisions
compared with uninformed market players.
REFERENCES
Asgharian, H. (2011). A conditional asset-pricing model
with the optimal orthogonal portfolio. Journal of
Banking & Finance, 35(5):1027–1040.
NCTA 2015 - 7th International Conference on Neural Computation Theory and Applications
144
Asgharian, H. and Hansson, B. (2005). Evaluating the im-
portance of missing risk factors using the optimal or-
thogonal portfolio approach. Journal of Empirical Fi-
nance, 12(4):556–575.
Assaad, M., Bon´e, R., and Cardot, H. (2008). A new
boosting algorithm for improved time-series forecast-
ing with recurrent neural networks. Information Fu-
sion, 9(1):41–55.
Caporin, M., Ranaldo, A., and De Magistris, P. S. (2013).
On the predictability of stock prices: A case for
high and low prices. Journal of Banking & Finance,
37(12):5132–5146.
Chen, C.-W. (2014). Retracted: Applications of neural-
network-based fuzzy logic control to a nonlinear time-
delay chaotic system. Journal of Vibration and Con-
trol, 20(4):589–605.
Collins, M. (2007). Ensembles and probabilities: a new
era in the prediction of climate change. Philosophical
Transactions of the Royal Society A: Mathematical,
Physical and Engineering Sciences, 365(1857):1957–
1970.
Corwin, S. A. and Schultz, P. (2012). A simple way to esti-
mate bid-ask spreads from daily high and low prices.
The Journal of Finance, 67(2):719–760.
Farmer, J. D. and Sidorowich, J. J. (1987). Predicting
chaotic time series. Physical review letters, 59(8):845.
Felder, M., Kaifel, A., and Graves, A. (2010). Wind power
prediction using mixture density recurrent neural net-
works. In Poster Presentation gehalten auf der Euro-
pean Wind Energy Conference.
Fonseca, R. and G´omez-Gil, P. (2014). Temporal validated
meta-learning for long-term forecasting of chaotic
time series using monte carlo cross-validation. In Re-
cent Advances on Hybrid Approaches for Designing
Intelligent Systems, pages 353–367. Springer.
Gers, F. (2001). Long Short-Term Memory in Recurrent
Neural Networks. PhD thesis, ECOLE POLYTECH-
NIQUE FEDERALE DE LAUSANNE.
Gers, F. A., Schmidhuber, J., and Cummins, F. (2000).
Learning to forget: Continual prediction with lstm.
Neural computation, 12(10):2451–2471.
Goudreau, M., Giles, C., Chakradhar, S., and Chen, D.
(1994). First-order vs. second-order single layer re-
current neural networks. IEEE Trans. on Neural Net-
works, 5(3):511.
Hochreiter, S. and Schmidhuber, J. (1997). Long short-term
memory. Neural computation, 9(8):1735–1780.
Maknickas, A. and Maknickiene, N. (2012). Influence of
data orthogonality: on the accuracy and stability of
financial market predictions. In IJCCI 2012, pages
616–619. INSTICC.
Maknickien˙e, N. and Maknickas, A. (2013). Financial mar-
ket prediction system with evolino neural network and
delphi method. Journal of Business Economics and
Management, 14(2):403–413.
Markowitz, H. (1952). Portfolio selection*. The journal of
finance, 7(1):77–91.
Markowitz, H. (1987). Mean-variance analysis in portfolio
choice and capital markets. Blackwell.
Markowitz, H. (2014). Mean–variance approximations to
expected utility. European Journal of Operational Re-
search, 234(2):346–355.
Mayer, H., Gomez, F., Wierstra, D., Nagy, I., Knoll, A., and
Schmidhuber, J. (2008). A system for robotic heart
surgery that learns to tie knots using recurrent neural
networks. Advanced Robotics, 22(13-14):1521–1537.
McLean Sloughter, J., Gneiting, T., and Raftery, A. E.
(2013). Probabilistic wind vector forecasting using
ensembles and bayesian model averaging. Monthly
Weather Review, 141(6):2107–2119.
Roll, R. (1980). Orthogonal portfolios. Journal of Financial
and Quantitative analysis, 15(05):1005–1023.
Rutkauskas, A. V. (2000). Formation of adequate invest-
ment portfolio for stochasticity of profit possibilities.
Property management, 4(2):100–115.
Rutkauskas, A. V. and Stankeviˇciene, J. (2003). Formation
of an investment portfolio adequate for stochasticity
of profit possibilities. Journal of Business Economics
and Management, 4(1):3–12.
Samanta, B. (2011). Prediction of chaotic time series us-
ing computational intelligence. Expert Systems with
Applications, 38(9):11406–11411.
Scharnhorst, A. and Ebeling, W. (2005). Evolutionary
search agents in complex landscapes-a new model
for the role of competence and meta-competence
(evolino and other simulation tools). arXiv preprint
physics/0511232.
Schmidhuber, J., Gagliolo, M., Wierstra, D., and Gomez,
F. (2005a). Evolino for recurrent support vector ma-
chines. arXiv preprint cs/0512062.
Schmidhuber, J., Wierstra, D., Gagliolo, M., and Gomez, F.
(2007). Training recurrent networks by evolino. Neu-
ral computation, 19(3):757–779.
Schmidhuber, J., Wierstra, D., and Gomez, F. (2005b).
Evolino: Hybrid neuroevolution/optimal linear search
for sequence prediction. In In Proceedings of the
19th International Joint Conference on Artificial In-
telligence IJCAI. Citeseer.
Sheng, C., Zhao, J., Wang, W., and Leung, H. (2013).
Prediction intervals for a noisy nonlinear time series
based on a bootstrapping reservoir computing network
ensemble. Neural Networks and Learning Systems,
IEEE Transactions on, 24(7):1036–1048.
Stankeviˇciene, J., Maknickiene, N., and Maknickas, A.
(2014). Investigation of exchange market prediction
model based on high-low daily data. In The 8th inter-
national scientific conference ”Business and Manage-
ment 2014”. Vilnius.Technika.
Tsai, C.-F. and Wu, J.-W. (2008). Using neural network en-
sembles for bankruptcy prediction and credit scoring.
Expert Systems with Applications, 34(4):2639–2649.
Wierstra, D., Gomez, F. J., and Schmidhuber, J. (2005).
Modeling systems with internal state using evolino.
In Proceedings of the 7th annual conference on Ge-
netic and evolutionary computation, pages 1795–
1802. ACM.
Zhang, G. P., Berardi, V., et al. (2001). Time series forecast-
ing with neural network ensembles: an application for
exchange rate prediction. Journal of the Operational
Research Society, 52(6):652–664.
Investment Support System using the EVOLINO Recurrent Neural Network Ensemble
145
