Using Evidence Theory in Land Cover Change Prediction to Model
Imperfection Propagation with Correlated Inputs Parameters
Ahlem Ferchichi, Wadii Boulila and Imed Riadh Farah
Ecole Nationale des Sciences de l’Informatique, Laboratoire RIADI, Manouba, Tunisia
Keywords:
LCC Prediction, Imperfection Propagation, Parameter and Model Imperfection, Aleatory and Epistemic
Imperfection, Correlated Parameters, Evidence Theory.
Abstract:
The identification and the propagation of imperfection are important. In general, imperfection in land cover
change (LCC) prediction process can be categorized as both aleatory and epistemic. This imperfection, which
can be subdivided into parameter and structural model imperfection, is recognized to have an important im-
pact on results. On the other hand, correlation of input system parameters is often neglected when modeling
this system. However, correlation of parameters often blurs the model imperfection and makes it difficult to
determine parameter imperfection. Several studies in literature depicts that evidence theory can be applied
to model aleatory and epistemic imperfection and to solve multidimensional problems, with consideration of
the correlation among parameters. The effective contribution of this paper is to propagate the imperfection
associated with both correlated input parameters and LCC prediction model itself using the evidence theory.
The proposed approach is divided into two main steps: 1) imperfection identification step is used to identify
the types of imperfection (aleatory and/or epistemic), the sources of imperfections, and the correlations of the
uncertain input parameters and the used LCC prediction model, and 2) imperfection propagation step is used
to propagate aleatory and epistemic imperfection of correlated input parameters and model structure using the
evidence theory. The results show the importance to propagate both parameter and model structure imperfec-
tion and to consider correlation among input parameters in LCC prediction model. In this study, the changes
prediction of land cover in Saint-Denis City, Reunion Island of next 5 years (2016) was anticipated using
multi-temporal Spot-4 satellite images in 2006 and 2011. Results show good performances of the proposed
approach in improving prediction of the LCC of the Saint-Denis City on Reunion Island.
1 INTRODUCTION
Propagation of the imperfections existing in a system
and the corresponding reliability analysis have be-
come an essential task for current product design pro-
cesses, especially, in LCC prediction process (Boulila
et al., 2014). Generally, imperfection in a system
can be classified into aleatory and epistemic (Hoff-
man and Hammonds, 1994). Aleatory imperfection
results from randomness (e.g. uncertainty). How-
ever, epistemic imperfection stems from the lack of
knowledge (e.g. imprecision, conflict). Imperfection
types can be roughly split into two categories: param-
eter and structural model (Duy et al., 2013)(Droguett.
and Mosleh, 2012). Imperfection in model param-
eter is due to natural variability, measurement inac-
curacy, and errors in handling and processing data
(Duy et al., 2013). Model structure shows imper-
fection from model assumptions/approximations, hy-
potheses, and scale effects. On the other hand, Corre-
lated parameters are often neglected when modeling a
natural system. However, parameters correlation of-
ten blurs the model imperfection and makes it diffi-
cult to determine parameter imperfection. In review
of literature, model parameter imperfection has re-
ceived the most attention in previous studies (Boulila
et al., 2014)(Eckhardt et al., 2003). (Boulila et al.,
2014) focuses on the imperfection in LCC predic-
tion model parameters, and explores how those im-
perfection propagate through to model responses us-
ing probabilistic method to model only random im-
perfections, and have not taken into account the cor-
relation among parameters. The focus here partly
reflects a consensus that model parameter is an im-
portant source of imperfection in simulation predic-
tions. However, it also reflects the relative ease with
which imperfection in model parameter can be quan-
tified in comparison to assessments of structural im-
Ferchichi, A., Boulila, W. and Farah, I..
Using Evidence Theory in Land Cover Change Prediction to Model Imperfection Propagation with Correlated Inputs Parameters.
In Proceedings of the 7th International Joint Conference on Computational Intelligence (IJCCI 2015) - Volume 2: FCTA, pages 47-56
ISBN: 978-989-758-157-1
Copyright
c
2015 by SCITEPRESS – Science and Technology Publications, Lda. All rights reserved
47

perfection in models. In practice, structural imper-
fection may be more important than parameter imper-
fection in evaluating model performance (Gong et al.,
2013)(Rohmer et al., 2014). For example, (Gong
et al., 2013) show the importance of using the im-
perfection of hydrological model structure in the im-
perfection processing. In LCC prediction process,
the correlated parameters and structural model im-
perfections are generally treated by probability the-
ory. Moreover, numerous authors conclude that there
are limitations in using probability theory in this con-
text (Droguett. and Mosleh, 2012). So far, sev-
eral non-probabilistic methods have been developed,
which include evidence theory (Shafer, 1976), possi-
bility theory (Zadeh, 1965), etc. As a generalization
of all the above probability and non-probability im-
perfection models, evidence theory combines random
and epistemic imperfections in a very straightforward
way, and is capable to solve multidimensional prob-
lems, with consideration of the correlation among pa-
rameters (Jiang et al., 2013). Based on the flexibility
of evidence theory, the main aim of our work is to
propagate the imperfection associated with both cor-
related input parameters and LCC prediction model
itself using the evidence theory. The proposed ap-
proach is divided into two main steps: 1) imperfec-
tion identification step is used to identify the types of
imperfection (aleatory and/or epistemic), the sources
of imperfections, and the correlations of the uncertain
input parameters and the used LCC prediction model,
and 2) imperfection propagation step is used to prop-
agate aleatory and epistemic imperfection of corre-
lated input parameters and model structure using the
evidence theory. The remainder of this paper is orga-
nized as follows. A brief introduction of evidence the-
ory is given in Section 2. The proposed framework is
presented in section 3. Section 4 presents our results.
Finally, section 5 concludes the paper with summary
and future works.
2 EVIDENCE THEORY
Evidence theory, also called as Dempster-Shafer the-
ory, was initially developed by (Klir, 1994) and for-
malized by (Shafer, 1976). The evidence theory has
the potential to quantify aleatory and epistemic imper-
fections. This theory has also become the accepted
method for propagating correlated and uncorrelated
input parameters imperfection through LCC predic-
tion models. In this section, the basic notations of the
evidence theory are introduced.
Frame of Discernment (FD). The FD is defined by
the finest possible subdivisions of the sets, and the
finest possible subdivision is called the elementary
proposition.
Basic Probability Assignment (BPA). Let Θ be a fi-
nite set of mutually exclusive and exhaustive hypothe-
ses, and 2
Θ
be the power set of Θ. The fundamen-
tal concept for representing imperfection is the BPA,
which defines a mapping function (m) of 2
Θ
to the
interval between 0 and 1. The measure m, BPA func-
tion, must satisfy the following axioms:
m(A) ≥ 0, ∀A ⊆ Θ. (1)
m(
/
0) = 0 (2)
∑
m(A) = 1. ∀A ⊆ Θ. (3)
Belief and Plausibility Functions. The measures of
imperfection provided by evidence theory are known
as belief (Bel) and plausibility (Pl), which also lie in
the interval [0,1]. Given a body of evidence, the (Bel)
and (Pl) can be derived from the BPA by
Bel(B) =
∑
A⊆B
m(A). (4)
Pl(B) =
∑
B∩A6=
/
0
m(A). (5)
The formulas make it easy to see that the belief func-
tion, (Bel), is calculated by summing the BPAs that
totally agree with the event B, while the plausibility
function, (Pl), is calculated by summing BPAs that
agree with the event B totally and partially. These
two functions can be derived from each other. For
example, the belief function can be derived from the
plausibility function in the following way:
Bel(B) = 1 − Pl(B) (6)
The relationship between belief and plausibility func-
tions is
Bel(B) ≤ Pl(B) (7)
which shows that as a measure of event B is true, if
P(B) is the true value of the measure of set B is true,
then Pl(B) is the upper bound of P(B),and Bel(B) is
the lower bound, so
Bel(A) ≤ P(A) ≤ Pl(A) (8)
Dempster’s Rule of Combining. The Dempster’s
rule of combination is an operation that plays a cen-
tral role in the evidence theory. The BPAs induced by
several sources are aggregated using this rule in order
to yield a global BPA that synthesizes the knowledge
of the different sources. Take two BPA structures, m
1
and m
2
, for instance, the combined structure m
12
is
calculated in the following manner:
m
12
(A) =
∑
B∩C=A
m
1
(B)m
2
(C)
1 − K
when A 6=
/
0 (9)
FCTA 2015 - 7th International Conference on Fuzzy Computation Theory and Applications
48
m
12
(
/
0) = 0, when K =
∑
B∩C6=
/
0
m
1
(B)m
2
(C) (10)
The coefficient K represents the mass that the combi-
nation assigns to
/
0 and reflects the conflict among the
sources. The denominator in Dempster’s rule, 1 − K,
is a normalization factor, which throws out the opin-
ion of those experts who assert that the object under
consideration does not exist.
3 METHODS AND DATA
3.1 Study Area and Data
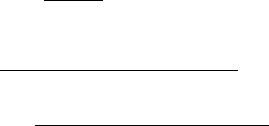
Reunion Island is a French territory of 2500 km
2
located in the Indian Ocean, 200 km South-West of
Mauritius and 700 km to the East of Madagascar
(Fig. 1). Mean annual temperatures decrease from 24
degC in the lowlands to 12 degC at ca 2000 m. Mean
annual precipitation ranges from 3 m on the eastern
windward coast, up to 8 m in the mountains and
down to 1m along the south western coast. Vegetation
is most clearly structured along gradients of altitude
and rainfall (Cadet, 1980). Reunion Island has a
strong growth in a limited area with an estimated
population of 833,000 in 2010 that will probably
be more than 1 million in 2030 (Reunion, 2011).
It have been a significant changes, putting pressure
on agricultural and natural areas. The urban areas
expanded by 189% over the period from 1989 to 2002
(Durieux et al., 2008) and available land became a
rare and coveted resource. The landscapes are now
expected to fulfil multiple functions i.e. urbanisation,
agriculture production and ecosystem conservation
and this causes conflicts among stakeholders about
their planning and management (van der Valk, 2002).
Saint−Denis is the capital of Reunion Island, and
the city with the most inhabitants on the island (Fig.
1). It hosts all the important administrative offices,
and is also a cultural center with numerous museums.
Saint-Denis is also the largest city in all of the French
Overseas Departments.
Figure 1: Location of the study area.
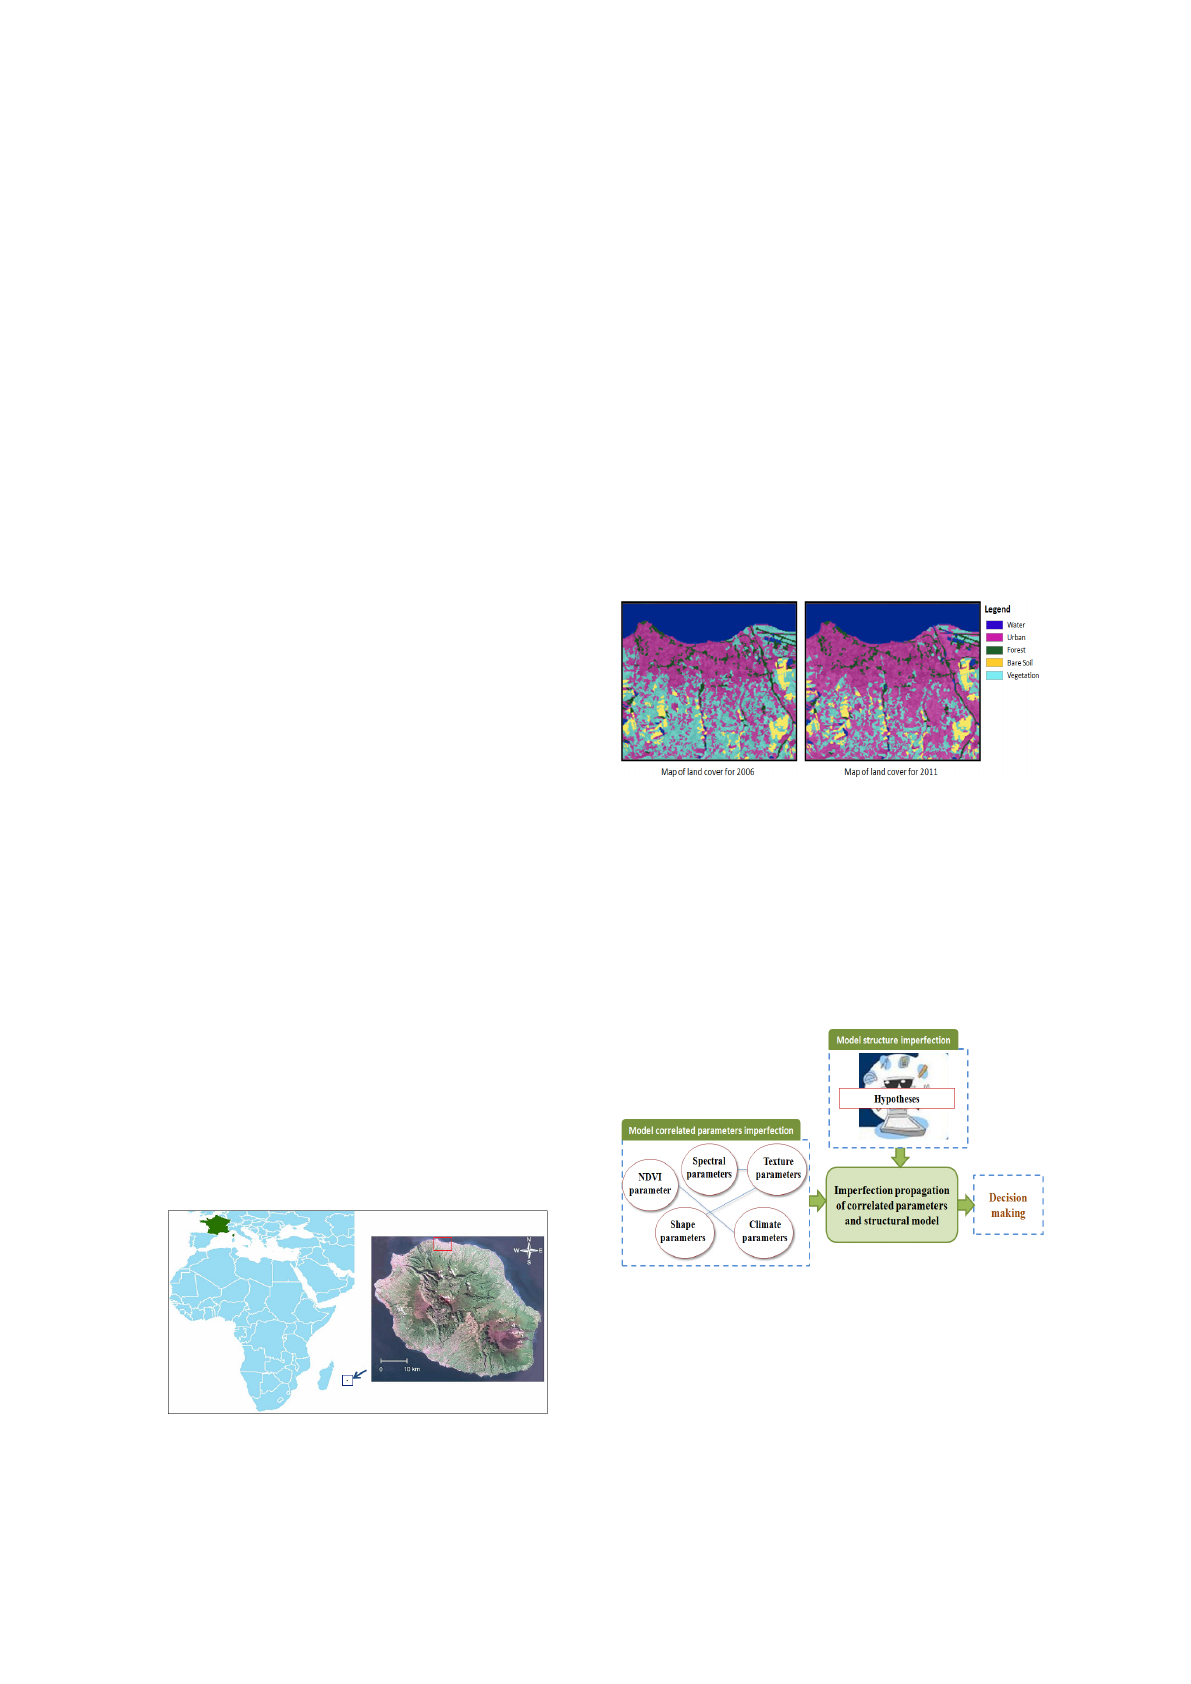
Available remote sensing data for this research in-
clude classified images of land over of Saint−Denis
from SPOT-4 images for the years 2006 and 2011
(Fig. 2). Selecting these images benefits from ad-
vantages such as a broad and integrated view, multi-
spectral images and replicated coverage in different
time periods. For this study, satellite data were clas-
sified after initial corrections and processing in order
to prepare the data for extracting useful information.
Spectral, geometric, and atmospheric corrections of
images were conducted to make features manifest, in-
crease the quality of images and to eliminate the ad-
verse effects of light and atmosphere. According to
the study objective and different land cover of the
area, five categories including water, urban, forest,
bare soil, and vegetation were identified and classi-
fied.
Figure 2: Satellite images.
3.2 Methodology
In this section, we propose the application of the ev-
idence theory for propagating imperfections of cor-
related parameters and imperfections of structural
model in the context of LCC prediction. The pro-
posed approach is presented in the figure 3.
Figure 3: General modelling proposed framework.
The first step is to map sources and types of imper-
fection of parameter and model structure (Ferchichi
et al., 2014) and to study correlation among parame-
ters. Finally, the propagation of all sources simultane-
ously provides an analysis of their effect on the model
response.
Using Evidence Theory in Land Cover Change Prediction to Model Imperfection Propagation with Correlated Inputs Parameters
49
3.2.1 Processing and Modeling of Parameter
and Model Structure Imperfection
The objective of this step is to identify imperfections
related to both correlated input parameters of LCC
prediction model in one hand, and imperfections
related to structure of this model in the other hand.
a) Parameter Imperfection
These imperfections are related to input data of
LCC prediction model.
X Sources of parameter imperfection: To
better provide decisions about LCC, prediction model
include several input parameters. These parameters
describe objects extracted from satellite images and
which are subject of studying changes. In this study,
objects are extracted from images coming from
SPOT-4 image, including four multispectral bands
and one monospectral band:
• 10 spectral parameters: Mean values and standard
deviation values of green, red, NIR, SWIR and
monospectral bands for each image object;
• 6 texture parameters: These parameters generated
from GLCM (Gray Level Co-occurrence Matrix)
include homogeneity, contrast, dissimilarity, en-
tropy, standard deviation and correlation. Their
definitions as following:
Hom =
∑
i
∑
j
P(i− j)
1+(i− j)
2
Ctr =
∑
i
∑
j
P(i − j)
2
Ent =
∑
i
∑
j
P(i − j)[−logP(i − j)]
SD =
q
∑
i
∑
j
P(i −
∑
i
∑
j
i • P(i − j))
2
Cor =
∑
i
∑
j
(i−
∑
i
∑
j
i•P(i− j))( j−
∑
i
∑
j
i•P(i− j))
SD
2
where i and j are two different grey levels of the
image, P is the number of the co-appearance of
grey levels i and j.
• 7 shape and spatial relationships parameters: area,
length/width, shape index, roundness, density,
metric relations and direction relations;
• 1 vegetation parameter: The NDVI (Normalized
Difference Vegetation Index) is the ratio of the
difference between NIR and red reflectance.
• 3 climate parameters: temperature, humidity and
pressure.
The inclusion of these 27 uncertain parameters
was based on previous studies (Boulila et al.,
2014)(Boulila et al., 2011).
− Spectral parameters imperfection sources: Sev-
eral studies have presented effects of spectral param-
eters on prediction decisions (Atanassov et al., 2013).
Among these effects we list: spectral reflectance of
the surface, sensor calibration, effect of mixed pixels,
effect of a shift in the channel location, pixel registra-
tion between several spectral channels, atmospheric
temperature and moisture profile. To reduce the spec-
tral imperfections, (Atanassov et al., 2013) have pro-
posed some solutions e.g. strict requirements for the
instrument’s design, envisaging of appropriate proce-
dures for on-board calibration, choosing appropriate
algorithms for radiometric and atmospheric correc-
tion, reducing the wavelength range of the irradiance
or spectral response measurement, reducing the cloud
shadows and cloud contamination effects and reduc-
ing errors of sensor system itself.
− Texture parameters imperfection sources: Those
factors may produce a textural effect derived by the
spatial interaction between the size of the object in the
scene and the spatial resolution of the sensor, a border
effect, and ambiguity in the object/background dis-
tinction. (Peters, 1995) (Pesaresi and Benediktsson,
2001) have proposed some solutions for reduction of
texture data imperfection e.g. using high spatial reso-
lution and choosing appropriate methods for segmen-
tation.
− Shape parameters imperfection sources: Imper-
fection related to shape parameters can rely to the fol-
lowing factors (Atanassov et al., 2013): accounting
for the seasonal position of the sun with respect to
the Earth, conditions in which the image was acquired
changes in the scene’s illumination, atmospheric con-
ditions and observation geometry. (Atanassov et al.,
2013) have proposed some solutions for reduction of
shape data imperfection e.g. improving the platforms’
stability and the carrier’s velocity, technological en-
hancement of the sensors themselves, reducing the ef-
fects of atmospheric conditions, improving the overall
segmentation quality, reducing of the number of bad
pixels and the size of bad areas, and improvement of
the imperfection of pixels’ response.
− NDVI imperfection sources: Among factors that
affect NDVI, we can list: variation in the brightness
of soil background, red and NIR bands, atmospheric
perturbations as a function of the state of the atmo-
sphere and the soil surface at the time of the two ac-
quisitions and variability in the structure of sub-pixel
of the vegetation, and variability in the structure of
sub-pixel. To reduce the NDVI imperfections, (Miura
et al., 2000) (Hird and McDermid, 2009) have pro-
posed some solutions e.g. choosing appropriate al-
gorithms for atmospheric correction, reducing errors
in surface measurements for the NIR and red bands,
reducing the temporal variations effects in the solar
zenith and azimuth angles, and reducing the sun an-
gle effects and noise contamination.
− Climate parameters imperfection sources: Sev-
FCTA 2015 - 7th International Conference on Fuzzy Computation Theory and Applications
50
eral studies have investigated the influence of several
factors on the climate parameters accuracy (Jimenez-
Munoz and Sobrino, 2006). These factors can be: at-
mospheric correction, noise of the sensor, land sur-
face emissivity, aerosols and other gaseous absorbers,
angular effects, wavelength imperfection, full-width
half maximum of the sensor and band-pass effects.
To reduce the climate data imperfections, (Jimenez-
Munoz and Sobrino, 2006) (Hulley et al., 2012) have
proposed some solutions e.g. choosing appropriate al-
gorithms for atmospheric correction, reducing errors
of sensor system itself, reducing the emissivity varia-
tions, reducing the sun angle effects and solar heating,
reducing the errors of radiometer calibration and the
errors of radiation, and reducing errors of spatial and
temporal variability of clouds.
X Types of parameter imperfection: Imper-
fection related to input parameters to the LCC predic-
tio model can be of two types: epistemic and random.
The imperfection type for each parameter depends on
sources of their imperfection. For example, for the
NDVI parameter, imperfection sources are the bright-
ness of pixels, the red and NIR bands, etc. Thus, each
imperfection source provides an imperfection type for
NDVI parameter. For example, the brightness of pix-
els on darker pixels leads to imprecise information in
a vegetation zone. In this case, the NDVI parameter
is marred by an epistemic imperfection.
X Modeling of parameter imperfection: The
goal of this step is to determine the distribution of
each uncertain parameter. For random parameters,
various distributions, such as uniform, triangular, nor-
mal, or lognormal distributions, can be used in the
model. For epistemic parameters, there are also many
distributions such as: belief and plausibity distribu-
tions, possibility distribution, etc. Herein, each im-
perfection propagation method has its own specific
distributions.
X Analysis of parameters correlation: Its
objective is to determine the relationships between
parameters. In general, input parameters in remote
sensing systems are not independent of each other.
The value of one parameter can affect the value of
another. A LCC prediction model usually contains a
large number of correlated parameters leading to non-
identifiability problems. For example, the distribution
and the production of vegetation are strongly influ-
enced by temperature. Then, temperature and NDVI
parameters are correlated.
b) Model Structure Imperfection
These are imperfections related to LCC predic-
tion model structure itself. The proposed model
for LCC prediction is presented in previous work
(Boulila et al., 2011). In this work, we presented a
model to predict spatiotemporal changes in satellite
image databases. The proposed model exploits data
mining concepts to build predictions and decisions
for several remote sensing fields. Imperfections
related to the structure of LCC prediction model can
be very numerous and affect different parts of the
model. Therefore necessary to identify imperfections
sources that should be considered for processing.
Then, imperfection related to model structure are
resulting from conceptualization, simplifications, and
hypotheses related to a lack of knowledge about a
system, a structure, and the behavior of components
in varied conditions during development. In majority,
the imperfection of structural representation is the
most influential imperfection on LCC prediction
model. The development of LCC prediction model
is based on a number of hypotheses which are
decisions or judgments considered by analysts. For
example, when two hypotheses H
1
, H
2
are given
by two different experts, then we have two differ-
ent structural models M
1
and M
2
. In most cases,
imperfection about LCC prediction model structure
is a form of epistemic imperfection because we are
unsure whether their constructions are reasonable
and complete. It would be aleatory imperfection
only if the structure of the governing model were
itself to change over time, across space, or among
components in some population.
3.2.2 Propagation of Imperfection using
Evidence Theory
The objective of this step is to propagate the imper-
fection of correlated parameters and the imperefction
of model structure using evidence theory.
a) Parameters Imperfection Propagation
using Evidence Theory
Using the evidence theory to model imperfec-
tions has been studied extensively in several fields
(Duy et al., 2013) (Abdallah et al., 2013). In this
section, the procedures of propagating the unified
structures dealing with both random and epistemic
imperfection and with considering correlation among
parameters will be addressed. For the proposed
model, first we should identify which type of imper-
fection each parameter. To illustrate the proposed
method, we use a simple transfer function which has
two uncertain parameters
Y = f (E,A). (11)
where E represents the epistemic imperfection param-
eter, A represents the random imperfection parameter
Using Evidence Theory in Land Cover Change Prediction to Model Imperfection Propagation with Correlated Inputs Parameters
51

and Y is the model response of the LCC. For E, the
epistemic imperfection is generally expressed by a se-
ries of subsets of the universal set associated with a
BPA structure just as {[E
L
1
,E
U
1
]/m(1),[E
L
2
,E
U
2
]/m(2)
,...,[E
L
k
,E
U
k
]/m(k),...|k ∈ (1,2,...,M)}. Where M is
the total number of subintervals of E and m(k) repre-
sents the BPA value associated with the kth subinter-
val [E
L
k
,E
U
k
]. When there are different BPA structures,
we can use combining rule to integrate them into a
combined BPA structure as E
j
/m(E
j
)( j ∈ [1,2,, M])
ultimately, where E
j
is also an interval as [E
L
j
,E
U
j
]
and m(E
j
) is the BPA value associated with the in-
terval E
j
. For A, assuming A is normal distribution
A ∼ (µ,σ), the distribution scope can be truncated to
[µ − ξσ,µ + ξσ] approximately and then we can dis-
cretize the approximate interval into N subintervals
[A
L
i
,A
U
i
], i ∈ [1,2, , N], and for each subinterval the ba-
sic probability value is defined:
m(A
i
) =
Z
A
U
i
A
L
i
f (x)dx,i ∈ [1,2,...,N]. (12)
where A
i
is defined as {A
i
|x ∈ [A
L
i
,A
U
i
]} and f (x) is
the probability density distribution function (pdf) of
x. Obviously for the random parameter, the equiva-
lent BPA values within specified intervals are equal to
the area under the pdf. After obtaining the BPA struc-
tures of all the uncertain parameters, we can integrate
them into a joint structure. The joint BPA structure
is defined by the Cartesian product, which is synthe-
sized as:
C = A × E = {c
i j
= A
i
× E
j
} (13)
where C denotes the Cartesian set of all the uncertain
parameters and c
i j
is the element of C.
− When the uncertain parameters, E and A, are inde-
pendent, the joint BPA for c
i j
is defined by multiply-
ing the BPA of A
i
to the BPA of E
j
.
m(c
i j
) = m(A
i
) × m(E
j
) (14)
The focal element c
i j
is included by the joint FD, and
its BPA is just equal to the multiplication of the cor-
responding marginal BPAs.
− When the uncertain parameters, E and A, are
correlated, we will develop a new evidence the-
ory model which takes into account the correlation
among parameters based on ellipsoidal model (Luo
et al., 2008). Then, the ellipsoidal model is originally
proposed for non-probabilistic imperfection analysis.
Here the ellipsoidal model is extended to deal with the
correlated evidence parameters. For this purpose, a
multidimensional ellipsoid is constructed by making
all possible realizations of the N-dimensional inter-
correlated evidence parameters fall into a joint FD:
Ω = {X|(X − X
c
)
T
G(X − X
c
) ≤ 1} (15)
where the ellipsoidal center X
c
is obtained through
the marginal FDs:
X
m
c
=
X
m
L
+ X
m
R
2
,m = 1,2,...,N (16)
where X
m
∈ c
i j
is the evidence parameters (random
and epistemic parameters).
The symmetric positive-definite characteristic matrix
G determines the size and orientation of the ellip-
soid, reflecting the degree and the manner of corre-
lation between the evidence parameters. Obviously,
one should assign the belief probabilities only to the
elements c
i j
that are partially or totally falling into the
ellipsoid model. Thus, a joint BPA is formulated as:
m(c
i j
∩ Ω) =
m(A
i
) × m(E
j
)
S
,c
i j
∩ Ω 6= 0 (17)
where S is a normalization factor to make the total
BPAs of m equal to 1.0, which is given by
S =
∑
c
i j
∩Ω6=0
m(c
i j
) (18)
Then, get the upper and lower CDFs of system re-
sponse y via evidence reasoning.
Let Θ
Y
= {d
i j
: d
i j
= f (c
i j
),c
i j
⊂ Θ
X
} denote the
frame of discernment of Y, where d
i j
is its focal el-
ement, f is the LCC prediction model in (11), and Θ
X
is the frame of discernment of X. After determining
the sets, c
i j
and d
i j
, the belief and plausibility func-
tions are evaluated by checking all propositions of the
joint BPA structure, as given in the following equa-
tions (Joslyn and Helton, 2002).
Bel
Y
(d
i j
) = Bel
X
[ f
−1
(d
i j
)] =
∑
c
i j
⊂ f
−1
(d
i j
)
m
X
(c
i j
)
(19)
Pl
Y
(d
i j
) = Pl
X
[ f
−1
(d
i j
)] =
∑
c
i j
∩ f
−1
(d
i j
)6=
/
0
m
X
(c
i j
)
(20)
Then
Bel
Y
(y < v) = Bel
X
[ f
−1
(Y
v
)] =
∑
c
i j
⊂ f
−1
(Y
v
)
m
X
(c
i j
)
(21)
Pl
Y
(y < v) = Pl
X
[ f
−1
(Y
v
)] =
∑
c
i j
∩ f
−1
(Y
v
)6=
/
0
m
X
(c
i j
)
(22)
Y
v
= {y : y < v,y ∈ Θ
Y
} (23)
From (8),
Bel
Y
(y < v) ≤ P(y < v) ≤ Pl
Y
(y < v) (24)
Obviously, Bel
Y
is the lower CDF of the LCC predic-
tion system response Y , and Pl
Y
is the upper CDF.
FCTA 2015 - 7th International Conference on Fuzzy Computation Theory and Applications
52
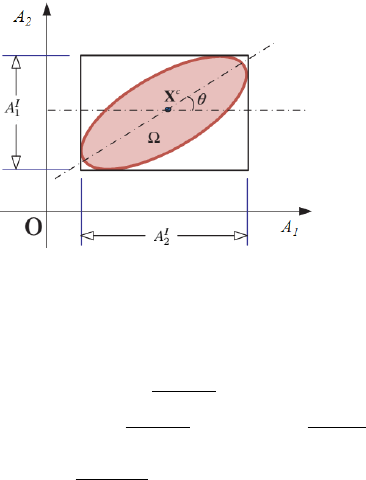
• Algorithm of the ellipsoidal model construction:
Assuming that there are t experimental samples
X
(r)
, r = 1,2, ...,t for the N evidence parameters
and each sample is an N-dimensional vector, the
ellipsoidal model can be established as follows:
1. Take a pair of evidence parameters X
m
and X
n
(m 6= n) at a time from the uncertain parameter
set.
2. Extract the values of X
m
and X
n
from the t
experimental samples and construct a corre-
sponding bivariant sample set (X
(r)
m
,X
(r)
n
), r =
1,2,...,t.
3. Create a minimum ellipse enveloping the ob-
tained bivariant samples and obtain the corre-
sponding rotation angle θ as shown in Fig. 5.
Figure 4: Ellipsoidal-model-based joint FD.
4. Compute the covariance (Cov) and correlation
coefficient (ρ) of the two uncertain parameters
X
m
and X
n
based on the value of θ:
– Cov(X
m
,X
n
) =
tan(θ)
1−tan
2
(θ)
((X
w
m
)
2
− (X
w
n
)
2
)
where X
w
m
=
X
m
L
+X
m
R
2
and X
w
n
=
X
n
L
+X
n
R
2
represent the radii of X
m
and X
n
, respectively.
– ρ
X
m
X
n
=
Cov(X
m
,X
n
)
X
w
m
X
w
n
, −1 ≤ ρ
X
m
X
n
≤ 1.
5. Repeat the above process for all pairs of uncer-
tain parameters, and obtain a total of N(N −
1)/2 covariances and correlation coefficients
for all the parameters.
6. Create a covariance matrix C based on the cal-
culated covariances.
7. Finally, an ellipsoidal model can be obtained:
Ω = {X|(X − X
c
)
T
C
−1
(X − X
c
) ≤ 1} (25)
b) Model Structure Imperfection Propagation
using Evidence Theory
The model structure imperfection propagation is
implemented in combination with the propagation
of the parametric imperfection. In this section, as
parametric imperfections are modeled by evidence
theory, we use this technique in this framework (Fer-
chichi et al., 2014). Therefore, the final imperfection
representation of output variable Y can be obtained
by the following formulas.
Bel
∗
(Y ) = min(Bel
1
(Y ),Bel
2
(Y ),...,Bel
K
(Y )) (26)
Pl
∗
(Y ) = max(Pl
1
(Y ),Pl
2
(Y ),...,Pl
K
(Y )) (27)
The belief and plausibility functions
[Bel
∗
(Y ),Pl
∗
(Y )] take into account both param-
eter and structural model imperfection in the final
output result.
4 EXPERIMENTAL RESULTS
The aim of this section is to validate and to evaluate
the performance of the proposed approach in propa-
gating imperfection related to correlated parameters
and structural model. The proposed approach was
used that subdivided the database into training (60%),
validation set (10%), and test set (30%). The train-
ing data set is used for building the LCC prediction
model. A validation set was used to stop the train-
ing procedure, and a test set was used to validate the
performance of the LCC prediction model.
4.1 Validation of the Proposed
Approach
4.1.1 Validation of the Imperfection
Propagation of LCC Prediction Model
In proposed changes prediction model, the process-
ing and propagating imperfections associated with 27
input parameters in the framework of evidence the-
ory are realized. To validate the proposed approach,
consider that the all parameters are independent. The
cumulative distribution function (CDF) of output rep-
resenting only the imperfection in parameters is ob-
tained via evidence theory. In fact, Figure 6 shows
this distribution based on 10,000 samples. Now, con-
sider that the parameters are correlated. The CDF of
output representing only the imperfection in param-
eters is obtained in figure 6. Here, the difference in
both distributions representation presents the effect
and the impact of parameters correlation.
Also, Figure 7 shows the belief (Bel*) and plau-
sibility (Pl*) functions representing the integrated pa-
rameter and structural model imperfections about the
LCCs.
Note that the combined effect of structural model
and parameter imperfection lead to a wider imperfec-
tion bound of the LCC when compared against the
parameter imperfection case.
Using Evidence Theory in Land Cover Change Prediction to Model Imperfection Propagation with Correlated Inputs Parameters
53
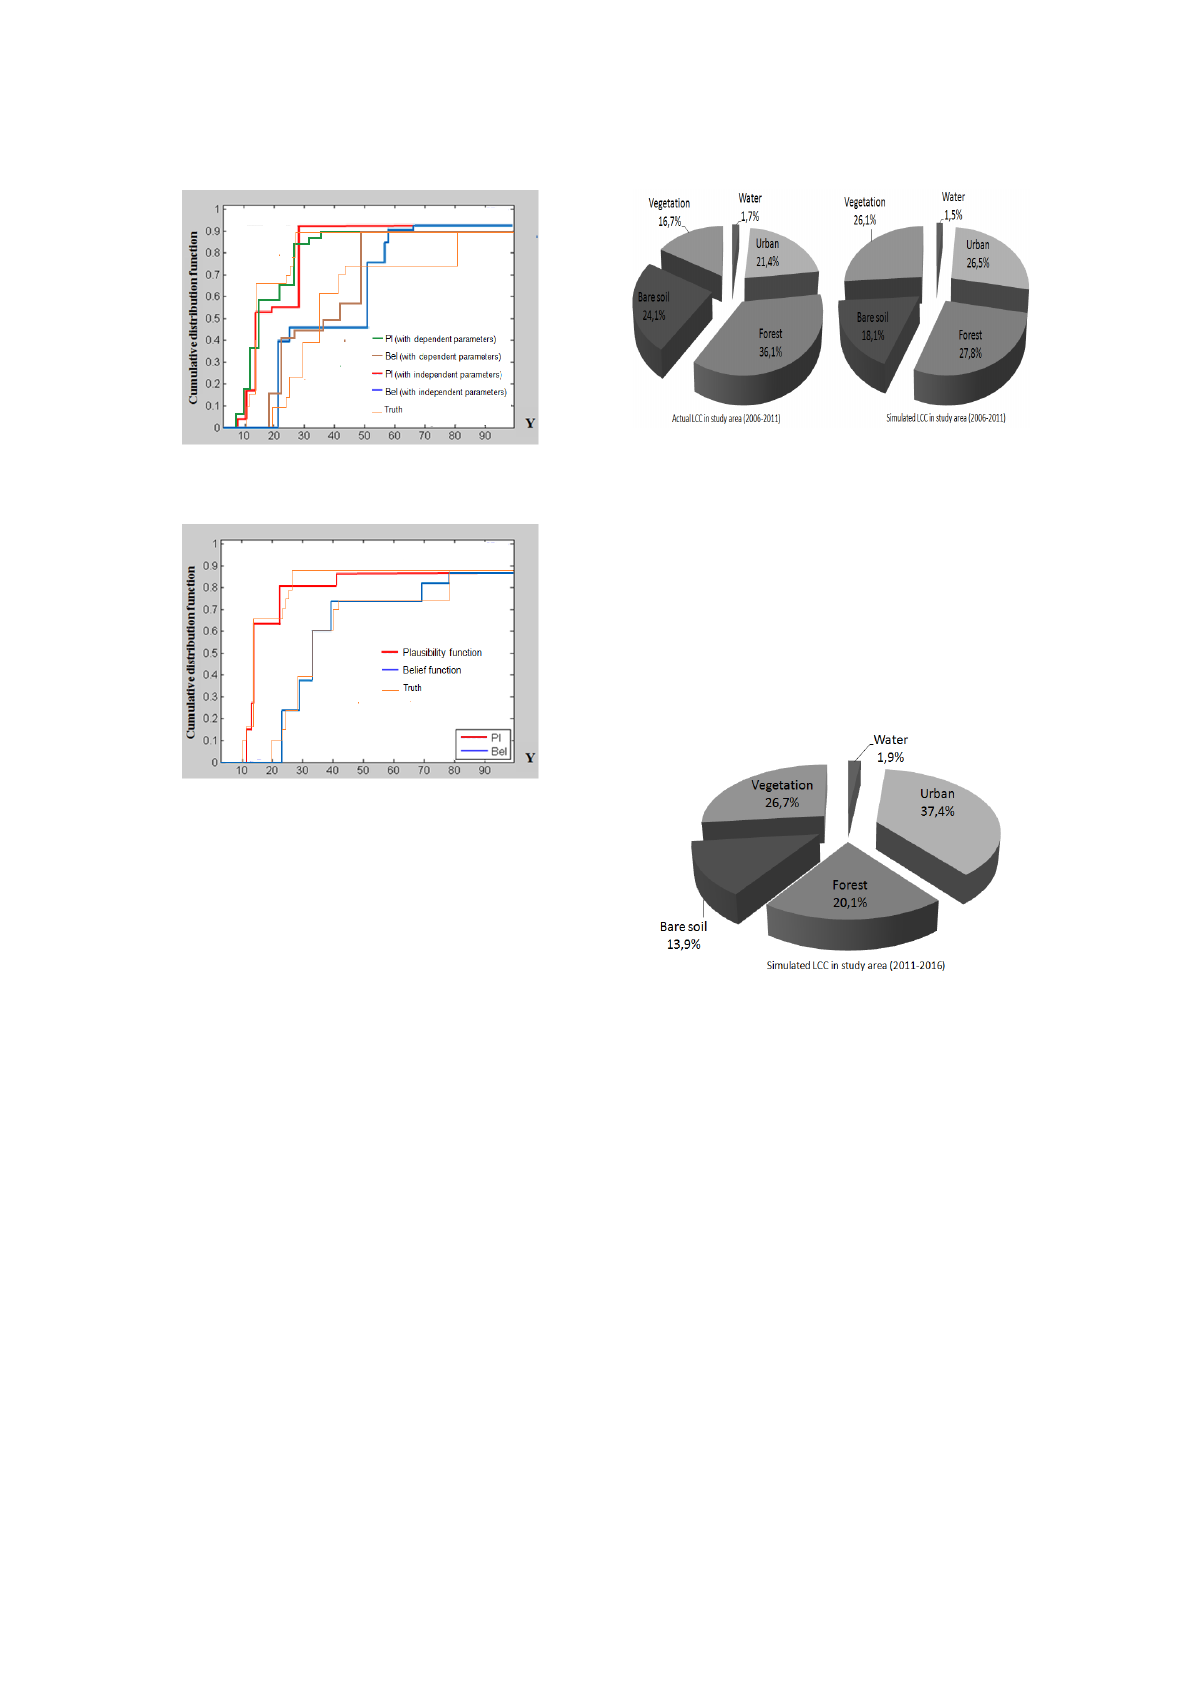
Figure 5: Distributions of model output (LCCs) of only pa-
rameter imperfection with (in)dependence parameters.
Figure 6: Belief and plausibility functions of the combined
parameter and structural model imperfections for LCCs.
4.1.2 Validation of LCC Prediction Maps
The validation of LCC prediction maps consisted of
two phases. First, the 2011 LCC was simulated using
the 2006 datasets, which was then compared with the
actual LCC in 2011 to evaluate the accuracy and the
performance of the proposed approach. Second, the
future changes was simulated using the actual 2011
datasets. Figure 8 compares the actual and the simu-
lated percentages occupied by the different land cover
types (water, urban, forest, bare soil, and vegetation)
between 2006 and 2011; it shows that the simulated
changes generally matched that of the actual changes.
These results confirms that the LCC prediction model
were reasonable to describe the LCC and the pro-
posed approach can simulate the prediction of LCC
with an acceptable accuracy.
After the validation of the proposed approach, the
next step was to simulate the LCC in 2016, assum-
ing the changes between 2006 and 2011 will con-
tinue during the next time interval. In this simula-
tion, the LCC and input parameters acquired in 2011
were used as input to simulate the LCC in 2016. Fig-
ure 9 shows that the simulated changes between 2006
and 2016. There have been significant LCC where ur-
Figure 7: Categorical distribution of the actual and simu-
lated LCC between 2006 and 2011.
ban land covered 26,5% of simulated changes in 2011
and 37,4% in 2016. This could be attributed to the
increase in population by increased demands for res-
idential land. The resulting effect was the decrease
in forest land from 27,8% of simulated changes in
2011 and to 20,1% in 2016. From these results, it
can be found the replacing the land natural cover (for-
est land) in the study area by residential land (urban
land).
Figure 8: Categorical distribution of the simulated LCC be-
tween 2011 and 2016.
Figure 11 maps the simulated future changes com-
pared with land cover maps for the years 2006 and
2011. These results indicate usefulness and applica-
bility of the proposed approach in predicting the LCC.
4.2 Evaluation of the Proposed
Approach
In order to evaluate the proposed approach in LCC
prediction, we apply the proposed method and the
methods presented by (Boulila et al., 2014) [1] and
(Gong et al., 2013) [5]. Then, we compare the pro-
posed prediction changes to these two methods.
Table 1 depicts the error calculated between real
LCCs, proposed method and methods presented in [1]
and [5] between dates 2007 and 2011. As we note,
the proposed approach provides a better results than
FCTA 2015 - 7th International Conference on Fuzzy Computation Theory and Applications
54
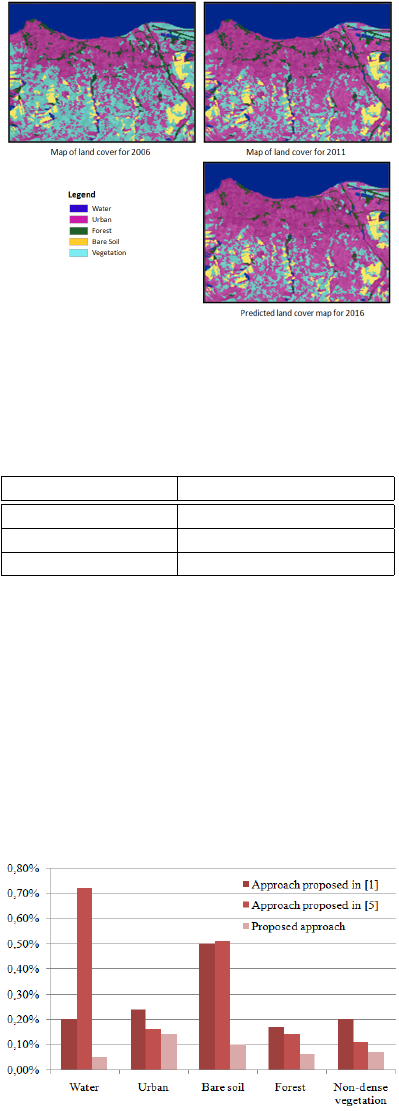
Figure 9: Comparison between the land cover maps for
years 2006 and 2011 and the predicted land cover map for
2016.
Table 1: Error for the prediction of LCCs between dates
2007 and 2011.
Approach predicting LCCs (%)
Approach in [1] 0.18
Approach in [5] 0.23
Proposed approach 0.09
the methods presented in [1] and [5] in predicting
LCCs. This shows the effectiveness of the proposed
approach in reducing imperfection related to the pre-
diction process. Indeed, figure 10 shows the differ-
ence between real changes and changes prediction for
the three approaches: proposed approach, approach in
[1] and approach in [5]. For example, as we note, the
proposed approach predicts a change of 72.15% for
forest object, while the real image shows a change of
72.21%.
Figure 10: Comparaison between real changes and changes
prediction for the three approaches: proposed approach, ap-
proach proposed in [1] and approach proposed in [5] .
This provides a difference in the order of 0.06%.
This result confirms the effectiveness of the proposed
approach in improving LCC prediction. This is made
by reducing the effect of imperfection related to pa-
rameters and model structure and the effect of their
propagation on LCC prediction model.
5 CONCLUSION
This article has expanded the evidence theory frame-
work for propagating correlated parameters and struc-
tural model imperfections through a LCC prediction
model. We used the ellipsoidal model to analyze cor-
related parameters. The proposed approach has also
modeled both imperfections types (random and epis-
temic) that are associated with input parameters and
model itself.
The results show the importance to propagate both
aleatory and epistemic imperfection and to consider
correlation among input parameters in LCC predic-
tion model. Proposed approach studied the changes
prediction of land cover in Saint-Denis City, Reunion
Island of next 5 years (2016) using multi-temporal
Spot-4 satellite images in 2006 and 2011. Results
indicated that the urban land covered 26,5% of sim-
ulated changes in 2011 and 37,4% in 2016 and the
forest land covered 27,8% of simulated changes in
2011 and 20,1% in 2016. From these results, it can
be found the replacing the land natural cover (for-
est land) in the study area by residential land (urban
land).
Proposed approach was compared on error predic-
tion to existing propagation methods. Results show
good performance of the proposed approach in im-
proving prediction of the LCC. More work, however,
is needed to understand how to reduce the computa-
tional cost in our proposed approach. LCC prediction
model with a large number of uncertain input param-
eters is more complex. To optimize, it is important to
study the sensitivity of input parameters and also the
sensitivity of model structure.
REFERENCES
Abdallah, N., Mouhous-Voyneau, N., and Denoeux, T.
(2013). Using dempster-shafer theory to model un-
certainty in climate change and environmental impact
assessments. In International Conference on Informa-
tion Fusion.
Atanassov, V., Jelev, G., and Kraleva, L. (2013). Some
peculiarities of the preprocessing of spectral data and
images. In Journal of Shipping and Ocean Engineer-
ing.
Boulila, W., Bouatay, A., and Farah, I. (2014). A probabilis-
tic collocation method for the imperfection propaga-
Using Evidence Theory in Land Cover Change Prediction to Model Imperfection Propagation with Correlated Inputs Parameters
55
tion: Application to land cover change prediction. In
Journal of Multimedia Processing and Technologies.
Boulila, W., Farah, I., Ettabaa, K., Solaiman, B., and
Ghzala, H. B. (2011). A data mining based approach
to predict spatio-temporal changes in satellite images.
In International Journal of Applied Earth.
Cadet, T. (1980). La vegetation de l’ile de la reunion, etude
phytoecologique et phytosociologique. In PhD Thesis,
University of Aix Marseille.
Droguett., E. and Mosleh, A. (2012). Integrated treat-
ment of model and parameter uncertainties through a
bayesian approach. In Proceedings of the Institution
of Mechanical Engineers, Part O: Journal of Risk and
Reliability.
Durieux, L., Lagabrielle, E., and Andrew, N. (2008). A
method for monitoring building construction in urban
sprawl areas using object-based analysis of spot 5 im-
ages and existing gis data. In ISPRS J. Photogramm.
Duy, T. L., Dieulle, L., Vasseur, D., Brenguer, C., and Cou-
plet, M. (2013). An alternative comprehensive frame-
work using belief functions for parameter and model
uncertainty analysis in nuclear probabilistic risk as-
sessment applications. In Proceedings of the Institu-
tion of Mechanical Engineers, Part O: Journal of Risk
and Reliability.
Eckhardt, K., Breuer, L., and Frede, H. (2003). Parameter
uncertainty and the significance of simulated land use
change effects. In Journal of Hydrology.
Ferchichi, A., Boulila, W., and Farah, I. (2014). Parameter
and structural model imperfection propagation using
evidence theory in land cover change prediction. In
IEEE International Conference on Image Processing,
Applications and Systems.
Gong, W., Gupta, H., Yang, D., Sricharan, K., and Hero,
A. (2013). Estimating epistemic and aleatory uncer-
tainties during hydrologic modeling: An information
theoretic approach. In Water resources research.
Hird, J. and McDermid, G. (2009). Noise reduction of ndvi
time series: An empirical comparison of selected tech-
niques. In Remote Sensing of Environment.
Hoffman, F. and Hammonds, J. (1994). Propagation of un-
certainty in risk assessment: the need to distinguish
between uncertainty due to lack of knowledge and un-
certainty due to variability. In Risk Analysis.
Hulley, G., Hughes, C., and Hook, S. (2012). Quantifying
uncertainties in land surface temperature and emissiv-
ity retrievals from aster and modis thermal infrared
data. In Journal of Geophysical Research.
Jiang, C., B. Wang, Z. L., Han, X., and Yu, D. (2013).
An evidence-theory model considering dependence
among parameters and its application in structural re-
liability analysis. In Engineering Structures.
Jimenez-Munoz, J. and Sobrino, J. (2006). Error sources
on the land surface temperature retrieved from ther-
mal infrared single channel remote sensing data. In
International Journal of Remote Sensing.
Joslyn, C. and Helton, J. (2002). Bounds on belief and
plausibility of functionality propagated random sets.
In Proc. of Annual Meetings of the North American
Fuzzy Information Processing Society.
Klir, G. (1994). On the alleged superiority of probability
representation of uncertainty. In IEEE Transactions
on Fuzzy Systems.
Luo, Y., Kang, Z., Luo, Z., and Alex, L. (2008). Continuum
topology optimization with nonprobabilistic reliabil-
ity constraints based on multi-ellipsoid convex model.
In J.Struct.Multidiscip.Optim.
Miura, T., Huete, A., and Yoshioka, H. (2000). Evaluation
of sensor calibration uncertainties on vegetation in-
dices for modis. In IEEE Transactions on Geoscience
and Remote Sensing.
Pesaresi, M. and Benediktsson, J. (2001). A new ap-
proach for the morphological segmentation of high-
resolution satellite imagery. In IEEE Transactions on
Geoscience and Remote Sensing.
Peters, R. (1995). A new algorithm for image noise reduc-
tion using mathematical morphology. In IEEE Trans-
actions on Image Processing.
Reunion, I. (2011). Bilan dmographique 2009. In Rsultats.
Rohmer, J., Douglas, J., Bertil, D., Monfort, D., and Sedan,
O. (2014). Weighing the importance of model uncer-
tainty against parameter uncertainty inearthquake loss
assessments. In Soil Dynamics and Earthquake Engi-
neering.
Shafer, G. (1976). A mathematical Theory of Evidence.
Princeton, NewJersey, USA: Princeton University
Press.
van der Valk, A. (2002). The dutch planning experience. In,
Landsc. Urban Plan.
Zadeh, L. (1965). Fuzzy sets. In Information and Control.
FCTA 2015 - 7th International Conference on Fuzzy Computation Theory and Applications
56
