
Applying the AHP to Smart Mobility Services: A Case Study
Roberto Boselli, Mirko Cesarini, Fabio Mercorio and Mario Mezzanzanica
Department of Statistics and Quantitative Methods - C.R.I.S.P. Research Centre, University of Milan-Bicocca, Milan, Italy
Keywords:
Decision Making, Business Intelligence, Smart City, AHP.
Abstract:
Making decision is a far from straightforward process, as it often requires to consider a number of complex
criteria whose importance relies on the experiences and the preferences of the decision makers involved.
Being able to structure and reproduce this knowledge is a challenging issue in the context of strategic decision
making, and also common BI analytics can benefit from the joint use of that knowledge. As a contribution, in
this work we describe how a multi criteria decision making technique, i.e., the Analytic Hierarchy Process, has
been applied to a smart-mobility context, where the decision goal was to weight the factors that support the
innovation of a smart mobility service in the city of Milan. The AHP has been selected as it allows considering
both tangible and intangible factors that guide the decision within the model. We employed three distinct kind
of stakeholders, namely service providers, over 35, and under 35 users and we synthesised a ranking of criteria
on the basis of the preferences they provided. The results shed the light on the different judgments that each
group gives to the identified criteria in terms of both ranking and importance.
1 INTRODUCTION
Making decisions is part of everyday life, and this
process always involve a number of subtended and
implicit criteria that one draws on the past experience.
To give an example, buying a smartphone is a deci-
sion process that takes into account several criteria,
some tangible like cost, performances, battery life,
and some factors that are intangible, such as having
a comfortable grip, the style, and the past experience
with the vendor, too. All these factors affect our fi-
nal decision in a way that is hard to be reproduced or
explained.
In such a scenario, the basic idea of Multi Crite-
ria Decision making (MCDM) is to provide a set of
methods that allows decision makers to structure and
to weight the criteria that guide their decision. This
activity has proved to be beneficial in a large number
of real-life domains (Wu and Lee, 2007; Madas and
Zografos, 2008; Bello-Dambatta et al., 2009; Abdi
and Labib, 2003), as it enables the formalisation of
the decision process, making possible to iterate and to
validate it (e.g., to validate whether the judgments on
the criteria are sound or not) and to make evidence of
the decision process to the decision makers involved.
When prior experience is missing on formalising and
understanding complexdecision making processes in-
volving several actors, a systematic and comprehen-
sive approach as MCDM is very useful. Being able
to explain, formally motivate, and share the reasons
behind decision making is far from negligible, as it
helps obtaining a more reliable and shared decision
process.
On the other side, the smart-city context is grow-
ing in importance in both academic and industrial
communities, as it aims at improving the sustainabil-
ity and the quality of citizens’ life (see, e.g., (Nam
and Pardo, 2011)). A report of the European Com-
mission has recently listed the (most) important ele-
ments (aka dimensions) that compose the smart-city
ecosystem (Manville et al., 2014), namely: environ-
ment, people, economy, government, living, and mo-
bility. In the EU vision, the glue of all these dimen-
sions are Human, technological, and institutional fac-
tors that allow the smart-city ecosystem working.
1.1 Motivation and Contribution
In this paper we report our experience in applying
the Analytic Hierarchy Process (AHP) method (Saaty,
1988; Saaty, 1990) to a smart-mobility decision mak-
ing process. Our aim here is to extract and struc-
ture knowledge about the decision making processes
of the several mobility service stakeholders (i.e., final
users and service provides).
In the context of strategic decision making, the use
354
Boselli R., Cesarini M., Mercorio F. and Mezzanzanica M..
Applying the AHP to Smart Mobility Services: A Case Study.
DOI: 10.5220/0005580003540361
In Proceedings of 4th International Conference on Data Management Technologies and Applications (KomIS-2015), pages 354-361
ISBN: 978-989-758-103-8
Copyright
c
2015 SCITEPRESS (Science and Technology Publications, Lda.)

of AHP would represent an added value for classical
Business Intelligence and Analytics applications, as it
sheds the light on the dynamics that form the decision
making process (i.e., the criteria and their relative im-
portance for decisor makers). This result is quite im-
portant as in many real-life domains indicators and
analytics are not sufficient to exhaustively explain the
phenomena under study. To give an example, a vari-
ant of AHP (i.e., ANP
1
) has been applied for select-
ing knowledge management strategies of a company
whose administrators were unable to decide how to
invest the year-profits, even though a lot of indica-
tors and forecasting analyses were available, due to
the personal preferences and beliefs of each on how
to invest profits. Here the ANP was helpful to guide
them in understanding and highlighting the dynam-
ics of the decisions, first by selecting criteria, then by
evaluating each criterion and finally by summarising
a common decision (see, e.g.(Wu and Lee, 2007)).
In this paper the AHP has been applied to
three distinct groups of stakeholders, namely service
providers, over 35, and under 35 users for obtaining
the weighted criteria that would rank the enabling fac-
tors for innovating a smart-mobility service in Mi-
lan. To this end, we have built an AHP model on
the basis of the service innovation enabling factors
emerged at the CityTech meeting.
2
Then, we em-
ployed a number of stakeholders for weighting these
criteria. The main outcome of this work is a weighted
hierarchy of criteria that hold all the knowledge about
this group of stakeholders - in a formal, deterministic
and replicable way - regardless of the employed mo-
bility solutions. Then, a domain analyst may exploit
the weighted hierarchy of criteria to draw up a rank
of the best mobility solutions in Milan, according to
stakeholders weighted criteria.
The paper is arranged as follows. In Sec. 2 we
briefly introduce some backgrounds on AHP tech-
nique and its strong/weak points with respect to our
purposes. In Sec. 3 we describe the AHP model built
in terms of criteria and sub-criteria while in Sec. 4 we
show the results obtained. Finally, the conclusions are
outlined in Sec. 5
1
the Analytic Network Process differs from AHP as
(1) the model is arranged as a network rather than a tree,
thus (2) it allows expressing dependences between criteria
and sub-criteria whilst independence amongst criteria is re-
quired in the AHP model
2
An international forum held in Milan, October 27th,
2014, see http://www.citytech.eu/
2 BACKGROUNDS ON AHP
Roughly speaking, Multi Criteria Decision Making
(MCDM) refers to a set of methods that allows con-
structing a global preference relation for a set of al-
ternatives to be evaluated by using several criteria. A
literature review on MCDM falls out the scope of this
paper, the reader can refer to (Figueira et al., 2005a)
for a survey.
The MDCM approaches are able to deal with
dependence amongst criteria (ANP, see e.g., (Saaty,
2004)), conflicting criteria (ELECTRE, see e.g.,
(Figueira et al., 2005b)), to synthesise compromise
solutions (TOPSIS, see e.g., (Yoon and Hwang, 1995;
Tadi´c et al., 2014)), as well as to deal with uncertainty
over the judgments (Fuzzy sets theory applied to the
previous methods, see, e.g., (Chen et al., 1992)). Even
though the AHP is one of the most widely MCDM
method used in the literature, we employed it as it
is particularly useful for evaluating complex multi-
attribute alternatives involving subjective criteria to
capture stakeholders’ knowledge of phenomena un-
der study. Basically, AHP consists of the following
main steps.
Build up the Criteria/Alternatives Tree. In this
step the analyst identifies the criteria that com-
pose the decision problem and structure them in a
hierarchical fashion, so that a criterion may have
sub-criteria, and so on. The leafs of this tree are
the alternatives that the decision process aims at
selecting.
Pairwise Comparison. In this step the stakeholders
are required to perform a pairwise comparison of
each criterion at each level of the hierarchy, and
the results are collected in a matrix summarizing
the local priorities for each domain-expert. The
main intuition here is that it is easier (and more
accurate) to compare the importance of two crite-
ria at a time than simultaneously evaluating all of
them. AHP uses the Saaty’s 1 to 9 scale to per-
form the pairwise comparison, the scale ranges
from equal important (1) to extreme important (9)
and allows expressing the intensity of importance
of a criterion over another. It is worth noting two
relevant characteristics of AHP. First, the same
preference scale is used to perform the evaluation
of both (quantitative and qualitative) criteria and
alternatives. Second, the expert does not provide
any numerical absolute judgement; instead a com-
parative evaluation is used, which is more familiar
to people.
Comparisons are recorded in a positive reciprocal
matrix, in which a
ij
represents the comparison be-
tween element i and j.
ApplyingtheAHPtoSmartMobilityServices:ACaseStudy
355

P =
1 a
1,2
··· a
1,n
a
ji
= 1/a
ij
1 ··· a
2,n
.
.
.
.
.
.
.
.
.
.
.
.
a
n,1
a
n,2
··· 1
The rationale of the relationship a
ji
= 1/a
ij
is
that if A is 4 times more important than B, then
B is 1/4 important with respect to A. Thus, if
the matrix is perfectly consistent, the transitivity
rule is satisfied for all the comparisons, namely
a
ij
= a
ik
· a
kj
. Intuitively, it is expected that if A
is moderate important (3) than B, and B is weak
important (2) than C, thus a consistent judgment
would have that A is 3 · 2 = 6 strong important
than C. One should observe that the inconsisten-
cies are natural in human judgments, for this rea-
son AHP supports the computing of the consis-
tency ratio (see (Saaty, 1977; Ishizaka and Labib,
2009) for more details). It was proved that in-
consistencies in answers can be tolerated if the
consistency ratio remains within a small interval,
that is 10%, see (Saaty, 1977; Ishizaka and Labib,
2009).
Synthesise Global Priorities. The last step requires
to synthesise the global priorities (i.e. the prior-
ity vector) from the pairwise comparisons to de-
termine the ranking of alternatives, taking into
account the stakeholders judgments as a whole.
Mathematically speaking, the priority vector is the
solution of an Eigenvalue problem over the ma-
trix previously introduced. The results of the pair-
wise comparisons are arranged in a matrix. The
first (dominant) normalised right Eigenvector of
the matrix gives the ratio scale (weighting) while
the Eigenvalue determines the consistency ratio.
2.1 AHP - Strong and Weak Points in
our Scenario
Here we report some strong points of AHP that make
it the best choice for our purposes.
First, it is flexible, intuitive and it derives ratio
scales from paired comparisons of criteria, thus allow-
ing small inconsistencies in judgments, as we speci-
fied above.
Second, since the problem is arranged into a hi-
erarchical structure, the importance of each element
becomes clear to whom will make the judgment, and
this facilitates the pairwise evaluation of criteria bear-
ing in mind different decision goal contexts.
Third, it has been implemented into an on-line
and free platform
3
as a supporting tool for decision
3
http://www.bpmsg.com/academic
making processes. There are however some criti-
cal points that one should address while using AHP.
First, while on the one side AHP allows combining
group judgments for obtaining a global one, on the
other side the use of aggregation function to combine
a high number of group judgments makes possible to
lose some relevant information. To stem this effect,
we identified three groups of stakeholders on the ba-
sis of their characteristics, namely Service-Providers,
users and young users. This would allow us hav-
ing a fine-grained analysis of the weighted criteria of
each group, as it will be clarified later. Furthermore,
another weak point of AHP relies on the number of
pairwise comparisons that grows exponentially in the
number of criteria to be evaluated. To avoid this, the
number of criteria have been carefully selected and
limited to 8 to prevent the stakeholders being over-
loaded of questions.
3 AHP FOR INNOVATING A
SMART-MOBILITY SERVICE
Figure 1 shows the AHP model we have built.
The criterion Accessibility and Usability focuses
on the (main) features that a smart transportation ser-
vice should provide to users. Thus, all its sub-criteria
have to be read by looking at a user-perspective, that
is: ”A user should be able to perform:”
Online Registration. Service/platform registration
doesn’t require going to a specific physical
location. Notice that this feature is far from
trivial, as some services require to meet the user,
to check her/his driving licence, and to get a
driving licence photo-copy.
Presence of Smart-card. The service-smart card is
used to access the service (e.g., car-sharing ser-
vices often uses smart-cards to recognise the user,
underground pass-card, etc).
E-ticket. Electronic tickets (e.g., mail, QR-code,
loading money to a card) can be used instead of
printed ones. This sub-criterion differs from the
previous one since in some cases a user may use
the smart-card but may not remotely load money
on it (e.g., access to physical totems is sometimes
required).
Onboard Travel Planner. It refers to the ability to
plan the route from my actual position to the de-
sired one, and this includes the proposition of sev-
eral routes to the user on the basis of both con-
gestion and user-preferences (e.g., minimise plan
time, number of transfers, walking meters, etc.)
DATA2015-4thInternationalConferenceonDataManagementTechnologiesandApplications
356
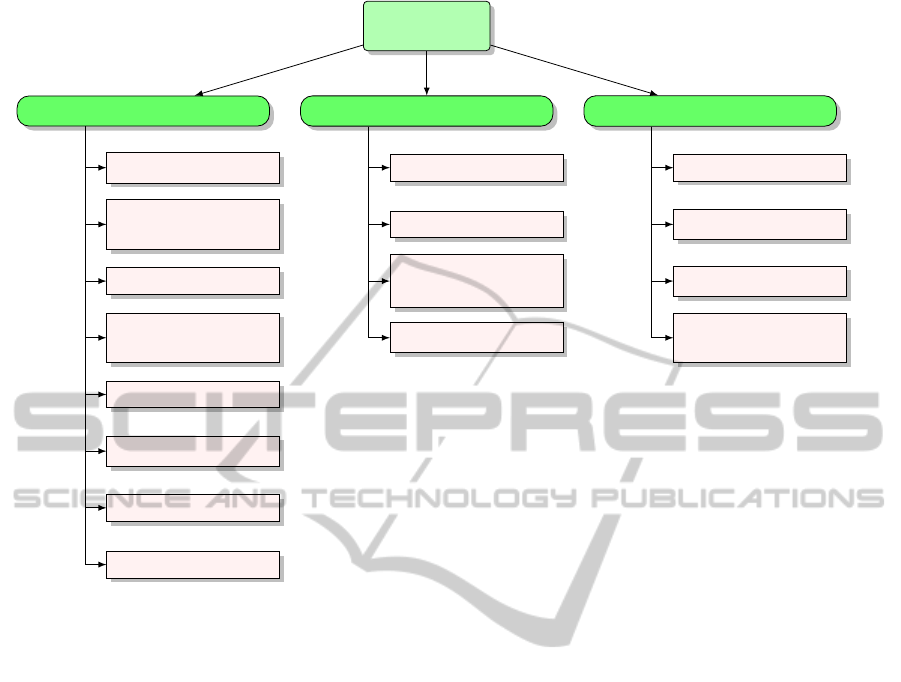
Research
Goal
Accessibility and Usability
User Engagement
Services Integration
Online Registration
Presence of Smart
Card
e-ticket
Onboad Travel
Planner
Self-Service
Online-Payment
Onboard Traffic Info
Online Traffic Info
WebSite
Newsletter
Social-Networks
Activity
Mobile-App
Extensiveness
Exchange
Integrated Ticket
Integrated News
Portal
Figure 1: The AHP model. Notice that the node Research Goal refers to ”which are the enabling factors for innovating a
smart-mobility service?”
Self-Service. Tickets can be autonomously pur-
chased, without any human intervention, indepen-
dently of the modality through which the purchase
is realised (e.g., through totems, website, Mobile-
App, etc.).
Online Payment. Deal with all the payment issues
through an online service. This includes recharg-
ing prepaid cards with money, to access the trans-
actions history, to download invoices, and to
add/remove credit-cards, too.
Onboard/Station Traffic Info. Service traffic and
network congestion information are provided
throughphysical devices, using e.g., screen within
the bus/train/car or informative totems placed in
the stations.
Online Traffic Info. Access to all service traffic
and network congestion information is provided
through Internet based services, namely Social-
Network, Websites, Mobile-Apps, etc.
The ”user engagement” criterion would identify
all the main channels that allows to engage the user.
For the sake of clarity we would clarify the meaning
of this term, as it is nowadays abused and it may be
misleading. Here the term engagement includes all
the instruments, services and tools that allows obtain-
ing ”a desirable - even essential - human response to
computer-mediated activities” (Laurel, 2013). In this
direction, we identified the following features that an
innovative smart-mobility service should have to en-
gage users: Web Site, Newsletter, intensive Social-
Networks Activities, and a Mobile-App. As the mean-
ing of these services are very common concepts, we
omit to specify each of them.
Finally, the Services Integration criterion has been
identified as it is strongly related to the concept of in-
termodality, that refers to the joint use of several (and
different) transportation services. Being able to re-
alise such a service actually represents a challenge in
the context of smart mobility where several operators
are involved. Within this criterion, we can distinguish
between the following sub-criteria.
Extensiveness. Here intended as the ability to cover
the whole city territory, Milan in such case. No-
tice that this information is intentionally quali-
tative rather than quantitative (i.e., no extension
measures or granularity information has been pro-
vided) to capture the expert’s opinion about the
importance of a full coverage when providing a
city smart-mobility service, in spite of its granu-
ApplyingtheAHPtoSmartMobilityServices:ACaseStudy
357

larity.
Exchange Between Services. To establish a geo-
graphical coordination among the mobility ser-
vices provided in the area, so that users can switch
between services easily and quickly.
Integrated Ticket. Being able to use the travel ticket
across several transportation services. This char-
acteristic becomes quite important in case of pub-
lic and private services integration. To give an ex-
ample, having one travel ticket that gives access
to all public transportation services (e.g., subway,
buses, trams, trains) and private ones (e.g., bikes,
car sharing) would really contribute in improving
and increasing the usage of smart-mobility ser-
vices within the City.
Integrated News Portal. Having a unified web-
portal that provides all the information about the
city transportation services is probably the most
(challenging) issue to be dealt. Clearly, this portal
would be easy to be realised by public operators
as they can straightforward include traffic news
on trains, subways, trains, buses etc. Conversely,
this is hard to be done by private operators, that
should exchange their information about cars and
bikes positioning as well as vehicles reservation.
Finally, merging both public and private opera-
tors into one informative service could be a re-
ally challenging task as because a permanent in-
formation exchange process should be established
among operators that might be competitors (e.g.,
the operators may lose users accesses to their own
platforms in favor of the integrated portal).
4 RESULT COMMENTS
Once the hierarchical model of criteria and sub-
criteria has been built, we can proceed through the
pairwise comparisons of each criteria and sub-criteria
as described in Sec. 2. To this end, we recruited three
distinct groups of mobility stakeholders, namely
Service-Providers
4
and users. The latter has been
split into two subgroups: under 35 years-old and
over 35 years-old. We compared the priorities
synthesised by the AHP process through the pairwise
comparisons for each sub-criterion of Fig. 1. The
results of each service-provide judgments are shown
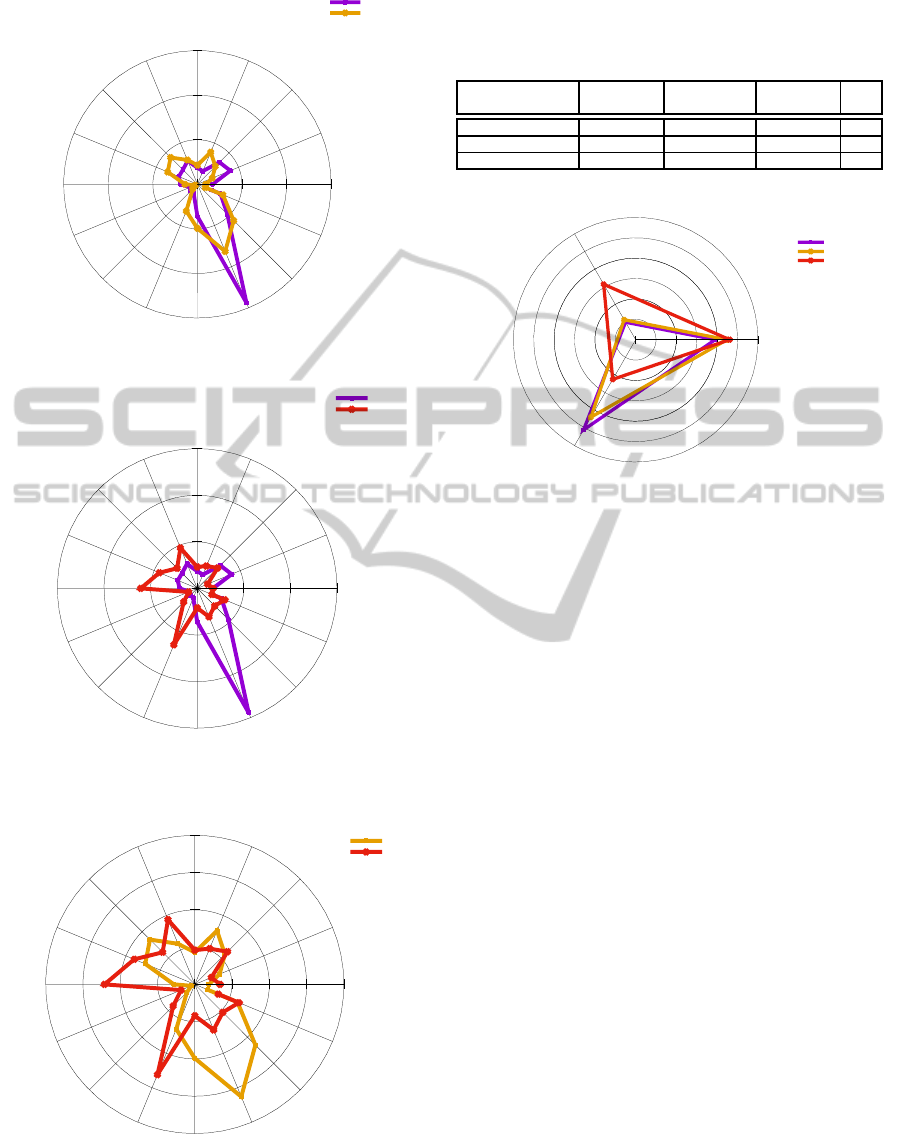
in Tab. 2. The results have been arranged into a series
of radar plots where the following can be observed:
4
This group is composed by stakeholders of mobility ser-
vices in Milan, that includes a subsidiary company, a public
agency, a private operator, and the Municipality of Milan
Service-providers vs Over 35. Figure 2(a) shows
the results for these two groups of stakeholders
showing that both Service Providers and Over
35 users agree in considering the Services Ex-
change as the most important factor for innovating
a smart-mobility service, but the relative weights
are quite different (i.e., 30% and 16% respec-
tively). The shapes depicted in Fig. 2(a) over-
lap for the great part, and this reveals these two
groups of stakeholders weight in a similar way all
these sub-criteria.
Service-providers vs Under 35. The Figure 2(b)
shows that the Under 35 users give to Services
Exchange less importance than MobileApp,
WebSite and Online Payment that represent
the sub-criteria of the User-engagement and
Accessibility and Usability. Here a gap - in terms
of point of views - emerges between these two
targets of stakeholders: while on one side Service
Providers and Over 35 users rank sub-criteria
similarly although with different weights, on the
other side the rank of criteria provided by Under
35 group diverges significantly. This result could
be explained by the age gap: considering the raw
judgments shown in Tab. 2, the service providers
group is mostly composed by people older than
35 years (namely, SC, A, and M in Tab. 2). Only
the Private service provider (P) is younger than
35 years, and its ranked sub-criteria are quite
similar to the ones belonging to the Under 35
cluster. This dynamic is highlighted by the radar
plot in Figure 2(c), where only the sub-criteria
weighted priorities of Under 35 and Over 35
users are provided.
Weighted Criteria. In Fig.3 we show a radar plot of
the weighted criteria for each group. Still in this
figure the age gap among groups can be used to
explain the different point of views on the im-
portance given to the enabling factors for inno-
vating smart-mobility services. Indeed, both ser-
vice providers and Over 35 users consider the Ser-
vice Integration criterion the most important fac-
tor for innovating a smart-mobility service, then
Accessibility and Usability account for the 44.8%
and 46.1% respectively while the User engage-
ment criterion seems to have a very low impor-
tance (about 10% for both). Conversely, the under
35 users give importance to Accessibility and Us-
ability then to the User Engagement and the Ser-
vice Integration criterion account only for 22%.
In Tab.1 we also report the relative weights that
each group assigned to each criterion, including the
average consensus reached amongst groups.
DATA2015-4thInternationalConferenceonDataManagementTechnologiesandApplications
358
0
10
20
30
0 10 20 30
0 10 20 30
Online Reg.
Smart
e-ticket
Onboard TP
Self-Service
Online-Paym.
Onboard Traffic Info
Oline Trattic Info
WebSite
NewsLetter
Social-Network
MobileApp
Extensiveness
Service Exchange
Integr. Ticket
Integr. NewsPortal
Service Providers
Over 35
(a) service providers vs Over 35 users sub-criteria
0
10
20
30
0 10 20 30
0 10 20 30
Online Reg.
Smart
e-ticket
Onboard TP
Self-Service
Online-Paym.
Onboard Traffic Info
Oline Trattic Info
WebSite
NewsLetter
Social-Network
MobileApp
Extensiveness
Service Exchange
Integr. Ticket
Integr. NewsPortal
Service Providers
Under 35
(b) service providers vs Under 35 users sub-criteria
0
5
10
15
20
0 5 10 15 20
0 5 10 15 20
Online Reg.
Smart
e-ticket
Onboard TP
Self-Service
Online-Paym.
Onboard Traffic Info
Oline Trattic Info
WebSite
NewsLetter
Social-Network
MobileApp
Extensiveness
Service Exchange
Integr. Ticket
Integr. NewsPortal
Over 35
Under 35
(c) Under 35 users vs Over 35 users sub-criteria
Figure 2: Sub-criteria pairwise-comparisons.
Table 1: Comparison of stakeholders’ priorities with respect
to the AHP criteria shown in Fig.1. Values in parenthesis
report the average consensus reached amongst each group
participant. All values are in percentage.
Groups Access. User Service CI
& Usab. Engagement Integration
Service-Providers 39 (49.1) 9.9 (43.7) 51.1 (52.9) 2.2
Users > 35 44.8 (58.5) 11.3 (81.8) 43.9 (62.2) 0.4
Users < 35 46.1 (52.8) 31.4 (75.9) 22.5 (70.5) 0.1
0 10 20 30 40 50 0 20 40 60
Accessibility
and Usability
User Engagement
Services Integration
Service Providers
Over 35
Under 35
Figure 3: Comparison of weighted criteria between groups.
For the sake of completeness, in Tab. 2 we provide
the results of the pairwise comparison for each group.
Notice that the AHP allows computing the overall
group results that would summarise the overall group
judgment for a set of criteria (or sub-criteria). Fur-
thermore, we recall that each comparison has ob-
tained a consistency index within the 10%, which is
considered as a limit for obtaining reliable and not
contradictory results (Saaty, 2003).
5 CONCLUSIONS
In this paper we reported our experience in apply-
ing a Multi Criteria Decision Making technique to
the smart-mobility context. Specifically, we built an
AHP model and we employed three distinct groups
of stakeholders (namely, Service Providers, Under 35
and Over 35 users) to rank the factors for innovat-
ing a smart-mobility service in city of Milan. The
outcome of the AHP is a hierarchy of criteria and
sub-criteria weighted accordingly to the stakehold-
ers preferences. Our outcomes reveal that both ser-
vice providers and over 35 groups preferences are
quite similar, as they both indicate Service Integra-
tion and Accessibility and Usability as the most im-
portant innovating factors while they give low im-
portance to the User Engagement. On the contrary,
for under 35 the Accessibility and Usability grows in
importance at the expense of the Service Integration,
ApplyingtheAHPtoSmartMobilityServices:ACaseStudy
359

Table 2: Results of the pairwise comparisons. SC = subsidiary company ; A = (public) Agency; P = Private Operator; M =
Municipality; U = User.
Cat. Part. Accessibility and Usability User Engagement Service Integration Cons.
Online Reg.
Smart Card
e-ticket
On-board TP
Self-Service
Online-Pay
On-board Traffic
On-line Traffic
Web-Site
News-letter
Social-Network
Mobile-App
Extens.
Exch.
Integ. Ticket
Integ. News Portal
CI
Service Providers
Group 3.4 8 7 3.2 3.7 5.7 4.6 4.5 3.8 1.8 2.1 2.2 7.2 28.8 9.5 5.6 4.1
SC 1.2 3.2 4.9 0.9 1.9 4.3 1.2 2.6 0.2 0.5 3.5 1.3 6.3 47.3 18.1 2.5 10.1
A 1.1 2.8 1.8 3.3 5.7 1.4 7.4 4.3 5.1 1.3 0.3 0.6 2.6 40.4 6 15.8 6.4
P 12.3 9.8 1.9 4 1 6.4 2.6 2.2 6.6 1.6 3.6 8.2 3 17 10 10 0.6
M 4.5 15.2 22.8 2.2 5.8 4.9 11.3 1.6 5.1 1.6 0.9 0.6 15.3 5.8 1.7 0.8 6.2
Users over 35
Group 1.9 3.6 5.7 7.8 4.3 5.9 8.5 7.2 2.8 0.5 1.5 6.5 9.9 16.3 11.5 6.2 1.8
U 6.4 1.3 1.7 11.4 0.6 1.3 16.1 8.4 1.6 0.2 0.6 2.9 18 19.4 3.2 6.7 4.5
U 1 3.7 1.2 4.6 2.5 1 6.2 6.1 13.7 1.5 5 34.4 3.5 10.5 3.5 1.4 2.1
U 11.8 8.7 6.5 2.8 4 16 1.8 17 1.3 0.4 3.2 3.2 7.1 2.5 1.6 12.2 8.6
U 0.6 1.4 0.3 4.4 1.4 1.5 5.6 2.6 3.5 0.2 0.6 1.6 5.9 22.9 44.6 2.9 6.5
U 0.3 0.9 1.8 2.7 0.9 3.7 2.1 1.8 3.1 1.4 6.4 17.6 4.9 18.5 24.2 9.5 1.3
U 1.8 3.1 4.8 8.5 10.8 3.3 13.3 1.1 1.3 0.3 0.5 4.5 5.4 28.5 11 1.8 2.2
U 0.9 5.3 11.1 8.8 11.3 6.7 9.3 4 1.3 0.2 0.5 4.5 3.7 12.5 8.2 11.7 3.5
U 1.7 1.1 14.2 5.7 4.1 11.9 17.1 14.5 4.2 0.3 0.4 2.4 6.9 9.5 5.4 0.8 1.4
U 1.4 13.5 6.7 7 15.8 4.6 10.9 2.6 3.8 0.6 1.7 7.6 9.3 9.6 3.1 1.9 0.4
U 0.6 1.2 3.7 6.5 0.6 3.6 1.5 7.9 1.9 0.4 0.6 7.6 17.3 7 5.1 34.4 4.7
U 1.3 7.4 4.9 4.3 12.8 19 2.9 19.5 2.1 0.4 0.4 4.4 11.5 2.5 4.9 1.5 3
U 0.3 0.7 9.6 2.6 0.5 1.9 3 2.5 0.5 0.2 2.3 2.3 2.3 18.1 47.8 5.5 8.7
Users under 35
Group 3.4 2.4 6.2 5.2 4.6 9.4 6.1 8.8 12.1 2 4.1 13.1 4.2 6.6 5.3 6.4 1
U 5.9 1.9 12.5 1.7 3.9 15.1 1.9 26.8 2.1 0.2 2.1 2.1 3.7 3.7 5.6 10.8 2.3
U 1.5 2.9 2.3 5.3 6.4 3.5 18.7 13.4 17.3 6.9 2 3.6 4.4 7.8 1.1 3 1.5
U 0.5 0.4 2.3 2.4 1.9 2 2.4 2.4 13 3.2 16.9 24 3.2 6.3 6.3 12.7 0
U 5 1.6 13.7 1.4 1.6 21.5 1.3 3.8 7 1.7 5.6 25.3 1.6 0.8 1 7.1 2.6
U 6.8 1.7 3.4 3.2 7.5 20.2 4.1 3.9 9.7 1.5 4 22.7 4.8 1.4 0.7 4.4 1
U 2.4 1.1 1.8 9.3 1.4 3.9 13.1 12.8 15.6 2.7 1.1 2.7 1.7 7.6 12.2 10.4 1.7
U 2.5 4.8 2.5 1.2 1 6.9 1.8 0.5 45 2.2 7.4 15.8 0.9 4.8 2.3 0.4 5.8
U 2.6 1.4 1.2 8.7 2.8 1.8 12.7 8.7 3.9 0.8 5.7 9.6 13.3 12.3 10 4.4 2.2
U 1.1 2.2 21.2 12.6 2.6 7.3 3.5 5.2 4.9 0.6 1.5 5.1 2.7 13.1 11.3 4.8 1.5
U 3.2 1.2 9.6 2.8 4.8 14.5 0.9 7.5 14.2 2.2 2.3 30.2 2.2 1.1 2.9 0.6 1.1
U 1.3 1.4 2.2 3.1 6.2 1.9 7.5 7.6 5.3 0.8 0.8 12.6 3.2 16 8.6 21.5 2.5
whilst the User Engagement criterion becomes quite
important (30%) for them. Concluding, this knowl-
edge could strongly integrate and support sense mak-
ing from large amount of data collected about smart-
mobility service usage, and it describes the dynamics
that guide the stakeholder decision. In our opinion,
using this knowledge with common BI analytics (such
as service usage patterns identification, forecasting,
process mining, etc.) could be beneficial for improv-
ing service effectiveness.
REFERENCES
Abdi, M. R. and Labib, A. W. (2003). A design strat-
egy for reconfigurable manufacturing systems (rmss)
using analytical hierarchical process (ahp): a case
study. International Journal of Production Research,
41(10):2273–2299.
Bello-Dambatta, A., Farmani, R., Javadi, A., and Evans,
B. (2009). The analytical hierarchy process for con-
taminated land management. Advanced Engineering
Informatics, 23(4):433 – 441. Civil Engineering In-
formatics.
Chen, S.-J. J., Hwang, C.-L., Beckmann, M. J., and Krelle,
W. (1992). Fuzzy multiple attribute decision making:
methods and applications. Springer-Verlag New York,
Inc.
Figueira, J., Greco, S., and Ehrgott, M. (2005a). Multiple
criteria decision analysis: state of the art surveys, vol-
ume 78. Springer Science & Business Media.
Figueira, J., Mousseau, V., and Roy, B. (2005b). Electre
methods.
Ishizaka, A. and Labib, A. (2009). Analytic hierarchy pro-
cess and expert choice: Benefits and limitations. OR
Insights, 22(4):201–220.
Laurel, B. (2013). Computers as theatre. Addison-Wesley.
Madas, M. A. and Zografos, K. G. (2008). Airport ca-
pacity vs. demand: Mismatch or mismanagement?
DATA2015-4thInternationalConferenceonDataManagementTechnologiesandApplications
360

Transportation Research Part A: Policy and Practice,
42(1):203 – 226.
Manville, C., Cochrane, G., Cave, J., Millard, J., Ped-
erson, J. K., Thaarup, R. K., Liebe, A., Wiss-
ner, M., Massink, R., and Kotterink, B. (2014).
Mapping smart cities in the eu. available at:
www.europarl.europa.eu/studies.
Nam, T. and Pardo, T. A. (2011). Conceptualizing smart
city with dimensions of technology, people, and in-
stitutions. In Proceedings of the 12th Annual Inter-
national Digital Government Research Conference:
Digital Government Innovation in Challenging Times,
pages 282–291. ACM.
Saaty, T. L. (1977). A scaling method for priorities in hier-
archical structures. Journal of mathematical psychol-
ogy, 15(3):234–281.
Saaty, T. L. (1988). What is the analytic hierarchy process?
Springer.
Saaty, T. L. (1990). How to make a decision: the analytic
hierarchy process. European journal of operational
research, 48(1):9–26.
Saaty, T. L. (2003). Decision-making with the ahp: Why is
the principal eigenvector necessary. European journal
of operational research, 145(1):85–91.
Saaty, T. L. (2004). Fundamentals of the analytic network
processmultiple networks with benefits, costs, oppor-
tunities and risks. journal of systems science and sys-
tems engineering, 13(3):348–379.
Tadi´c, S., Zeˇcevi´c, S., and Krsti´c, M. (2014). A novel hybrid
mcdm model based on fuzzy dematel, fuzzy anp and
fuzzy vikor for city logistics concept selection. Expert
Systems with Applications, 41(18):8112–8128.
Wu, W.-W. and Lee, Y.-T. (2007). Selecting knowledge
management strategies by using the analytic network
process. Expert systems with Applications, 32(3):841–
847.
Yoon, K. P. and Hwang, C.-L. (1995). Multiple attribute
decision making: an introduction, volume 104. Sage
Publications.
ApplyingtheAHPtoSmartMobilityServices:ACaseStudy
361
