
A UML KPI Profile for Energy Aware Design
and Monitoring of Cloud Services
Christophe Ponsard and Jean-Christophe Deprez
CETIC Research Centre, rue des Fr
`
eres Wright 29/3, Charleroi, Belgium
Keywords:
Energy Efficiency, Cloud, Sustainability, Green-IT, UML.
Abstract:
ICT energy efficiency is a growing concern. Large effort has already been spent making hardware energy
aware and improving hardware energy efficiency. Although effort is devoted to specific software areas like
embedded/mobile systems, much remains to be done at software level, especially for applications deployed
in the Cloud. In order to help Cloud application developers to learn to reason about how much energy is
consumed by their application on the server-side, we propose a framework composed of (1) a Goal-Question-
Metric analysis of energy goals, (2) a UML profile for relating energy requirements and associated KPI metrics
to application design and deployment elements, and (3) an automated Cloud deployment of energy probes able
to monitor those KPI and aggregate them back to questions and goals. The focus of this short paper is on the
development of the UML profile. We detail the profile metamodel design and its implementation based on the
Open Source Papyrus modeller. We also report about the application of our profile to a case study.
1 INTRODUCTION
ICT expansion both at professional and personal lev-
els induces increasingly larger amounts of data ex-
changed (high resolution pictures, videos) and pro-
cessed (Big Data), increasing connectivity of all de-
vices (mobile devices, Internet of Things) and higher
penetration (on business domains, emerging coun-
tries). This evolution raises the energy required to run
ICT to a level that would be dramatic if ICT energy ef-
ficiency was not improving simultaneously. Between
2007 and 2012, global ICT consumption raised from
3.4% to 4.6% of the overall energy consumption and
the ratio for data centres also grew from 1% to 1.3%
of the global energy consumption hence a 30% in-
crease (Internet Science NoE, 2013)
A reason for the slower increase between 2007
and 2012 is the use of more efficient hardware. Virtu-
alisation techniques also enable data centres to oper-
ate hardware at higher load. The average Power Us-
age Effectiveness (PUE) metric of data centers cur-
rently ranges from from 1.7 to 1.1 for the most ef-
ficient ones. This metric compares the amount of
energy spent by servers against the overall energy
consumed by the whole infrastructure, thus the best
theoretical PUE measurement is 1.0. In order to
reach another level of energy saving, it is now re-
quired to consider the software layer. While sev-
eral initiatives have already studied how to reduce en-
ergy consumption of mobile or embedded devices, lit-
tle has been done for improving the energy perfor-
mance of the service-side computation part of appli-
cation, in particular, in the context of Cloud comput-
ing. To bootstrap the process of energy based pric-
ing model for Cloud service at infrastructure, plat-
form or application level, it is necessary to develop
a Cloud stack capable to record energy consumption
at each layer and to facilitate negotiations between a
customer and a provider where energy consumption
is one of the factors. In a second step, self-adaptation
capabilities in the Cloud stack middleware or in the
Cloud applications can then enable dynamic energy
savings. Tools are also needed to help development
teams to learn how their applications consumes en-
ergy and how to refactor these applications to achieve
additional energy savings. These development tools
must therefore encompass all development phases in-
cluding requirements, design, workload testing, and
deployment. Work in this direction is actively pro-
gressing in the scope of several EU projects, e.g.
(ASCETIC, 2013), (ECO2Cloud, 2012), or (ENTRA,
2013).
Assuming such an energy-aware stack is avail-
able, it is necessary to help developers to learn how
much energy is consumed by their application on
the server-side. Unlike certain performance or se-
432
Ponsard C. and Deprez J..
A UML KPI Profile for Energy Aware Design and Monitoring of Cloud Services.
DOI: 10.5220/0005564004320437
In Proceedings of the 10th International Conference on Software Engineering and Applications (ICSOFT-EA-2015), pages 432-437
ISBN: 978-989-758-114-4
Copyright
c
2015 SCITEPRESS (Science and Technology Publications, Lda.)

curity characteristics already understood by users and
developers, energy consumption behavior of server-
side components is often completely unknown. Rare
are those who could state quantifiable requirements
on the energy consumption behavior on the server-
side of particular features of their application. The
aim of this paper is to provide the developer with tools
that will ease the following key steps to move to an
energy-aware cloud application development:
At Requirements Level - To structure the ap-
proach, the Goal-Question-Metric (GQM) paradigm
is used (Basili et al., 1994). In particular, it can be
used to propose generic goals and questions that de-
velopers will often want answers to in order to gain a
more precise knowledge of the energy consumed by
various features or components of their application. It
also makes the link with a number of already identi-
fied energy-related metrics (Bozzelli et al., 2013).
At Design Level - To capture the information on
how to measure energy consumption of a feature or
component in a way that follows the traditional mod-
elling approach used by analysts and eases further
processing, the design model language must be aug-
mented with annotations to connect design element
to energy requirements (goals and questions). This
will enable the automated deployment of measure-
ment probes to monitor the specified KPI and report
them in terms of the questions and goals of the GQM
identified at requirements level. This short paper tar-
gets more specifically this step.
At Runtime Level - Probes collect the specified
data and report them to a monitoring infrastructure
part of the energy-aware Cloud stack. This monitor-
ing itself is efficient in terms of data collection strat-
egy (frequency of sampling, data transmission, data
aggregation). Application monitoring occurs at the
SaaS level but relies on data from the lower PaaS and
IaaS layers, for example, for collecting Watt-hour of
a blade or CPU percentage time of a process running
in a virtual machine (VM).
For easing adoption by developers, it is also very
important to propose a practical tool that will seam-
lessly integrate with current development habits and
mainstream development environments. In this re-
spect the Unified Modelling Language (UML) is now
universally known by developers and supported by
development environments (OMG, 1997). Standard
extensions mechanisms, based on stereotypes, are
available to enrich the existing diagramming nota-
tions, in our case with energy-related information.
Such approaches have been quite successful in the
past, e.g. the MARTE profile for embedded systems
(OMG, 2009). The profile can be ”plugged” into an
existing model of a target application. If no model ex-
ists, a simplified energy-oriented model can be built
only for the concerned part of the application. It
will naturally help to capture all the relevant energy-
related elements and in a possible later step be used
as a basis to drive the application refactoring. In this
short article, we present a UML-based approach simi-
lar to the one followed by MARTE, but applied to en-
ergy related requirements and design decisions. Our
work is structured as follows. Section 2 details the
design of the profile by explaining its meta-model. It
shows how energy goals and questions are captured
and how to add design annotations to specify energy
consumption measurements able to answer the given
questions. It also presents a reference implementa-
tion. Section 3 illustrates the profile applied to a Photo
Album web-application. Section 4 discusses some re-
lated work. Finally, section 5 draws some conclu-
sions about our experience so far and identifies further
work.
2 PROFILE DESIGN
To gather energy requirements, the design annotation
and mapping with deployment time probes, we aug-
mented UML with two stereotypes at different level of
granularity. A first stereotype, preparedForMeasure-
ment, provides information to prepare a UML model
for a measurement session while a second stereotype,
forMeasurement, provides information on each appli-
cation elements relevant to measure (e.g. a method,
a class, a deployment element such as a service, a
VM,...). The definition of those two stereotypes also
relies on a number of auxiliary DataTypes and Enu-
merations. In the rest of this section, we will use italic
font to refer to concepts in the metamodel diagrams.
2.1 Stereotype for Measurement Session
The preparedForMeasurement stereotype is used to
specify global information related to monitoring
goals. It is depicted in Figure 1 Users can provide
general information on a model for specifying mon-
itoring needs. Notably, Information provided at the
model level relate to
1. the explicit specification of MonitoringGoal and
associated QualityQuestions to answer. Stereo-
typed KPI modeled by user will then have to ex-
plicitly identify and define the questions (Ques-
tionID and QuestionText) they help to answer.
2. a set of information (GlobalNPIDefInput) to de-
fine globally:
AUMLKPIProfileforEnergyAwareDesignandMonitoringofCloudServices
433
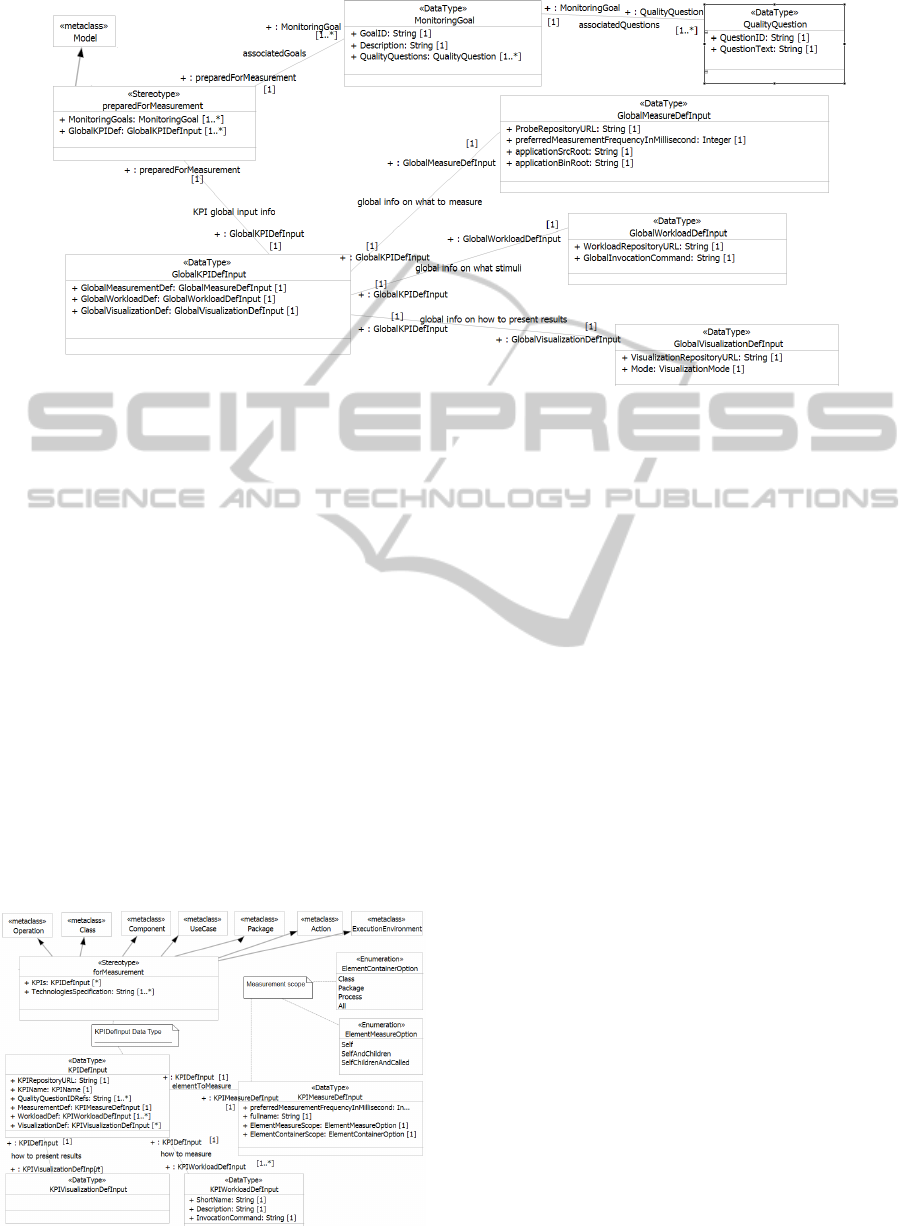
Figure 1: Meta-model - Goal-Questions-Metrics.
• measures: global repository where probing in-
formation are found,
• workload: global repository where invocation
commands to exercise workloads on the appli-
cation are found,
• visualisation: global repository where visuali-
sation information are found.
The information location is implementation inde-
pendent but a URL to some configuration reposi-
tory is expected, e.g. (Chef, 2009).
2.2 Stereotype for Measured Element
The forMeasurement stereotype can be attached to an
UML element on which measurement can be con-
ducted (statically or dynamically). The top of fig-
ure 2 shows the standard UML element to which it
can be attached (operation, class, component, etc). To
address the need of dynamic measurements for those
Figure 2: Meta-model - KPI and Visualisation.
type of elements, it is necessary to define the forMea-
surement facet which is mainly composed of a list
of KPI definition and some technology specific infor-
mation that will be useful at deployment time. Each
KPI associated to a UML element is captured by the
KPIDefInput. In addition to a identifying KPIName
and KPIRepositoryURL, it contains a link to relevant
questions it addresses (at least one) and the following
defining fields:
• MeasurementDef (mandatory): defines on what to
perform the measurement as KPIMeasureDefIn-
put. This scope can be finely specified using
strategies related to the container level (package,
class, method, process,...) or inheritance/call level
(self, self+children, self+children+called)
• WorkloadDef information (mandatory): needed
to conduct dynamic test sessions on an execution
environment to capture the desired measurement
for relevant workload categories, defined using
the KPIWorkloadDefInput.
• VisualizationDef data (optional): to further pre-
cise dashboards and other visualization widgets
useful to present and to interpret measurement re-
sults. Note it is optional because all required in-
formation may already be present in the global
GlobalVisualizationDefInput.
2.3 Reference Implementation
Our reference implementation was developed on Pa-
pyrus, an Open Source Eclipse-based UML tool
(Eclipse Foundation, 2007). Papyrus supports the def-
inition of profiles through . pro f ile projects that can
be specified with the tool itself. They can then be
ICSOFT-EA2015-10thInternationalConferenceonSoftwareEngineeringandApplications
434
applied to normal UML projects which will then ben-
efit from the specified extension. Papyrus automat-
ically generates all the input forms required to cap-
tures the structured and typed information specified
in the profile. Subsequently, different query technolo-
gies can be used to retrieve the energy-related infor-
mation encoded in an instantiated model. In our ref-
erence implementation, we used (Eclipse Foundation,
2006) which provides a nice declarative language to
transform the source UML model into some target
such as the monitoring deployment descriptor in an
OVF format for instance. Finally, the visualisation
and reporting currently rely on (BIRT, 2005).
3 PHOTO ALBUM CASE STUDY
3.1 Case Study Description
Photo Album is a 3-tier web application that is de-
signed to be desktop-like on-line photo manager (Tse-
bro et al., 2009). It provides social services for up-
loading photos, storing and previewing them, creating
albums and sharing them with other users. The visu-
alisation layer is implemented in JavaScript while the
business logic in Java runs on the server-side and a
database for storing issue data can run on the same
server or on a different machine. It is very representa-
tive of applications that can be deployed in SaaS mode
on a Cloud and that can benefit of the PaaS and IaaS
layers elasticity/reconfigurability features.
3.2 GQM Energy Analysis
We restrict ourselves to a simple goal together with
related questions as described in Table 1. Those el-
ements are encoded into a preparedForMeasurement
entry which is directly attached the to the Photo Al-
bum UML design project.
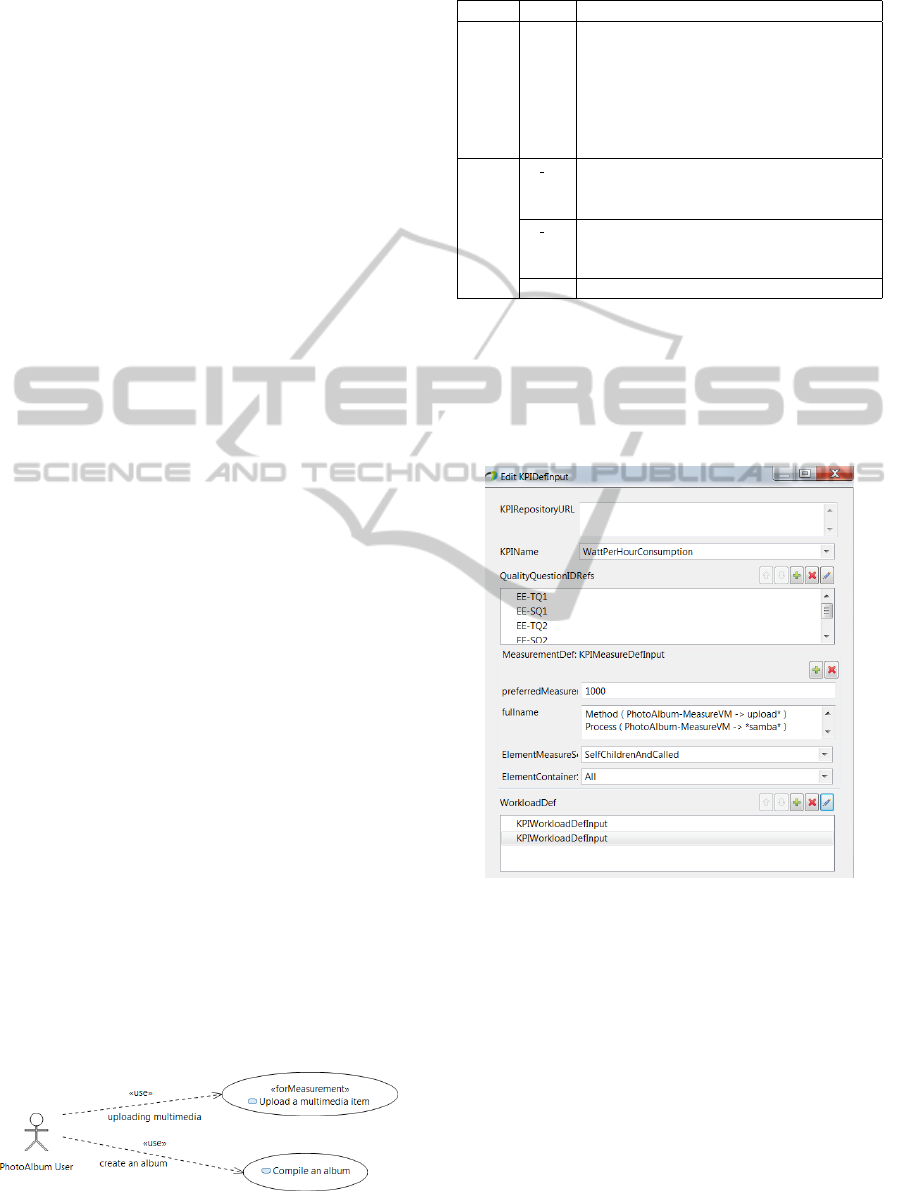
3.3 Use Case Annotation
The UML Use Case diagram is the simplest to use
because it easily relates to business level services typ-
ically in the application server. Figure 3 shows the
two identified features of our GQM analysis.
Figure 3: Annotated Use Case for the Photo Album.
Table 1: Goal and question definition for the Photo Album.
Type ID Description
Goal EE Study the impact of executing the following features
and components of Photo Album on the energy con-
sumption to determine if a refactoring effort is worth
undertaking:
• Upload a multimedia item in an album
• Compile an album
Questions EE TQ1 What is the overall energy consumed when exercis-
ing the given feature or component for each workload
category?
EE SQ1 How does the energy consumed every second varies
when exercising the given feature or component for
each workload category?
... ...
The first use case Upload a multimedia item is an-
notated with a forMeasurement stereotype. This was
done using the KPIDefInput partly shown in Figure 4.
It is worth noting that such appropriate dialogue win-
dows are automatically generated by Papyrus from in-
formation described in the meta-model.
Figure 4: KPI Definition for photo upload.
For the PhotoAlbum Use Case, the recommended
measurement strategy is coarse grained, i.e. measur-
ing all the contained elements and following both the
inheritance and call graphs. Note that the fullName
field can accept a specific language for specifying the
deployment target to monitor with some facilities like
regular expression. It is used to specify a upload
entry-point method and a samba process performing
the file upload.
AUMLKPIProfileforEnergyAwareDesignandMonitoringofCloudServices
435
3.4 Deployment Annotations and
Monitoring Process
Figure 5 shows a deployment view. It should nor-
mally only show the photo album related VM, i.e. the
application VM PA-APP-VM and the database VM)
PA-BD-VM along side the Test VM is used to inject
specific workloads in a controlled way on the applica-
tion under energy monitoring. However, to give some
insight on the monitoring process, Figure 5 also rep-
resents the infrastructure VMs managing the energy
monitoring: the SaaS Modelling VM offers developer
front-end tools such as Papyrus, aggregation, report-
ing and visualisation tools and the PaaS Infrastructure
VM runs a global efficient monitoring service.
Regarding the deployment process, information
for generating the probe descriptor and the test load
specification is extracted from the UML model using
Acceleo. Those elements are then passed respectively
to the probe deployment and load generator services.
Beside application features of components, as il-
lustrated earlier, a UML model can also use annotated
application VMs with forMeasurement information,
for example to capture VM level monitoring and mea-
sure the impact of specific Cloud architectural com-
ponents, in our case, it could be used to determine
the energy consumption of a load balancer which dis-
tributes the load to keep good response times and
therefore identify explicitly a time-energy trade-off
that could take place.
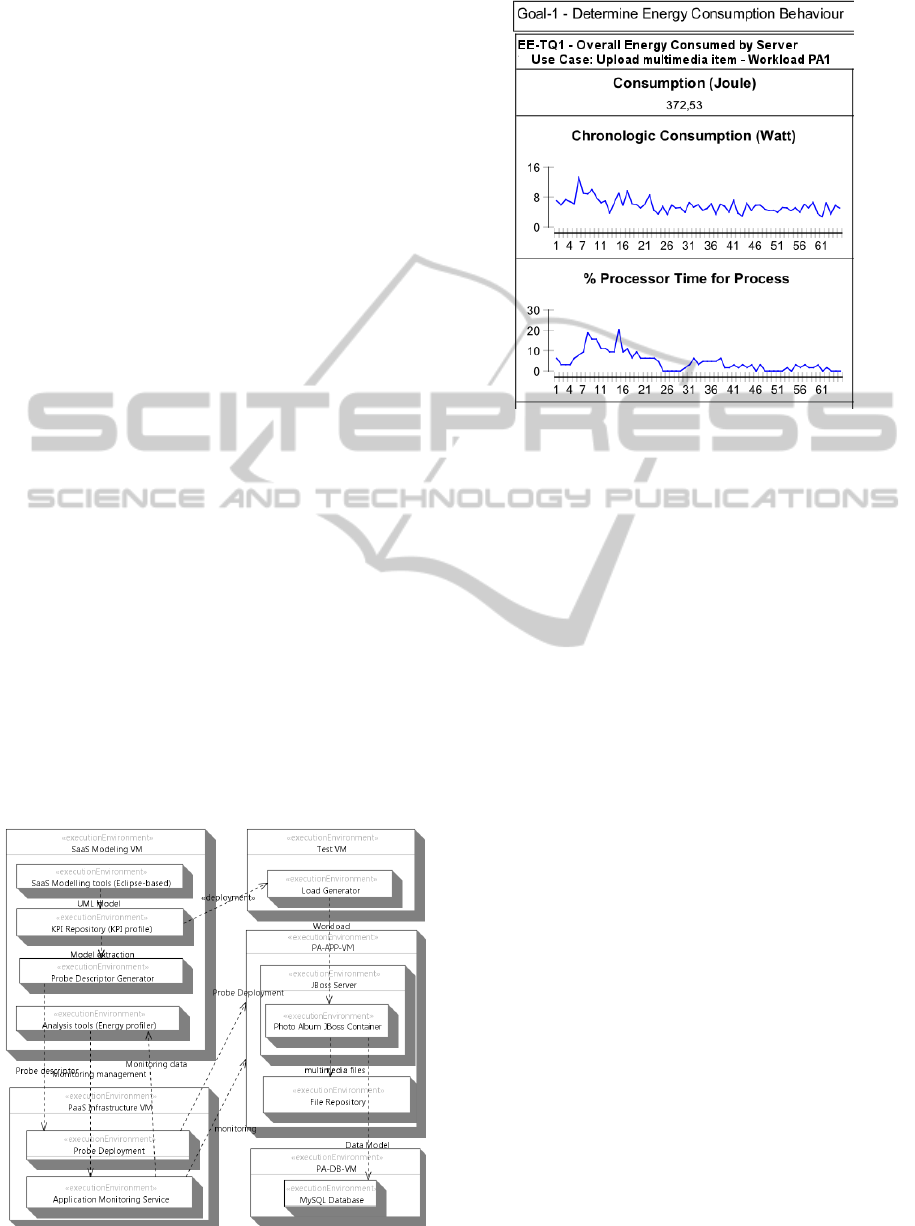
3.5 Reporting the Results
Figure 6 shows a typical report generated from BIRT.
It shows historical data gathered from the monitor-
Figure 5: Deployment View.
Figure 6: Reporting at KPI level (partial).
ing service on virtualised components such as CPU,
IO, memory access. Those are transparently trans-
lated into Watt history and total Joule consumption
based on an energy model. The link with the re-
lated question and goal is also reported. The data can
then be analysed, for example to correlate the Watt
consumption with some element (CPU, network ac-
cess...) and/or some specific load event. Based on
this measurement information, bottlenecks could be
identified and improvements to a specific service or
more globally to an architecture refactoring can be
triggered.
4 RELATED WORK
As already mentioned, much work has been devoted
to energy efficiency in the embedded domain given
the limited resource available. The MARTE profile is
capturing a lot of resource categories, including en-
ergy (OMG, 2009). In a SysML context, they can
be related to requirements however the profile does
not support our richer traceability to KPI and based
on a systematic GQM approach. Further extensions
dealing more specifically with energy have been de-
veloped (Shorin and Zimmermann, 2013). Their aim
is more directed towards design time energy estima-
tion rather than runtime monitoring and evolution as
ours.
Concerning energy requirements and goals, there
is little room for them in the current analysis frame-
work: standards structuring non-functional require-
ments like the ISO2910 and even the more recent
SQuaRE essentially captures them from a perfor-
ICSOFT-EA2015-10thInternationalConferenceonSoftwareEngineeringandApplications
436

mance efficiency point of view and do not enable any
reasoning on them. As pointed by a Microsoft report,
most of the time energy consideration are simply not
present in software specifications except for specific
systems like embedded sytems and fail to address fun-
damental issues such as the available power budget,
the impact of energy in the selection of a specific de-
sign, or the resolution of conflicts with other require-
ments. At organisation level, the situation is different
with a current trends to help organisation in their en-
ergy management strategies, for example using goal-
oriented techniques (Stefan et al., 2011). Although
this work seems farther away from the context pre-
sented in this article, the framework presented could
well be used to collect measurement data needed as
evidence for compliance to (ISO 50001, 2011) on En-
ergy Management.
5 CONCLUSIONS AND FUTURE
WORK
In this short paper, we presented a UML profile for
the energy-aware design of Cloud application both in
relation with a well defined energy management strat-
egy defined in terms of goals and questions but also
in relation with well-defined and monitorable KPI.
We illustrated our work on a typical 3-tier applica-
tion. So far, we were able to perform some partial
deployment and data collection experiments on a re-
alistic case study. Although those are not yet fully
automated, we could perform an aggregation of the
collected data as measure of KPI satisfaction and link
it to the question and goal levels.
We are currently validating our KPI profile on
a large real world application: a end-to end mul-
timedia cross-channel solution for sharing informa-
tion across news agencies, broadcasters and publish-
ers (ATC, 2014). This case study will allow us to
better evaluate the ability of our KPI profile to cap-
ture all the energy-relevant aspects, especially going
beyond CPU consumption, e.g. communication and
storage. From there, we will also be able to reason
on some possible design trade-offs. We also plan to
improve the automation of probe deployment and for-
malise some part of the profile in order to provide easy
mapping on popular automation frameworks such as
Chef. Concerning the reporting, we will replace our
current static BIRT-based prototype by a more inter-
active web-based framework that will ease our anal-
ysis. A later step will be to further enrich our profile
with self-adaptation strategies than can preserve en-
ergy goals even when the execution context is evolv-
ing due to evolution in load, network throughput, in-
frastructure costs, etc.
ACKNOWLEDGEMENTS
This work was partly funded by the European Com-
mission under the FP7 ASCETiC project (nr 610874).
Many thanks to the ASCETiC partners for their feed-
back and support.
REFERENCES
ASCETIC (2013). Adapting Service lifeCycle towards Ef-
ficienT Clouds. http://www.ascetic.eu.
ATC (2014). Newsasset Suite - An end-to-end multimedia
cross-channel publishing for an evolving Media Orga-
nization. http://www.atc.gr.
Basili, V. R., Caldiera, G., and Rombach, D. H. (1994). The
Goal Question Metric Approach, volume I. John Wi-
ley & Sons.
BIRT (2005). Business Intelligence and Reporting Tool.
http://eclipse.org/birt.
Bozzelli, P., Gu, Q., and Lago, P. (2013). A systematic
literature review on green software metrics. Technical
report, Technical Report: VU University Amsterdam.
Chef (2009). Infrastructure as Code. https://www.chef.io/
chef.
Eclipse Foundation (2006). Acceleo, a pragmatic
MOF Model to Text Language Implementation.
http://www.eclipse.org/acceleo.
Eclipse Foundation (2007). Papyrus Graphical editing tool
for UML2. http://www.eclipse.org/papyrus.
ECO2Cloud (2012). Experimental Awareness of CO2 in
Federated Cloud Sourcing. http://eco2clouds.eu.
ENTRA (2013). Whole-Systems ENergy TRAnsparency.
http://entraproject.eu/.
Internet Science NoE (2013). D8.1. Overview of ICT en-
ergy consumption. http://www.internet-science.eu.
ISO 50001 (2011). Energy Management. http://
www.iso.org.
OMG (1997). Unified Modeling Language. http://
www.omg.org/spec/UML.
OMG (2009). The UML Profile for MARTE: Modeling
and Analysis of Real-Time and Embedded Systems.
http://www.omgmarte.org.
Shorin, D. and Zimmermann, A. (2013). Evaluation of em-
bedded system energy usage with extended uml mod-
els. Softwaretechnik-Trends, 33(2).
Stefan, D., Letier, E., Barrett, M., and Stella-Sawicki, M.
(2011). Goal-oriented system modelling for managing
environmental sustainability. In 3rd Int. Workshop on
Software Research and Climate Change.
Tsebro, A., Mukhina, S., Galkin, G., and Sorokin, M.
(2009). Rich faces photo album application. http://
docs.jboss.org/richfaces/latest 3 3 X/en/realworld/
html single.
AUMLKPIProfileforEnergyAwareDesignandMonitoringofCloudServices
437
