Simulations and Optimization of Manufacturing of Automotive Parts
Lukasz Rauch, Monika Pernach, Jan Kusiak and Maciej Pietrzyk
AGH University of Science and Technology, al. Mickiewicza 30, 30-059, Krakow, Poland
Keywords: Computing Costs, DP Steels, Simulation of Manufacturing, Car Body Part.
Abstract: Fast progress in modeling of metal processing encourage researchers to look for better technologies, which
can be done through optimization of their design. Authors have developed the computer system ManuOpti
for optimization of manufacturing chains based on materials processing. Application of this system to
simulations and optimization of manufacturing of automotive parts was the general objective of the paper.
ManuOpti software enables performing optimization by the user with little experience in the computer
science and in the optimization methods. On the other hand, the application of the optimization techniques
is efficient only when reliable material models and accurate numerical methods are applied. Therefore,
validation of models describing microstructure evolution in automotive steel (Dual Phase – DP) was the
next objective of the paper. Physical simulations of thermal cycles were performed and the experimental
results were used to validate the model. Numerical tests with the ManuOpti system recapitulate the paper.
Case studies for the tests included various thermal cycles of the continuous annealing of DP steels.
1 INTRODUCTION
Fast progress in modeling of metal processing is
observed and multi physics models are commonly
applied in simulation of material behavior.
Combined thermal-mechanical-thermodynamic
models are used to account directly for the
microstructural features of the material, as it is
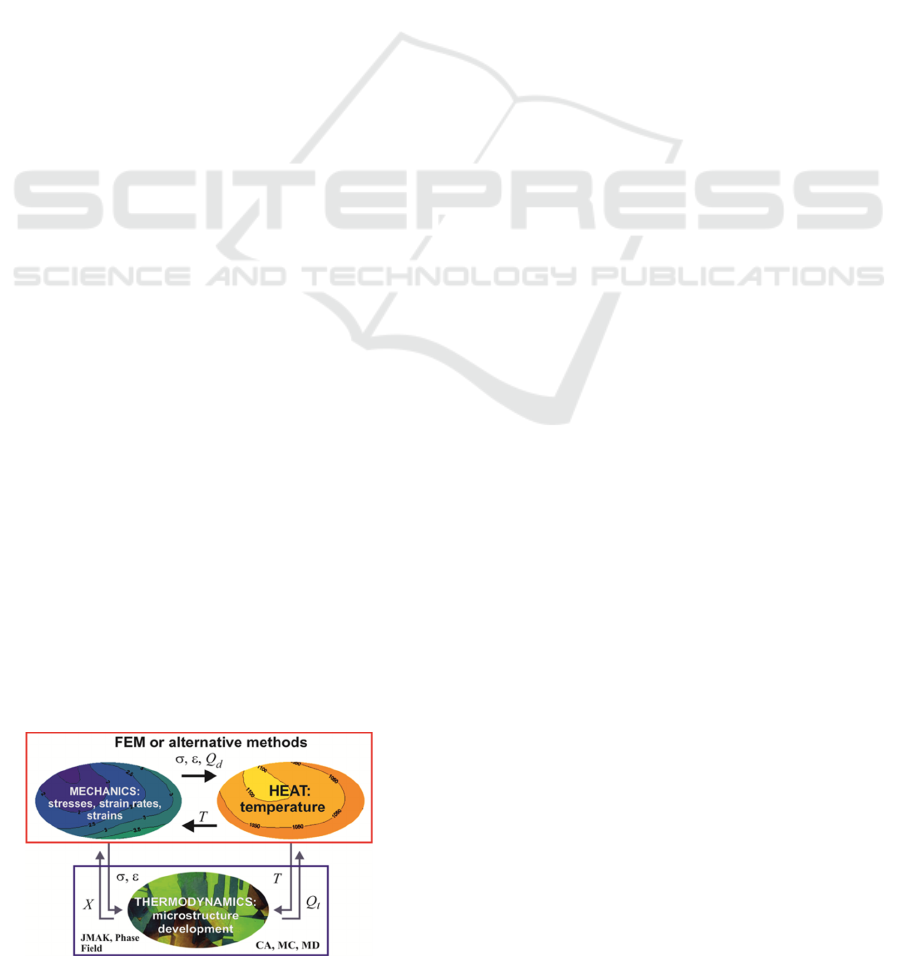
shown schematically in Figure 1. Prediction of
micro-structure and properties of products became
an inseparable part of simulations and these
parameters are often used in objective functions in
optimization of metal forming processes.
All these discussed aspects of modeling involve
long computing times when applied to industrial
forming processes, in particular when FE model is
Figure 1: Multi physics model (
σ
- stress,
ε
- strain, Q
d
. –
deformation heating, T – temperature, Q
f
–heat due to
phase transformations, X – volume fraction of phases.
used in connection with the optimization task.
Further increase of the computing costs is observed
when the whole manufacturing chains are to be
optimized. It often makes industrial applications of
this approach impossible. Therefore, the objective of
Authors’ research has been for some time focused
on making simulation and optimization of metal
forming processes more efficient and user friendly
(Rauch et al., 2014a; Kusiak et al., 2015). The
computer system ManuOpti for optimization of
manufacturing chains was developed (Rauch,
2014b). ManuOpti is the software responsible for
flexible integration of various external computer
programs for numerical simulations, libraries of
optimization methods, sensitivity analysis,
metamodels and material databases. Graphical User
Interface (GUI) is an important part of the
ManuOpti, which enables working with this system
for the user with little experience in the computer
science and in the optimization methods
The particular objectives of this work were
twofold. The first was validation of models applied
to simulations of manufacturing of automotive part.
This part of the paper recapitulates and systemizes
Authors earlier research (Pietrzyk and Kuziak, 2012;
Pietrzyk et al., 2014a). The second was performing
numerical tests with the system ManuOpti and
application of this system to optimization of
manufacturing of the automotive part.
183
Rauch L., Pernach M., Kusiak J. and Pietrzyk M..
Simulations and Optimization of Manufacturing of Automotive Parts.
DOI: 10.5220/0005554601830191
In Proceedings of the 5th International Conference on Simulation and Modeling Methodologies, Technologies and Applications (SIMULTECH-2015),
pages 183-191
ISBN: 978-989-758-120-5
Copyright
c
2015 SCITEPRESS (Science and Technology Publications, Lda.)

2 MANUFACTURING OF
AUTOMOTIVE PARTS
The manufacturing chain for automotive parts,
which are responsible for the safety of passengers, is
described briefly is this chapter. This chain will be a
subject of simulation and optimization in the paper.
2.1 Advanced Steels for Automotive
Parts
There has been an enormous progress made in
development of materials for automotive industry
during the last half of the century. Competition
between steels and non-ferrous metals has been
observed and in the case of former materials, it led
to four important milestones: High Strength Low
Alloyed Steels (HSLA) (1980-ies), Advanced High
Strength Steels (AHSS) (1990-ies), 2nd generation
AHSS (2000) and 3rd generation AHSS (2010). The
last group of steels is presently investigated in many
laboratories. These steels offer comparable or even
improved capabilities at significantly lower cost. For
more information about the family of the AHSSs see
(Hofmann et al., 2005; Matloch et al., 2009).
Obtaining of specific features and properties in
AHSSs is based on specific control of thermal cycles
during production to obtain required multiphase
microstructures. Numerical simulations of thermal-
mechanical-microstructural phenomena occurring
during manufacturing of these steels support design
of optimal technologies. Manufacturing of a crash
box made from AHSS was a subject of analysis in
the present paper. Dual Phase (DP) steel was
selected for this analysis. These steels are commonly
used not only for vehicle body but also for
controlled crashing zone components (Gronostajski
et al., 2014). Essentially, two phase microstructure
containing predominantly ferrite (F) and 20-30% of
Figure 2: Typical DP microstructure.
martensite (M) gives unique properties of DP steels.
Beyond the martensite, small amounts of bainite (B)
or retained austenite (RA) can appear in the DP
steels, but the total volume fraction of hard
constituents (M+B+RA) should not exceed 30%.
Typical DP microstructure from the scanning
microscope is shown in Figure 2.
The morphology and volume fraction of
martensite, as well as its chemical composition and
hardness, are the main factors, which influence
properties of products. In the case of the crash box
the capability to accommodate the energy during
collision is the most important property. This
capability increases when strength, hardening
coefficient and elongation in the tensile test
(ductility) increase. These are usually contradictory
features – increase of strength is in general
connected with the decrease of ductility. This
problem was partly overcome by development of
multiphase steels (AHSS), which combine good
strength with the ductility. It is achieved by
combination of the soft ferritic matrix (ductility)
with hard constituents (strength), see Figure 2.
Required relation between volume fractions of
ferrite and martensite, which is crucial for the
quality of DP steels, is obtained by applying special
cooling paths. The general idea is fast cooling of the
steel to the temperature of maximum rate of the
ferritic transformation, maintaining at this
temperature for the time needed to obtain required
volume fraction of ferrite and further fast cooling to
transform the remaining austenite into hard
constituents. Practical realization of this cycle is
described in the next section. Modeling of
metallurgical phenomena occurring in the
microstructure during this cycle is the scope of this
paper. The objective was to control processing
parameters to obtain required microstructure.
2.2 Manufacturing Chain
The manufacturing chain for automotive parts is
shown schematically in Figure 3. This chain
includes hot strip rolling, laminar cooling,
continuous annealing, stamping and welding.
Simulation and optimization includes also
exploitation of products, where the in use properties
are checked and can be used in the goal function in
the optimization task. In the case of the crash box,
which was selected for the analysis in the present
paper, the exploitation means the crash tests, where
capability of the product to accommodate the energy
during car collision is evaluated.
SIMULTECH2015-5thInternationalConferenceonSimulationandModelingMethodologies,Technologiesand
Applications
184
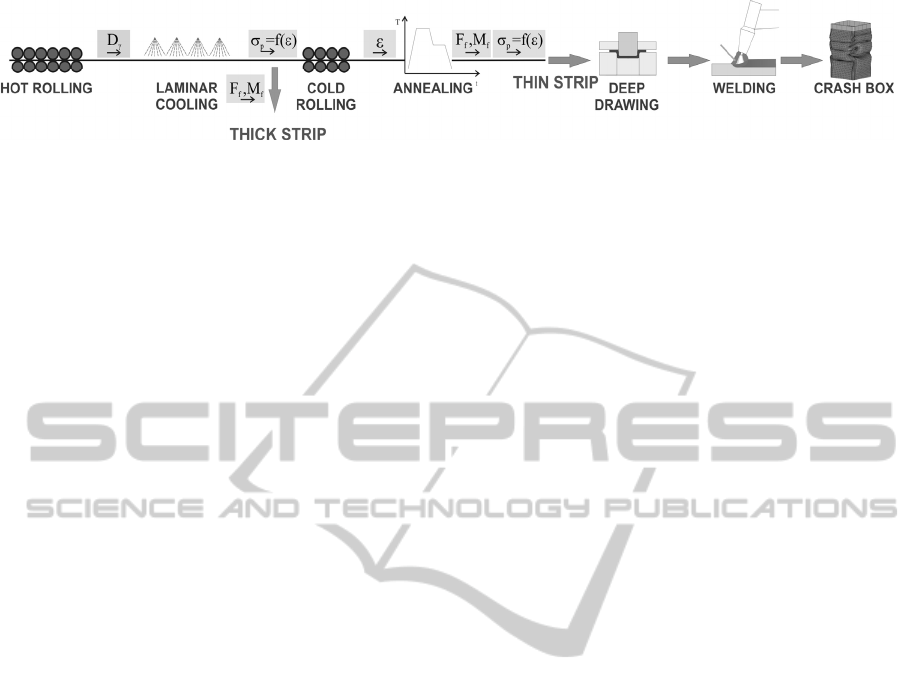
Figure 3: Manufacturing chain for automotive parts.
Two-phase microstructure can be obtained in one of
the following two operations in this manufacturing
cycle. The first is laminar cooling, in which thicker
strips made of DP steels can be obtained. The
second is continuous annealing after cold rolling, in
which thinner DP steel strips are produced.
Optimization of the laminar cooling was described
by Pietrzyk et al. (2014a) and it is not considered in
the present work. The focus is on the continuous
annealing as a process, in which two-phase
microstructure is obtained in the thinner strips.
Simulations of the whole manufacturing chain in
Figure 3 were performed by the Authors, see paper
by Kuziak and Pietrzyk (2011). The parameters,
which are transferred between the processes in
simulations, are shown in Figure 3. They include
grain size D
γ
after hot rolling, flow stress
σ
p
after
laminar cooling, strain ε after cold rolling and
volume fractions of phases F
f
, Fm (ferrite,
martensite) and flow stress
σ
p
after continuous
annealing.
The objective of simulation and optimization of
the manufacturing chain in Figure 3 is design of the
best technology, which will give maximum
capability of product to accumulate the energy of
deformation. It was shown by Ambrozinski et al.
(2015) that capability of energy accumulation is
correlated with the volume fractions of phases in the
DP steel. Therefore, the objective function in
optimization was formulated as required volume
fractions of ferrite and martensite. Sensitivity
analysis performed by Szeliga et al. (2013) has
shown that parameters of hot rolling and laminar
cooling have small influence on the phase
composition after continuous annealing. Moreover,
cold rolling parameters are limited by the
technological constraints. Thus the total reduction in
the cold rolling is between 60 and 70% and in this
range the influence of the reduction on the phase
volume fractions after annealing is negligible.
Therefore, in the present paper the results of
simulations of the whole manufacturing chain are
presented and optimization was constrained to the
parameters of the continuous annealing process.
3 MODELS
The models, which were used to simulate the
manufacturing chain for automotive parts are
described in this section. For each process in Figure
3 models of various complexities were developed by
the Authors. The models ranged from simple closed
form equations describing selected parameters to
advanced multiscale approaches combining FE code
in macro scale with the Cellular Automata method in
micro scale, see for example (Pietrzyk et al., 2014b).
Selection of the best model of each process in the
cycle for the purpose of the optimization of the
manufacturing technology is described in (Rauch et
al., 2014a). All these models are discussed below
3.1 Hot and Cold Rolling
Metamodel trained on the basis of FE simulations
was used to calculate forces in hot rolling.
Temperatures in this process were calculated using
1D FE solution of the heat transfer equation through
the strip thickness. Microstructure evolution was
described by closed form equations based on
fundamental works of Sellars (1979), which were
implemented in the 1D FE code. See (Kuziak and
Pietrzyk, 2011) for more details on modeling of the
hot strip rolling. Cold rolling process, which was not
included into optimization, was simulated using 2D
FE program described by Pietrzyk (2000).
Identification of coefficients in the models was
essential for the accuracy of the simulations. The
coefficients were identified on the basis of
compression tests (flow stress) and stress relaxation
tests (microstructure evolution). Various steels were
investigated in the project but all the results in the
present paper were obtained for the DP600 steel
containing 0.09%C, 1.42%Mn, 0.1%Si, 0.35%Cr
and 0.053%Al. Identification of the coefficients in
the flow stress model was performed using the
Authors’ inverse algorithm (Szeliga et al., 2006) for
the uniaxial compression tests, which were
performed on the Gleeble 3800 in the Institute for
SimulationsandOptimizationofManufacturingofAutomotiveParts
185

Ferrous Metallurgy in Gliwice, Poland. Flow stress
equations for hot and cold rolling have the form:
ε
σεε
−−
=
0.2 0.28 0.12 0.003
3255 e e
T
h
(1)
σεε
=
0.137 0.0019
908.2
c
(2)
where:
σ
h
,
σ
c
- flow stress in hot and cold rolling,
respectively, in MPa,
ε
- strain,
ε
- strain rate in s
-1
,
T – temperature in
o
C.
3.2 Phase Transformations
Five transformations may occur during laminar
cooling and continuous annealing processes. Four of
them are diffusive transformations. Ferritic-pearlitic
microstructure is transformed into austenite during
heating. During cooling austenite is transformed into
ferrite, pearlite, bainite. and into martensite. The last
transformation does not involve long range
diffusion. Model of diffusive phase transformations
was based on the JMAK (Johnson, Mehl, Avrami,
Kolmogorov) equation:
()
1exp
n
X
kt=− −
(3)
where: k, n – coefficients, t – time in seconds??? .
The model for all transformations contains 26
coefficients, which are grouped in the vector a.
Upgrade of the JMAK equation (3) used in the
present work is described by Kuziak and Pietrzyk
(2012). Briefly, constant value of the coefficient n
was assumed and this coefficient is represented by
a
6
, a
7
, a
16
and a
24
for austenitic, ferritic, pearlitic and
bainitic transformations, respectively. Coefficient k
was introduced as function of the temperature and
the following functions were used for austenitic (k
a
),
ferritic (k
f
) and bainitic (k
b
) transformations:
()
2
1
exp
273
a
a
ka
RT
=
+
(4)
11
39
8
10
400
exp
a
c
f
TA a
D
a
k
Da
γ
γ
−+−
=−
(5)
()
26 25 24
exp 0.01
b
ka a aT=−
(6)
where: R – gas constant.
Constant value of the coefficient k
p
= a
15
was
assumed for the pearlitic transformation. Incubation
time has to be introduced before austenitic (
τ
a
),
pearlitic (
τ
p
) and bainitic (
τ
b
) transformations and
the following equations were used:
()
()
6
45
1
exp
273
A
a
a
c
aa
RT
T
τ
=
+
−
(7)
()
()
14
12 13
1
exp
273
A
P
a
c
aa
RT
T
τ
=
+
−
(8)
()
()
19
17 18
20
exp
273
b
a
aa
RT
aT
τ
=
+
−
(9)
The remaining equations in the model were:
20
425[C] 42.5[Mn] 31.5[Ni]
s
Ba=− − −
(10)
25 26s
M
aaC
γ
=−
(11)
()
{
}
1 exp 0.011
ms
FMT
ζ
=− − −
(12)
where:
ζ
= 1 – (F
f
+ F
p
+ F
b
), B
s
, M
s
– start
temperatures for bainitic and martensitic
transformation, respectively, in
o
C, F
f
, F
p
, F
b
, F
m
–
volume fraction of ferrite, pearlite, bainite and
martensite, respectively.
Coefficients in equations (4) - (12) obtained by
the inverse analysis of dilatometric tests for the
investigated steel are given in Table 1. The phase
transformations model with optimized coefficients
was used in the present paper for simulation and
optimization of the continuous annealing with the
phase composition used in the objective function.
3.3 Model Validation
Good reliability and accuracy of the hot and cold
rolling processes was confirmed in (Kuziak and
Pietrzyk, 2011; Madej et al, 2015). Since the final
product properties are obtained either during laminar
cooling or during continuous annealing, validation
of the phase transformation model during these
Table 1: Coefficients in the phase transformations model obtained by the inverse analysis of dilatometric tests for the
investigated steel DP600.
a
1
a
2
a
3
a
4
a
5
a
6
a
7
a
8
a
9
a
10
a
11
a
12
a
13
32774 8.53 2.88 9.5×10
9
229.3 1.21 1.48 7.1 145.9 36.8 2.09 1397 67.7
a
14
a
15
a
16
a
17
a
18
a
19
a
20
a
21
a
22
a
23
a
24
a
25
a
26
3.47 0.127 1.86 24.2 24.9 1.7 683.3 0.006 0.187 0.518 0.462 428 2.9
SIMULTECH2015-5thInternationalConferenceonSimulationandModelingMethodologies,Technologiesand
Applications
186
processes is essential. The former process was
thoroughly investigated by Pietrzyk et al. (2014b),
therefore, in the present paper the focus was on the
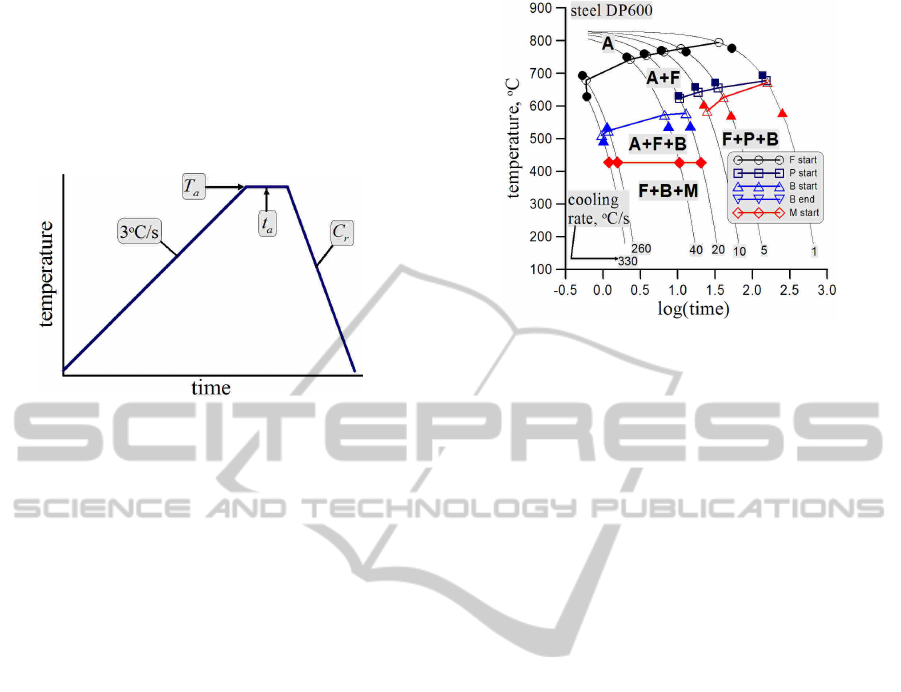
continuous annealing. Physical simulations of
thermal cycles characteristic for the continuous
annealing were performed on the dilatometer
according to the general scheme shown in Figure 4.
Figure 4: Thermal cycles used in the experiments.
All the tests were performed at the Institute for
Ferrous Metallurgy in Gliwice, Poland. The samples
were heated to the temperature T
a
with the heating
rate of 3
o
C/s, maintained at that temperature for the
time t
a
and cooled with various cooling rates C
r
. The
following values of parameters were used in the
experiments: temperatures T
a
= 790
o
C, 830
o
C and
920
o
C; times t
a
= 0 s and 20 s; cooling rates C
r
= 1,
5, 10, 20, 40 and 300
o
C/s. More details about these
experiments can be found in (Gorecki et al., 2015).
Temperatures T
a
were selected that way that
790
o
C was in the intercritical region (between A
c1
and A
c3
) and two phases ferrite and austenite were in
the microstructure, 830
o
C was equal to A
c3
for the
considered steel and 920
o
C was in the austenitic
region. Start and end temperatures of
transformations were measured. Microstructure of
each sample after the test was investigated and
volume fractions of phases were evaluated, although
this measurement was very difficult and obtained
values could be considered as estimation only.
Simulations of all experimental thermal cycles were
performed and the results were compared. Selected
results only are presented in the following figures.
Comparison of the start and end temperatures for
the sample heated to 920
o
C and cooled with various
rates is shown in Figure 5. Comparison of the
measured and calculated volume fraction of the
austenite in the microstructure gave the following
results. F
a
= 15, 60 and 100% from measurements
and F
a
= 14.1, 58.3 and 100% from calculations, for
T
a
= 790
o
C, 830
o
C and 920
o
C, respectively.
Further validation involved comparison of
measured and predicted volume fractions of phases.
Figure 5: Comparison of the measured (full symbols) and
calculated (open symbols with lines) start and end
temperatures for the sample heated to 920
o
C and cooled
with various rates.
However, as it has already been mentioned,
distinguishing the phases in the experimental
samples was difficult. Therefore, comparison was
limited to soft (ferrite + pearlite) and hard (bainite +
martensite) constituents. Selected results of the
comparison are shown in Figure 6. On the basis of
earlier research (Kuziak and Pietrzyk, 2011) and on
the basis of models validation, it can be concluded
that the models predict with good accuracy forces,
temperatures and austenite grain size during rolling,
as well as kinetics of phase transformations during
laminar cooling and continuous annealing. The
models were used for simulations of the
manufacturing chain for the automotive part and the
results are presented in the next section.
4 SIMULATION OF THE
MANUFACTURIN CHAIN
Simulations of the whole manufacturing chain
presented in Figure 3 were performed and the results
are presented below. 6 stand hot strip rolling mill
was considered. Slab cross section was 40.6×1500
mm and the final strip thickness was 3.4 mm.
Rolling schedule was 40.6 → 21.3 → 11.4 → 7.0 →
4.9 → 4.0 → 3.4 mm and strip velocities at the exit
from subsequent stands were 0.83, 1.6, 2.98, 4.86,
6.94, 8.5 and 9.7 mm/s. Figure 7 shows calculated
forces, temperatures at two locations and austenite
grain size during rolling. Comparison of forces and
temperatures with measurements confirmed again
good predictive capabilities of the models.
SimulationsandOptimizationofManufacturingofAutomotiveParts
187
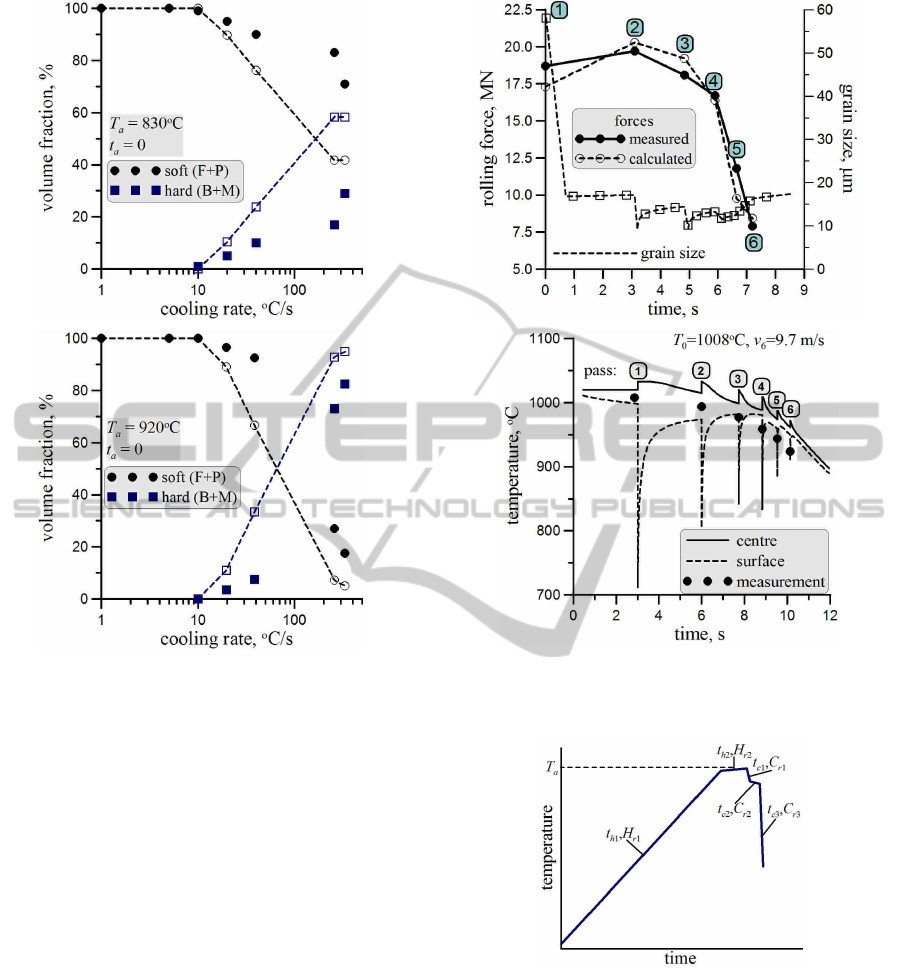
Figure 6: Comparison of the measured (full symbols) and
calculated (open symbols with lines) soft (ferrite +
pearlite) and hard (bainite + martensite) constituents.
Laminar cooling and cold rolling were simulated
next. Full results of these simulations are given in
(Pietrzyk et al., 2014a) and in (Madej et al., 2015)
for laminar cooling and cold rolling, respectively.
These results are not repeated in the present paper.
The main focus was put on simulations of the
continuous annealing. Typical thermal cycle for this
process is shown in Figure 8. In this figure t
represents time, H
r
represents heating rate and C
r
cooling rate. During heating the recrystallization of
the ferrite occurs first and it is followed by austenitic
transformation. Depending on the maximum
temperature of the cycle (T
a
) the process is classified
as intercritical (A
c1
< T
a
< A
c3
) or fully austenitized
(T
a
> A
c3
).
Results of simulations for two temperatures T
a
(810
o
C and 850
o
C) are presented below. Heating rate
H
r1
was 10
o
C/s, in the second stage t
h2
= 40 s and H
r2
= 0.25
o
C/s. Time t
c2
was the second varying
parameter and values 4 and 8 s were considered.
Figure 7: Comparison of the measured (full symbols) and
calculated (open symbols with lines) soft (ferrite +
pearlite) and hard (bainite + martensite) constituents.
Figure 8: Typical continuous annealing thermal cycle.
Remaining parameters were C
r1
= 60
o
C/s, C
r3
=
100
o
C/s, C
r2
= 1.5
o
C/s. Calculated changes of the
ferrite volume fraction during four investigated
cycles of the continuous annealing are shown in
Figure 9 (A: T
a
= 810
o
C, t
c2
= 4 s; B: T
a
= 810
o
C, t
c2
= 8 s; C: T
a
= 850
o
C, t
c2
= 4 s; D: T
a
= 850
o
C, t
c2
= 8
s;). Calculated volume fractions of ferrite after
heating (“old” ferrite) and volume fraction of ferrite
and martensite after four investigated cycles of the
continuous annealing are shown in Figure 10.
SIMULTECH2015-5thInternationalConferenceonSimulationandModelingMethodologies,Technologiesand
Applications
188
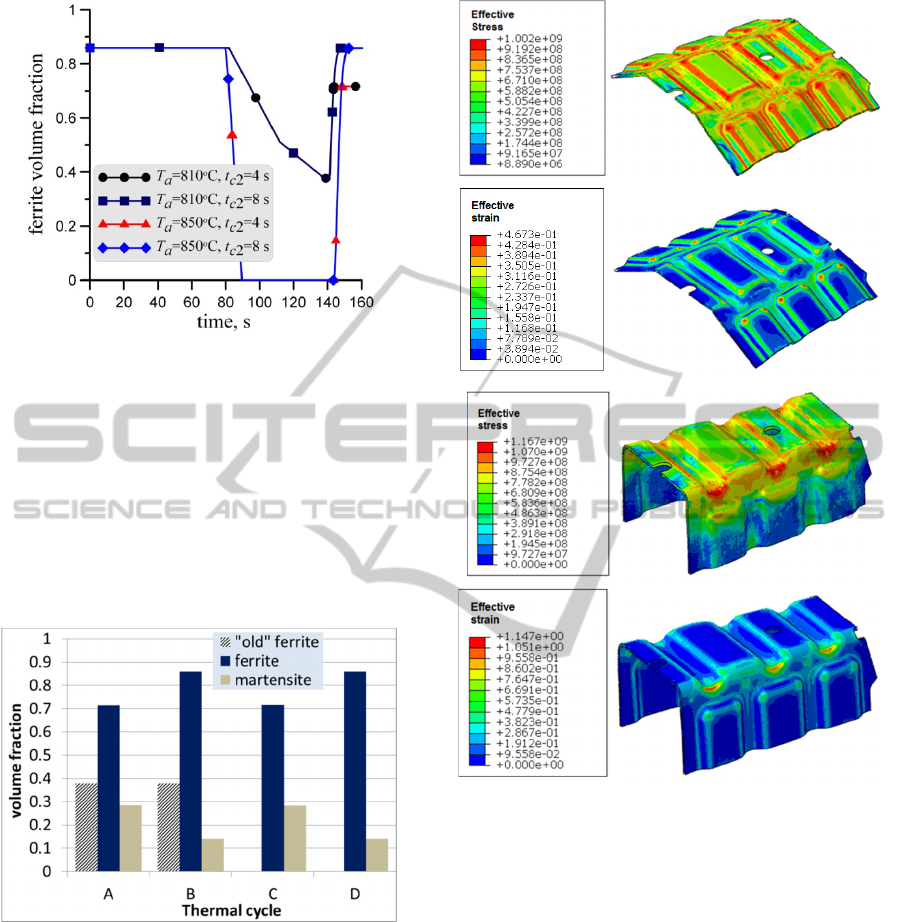
Figure 9: Changes of the ferrite volume fraction during
four investigated cycles of the continuous annealing.
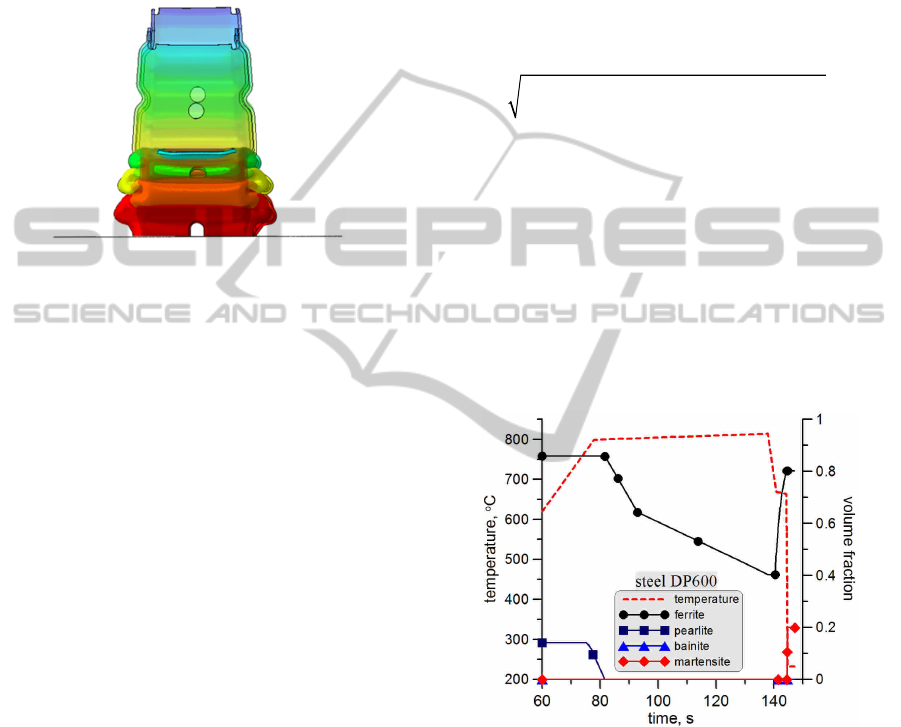
Microstructure after annealing was accounted for
in the material model for simulations of the
stamping process and the crash test. Calculated
stresses and strains for the two steps of stamping of
the crash box are shown in Figure 11. Results of
simulation of the crash test with strain distributions
are shown in Figure 12. The original crash box with
stains transformed from the stamping, as well as the
crash box after the test, are shown in this figure.
Figure 10: Calculated volume fraction of ferrite after
heating (“old” ferrite) and volume fractions of ferrite and
martensite after investigated cycles of the annealing.
All results presented in this section of the paper,
as well as in publications (Kuziak and Pietrzyk,
2011) for hot rolling, (Pietrzyk et al., 2014b) for
laminar cooling and (Ambrozinski et al., 2015) for
stamping and crash tests, confirmed capabilities of
the models to simulate the whole manufacturing
chain for automotive parts.
Figure 11: Calculated effective stress and effective strain
for the step 1 (top) and step 2 (bottom) during stamping of
the crash box (Ambrozinski et al., 2015).
5 OPTIMIZATION OF THE
CONTINUOUS ANNEALING
Models described in section 3 were implemented in
the ManuOpti system for optimization of
manufacturing chain. Details of the computer
science basis of the system are given by Rauch et al.
(2014b) and examples of its various applications are
described by Kusiak et al. (2015). In the developed
system the functionality of optimization is covered
by numerical modules, which can be directly
imported into the system in a form of dynamically
linked libraries (dll files). The main requirement is
that each library has to possess the class called
Main, which supports listing of available
SimulationsandOptimizationofManufacturingofAutomotiveParts
189
optimization tools and their parameters through the
listing method. Besides this functionality, the system
is equipped with built in library with conventional
optimization methods, as well as nature inspired
algorithms. Additionally, the optimization strategy,
which allows selection and configuration of the best
method for the analyzed problem is equipped with
the library.
Figure 12: Strain distribution in the crash box before and
after deformation (Ambrozinski et al., 2015).
6 OPTIMIZATION OF THE
CONTINUOUS ANNEALING
Models described in section 3 were implemented in
the ManuOpti system for optimization of
manufacturing chain. Details of the computer
science basis of the system are given by Rauch et al.
(2014b) and examples of its various applications are
described by Kusiak et al. (2015). In the developed
system the functionality of optimization is covered
by numerical modules, which can be directly
imported into the system in a form of dynamically
linked libraries (dll files). The main requirement is
that each library has to possess the class called
Main, which supports listing of available
optimization tools and their parameters through the
listing method. Besides this functionality, the system
is equipped with built in library with conventional
optimization methods, as well as nature inspired
algorithms. Additionally, the optimization strategy,
which allows selection and configuration of the best
method for the analyzed problem is equipped with
the library.
Graphical User Interface (GUI) is an important
part of the system, which enables working with this
system for the user with little experience in the
computer science and in the optimization methods.
To facilitate creation and parameterization of
production cycles through the GUI, the system
gathers information about single processes, which
can be flexibly joined together by using specially
prepared converters. The system communicates with
FE commercial software, as well as with in-house
software used in production optimization.
Computer system ManuOpti was applied to
optimization of the continuous annealing. The
objective of the optimization was to obtain 20% of
martensite and as low as possible volume fraction of
bainite in the microstructure, with 40% of the
intercritical ferrite. The objective function was
formulated as follows:
()
()
Φ= − + + −
2
2
2
10230mm b if if
wF F wF wF F
(13)
where: w
1
, w
2
– weights, F
if
– volume fraction of the
intercritical ferrite, respectively, F
m0
, F
if0
–– required
volume fraction of martensite and intercritical
ferrite, respectively.
Parameters of the thermal cycle shown in Figure
8 were the design variables. Optimization of the
objective function (13) gave the thermal cycle
shown by the dashed line in Figure 13. Continuous
lines in this figure represent changes volume
fractions of phases during this cycle. It is seen that
required volume fractions of phases were obtained.
Figure 13: Optimal thermal cycle of the continuous
annealing (dotted line) and kinetics of transformations
during this cycle.
7 SUMMARY
Simulation of the manufacturing cycle for
automotive parts was presented in the paper.
Analysis of results has shown that the final
properties of product are obtained in the continuous
annealing and this process was selected for the
optimization. Computer system supporting design of
SIMULTECH2015-5thInternationalConferenceonSimulationandModelingMethodologies,Technologiesand
Applications
190

production processes and cycles in metal forming
industry was used. The system is user friendly and
adapts easily to new use cases. Performed
optimization allowed to design the thermal cycle,
which gives required volume fraction of phases in
the final product.
ACKNOWLEDGEMENTS
Financial assistance of the NCN, project no.
2011/03/B/ST8/06100, is acknowledged.
REFERENCES
Ambroziński, M., Polak, S., Gronostajski, Z., Kuziak, R.,
Chorzępa, W., Pietrzyk, M., 2015, Numeryczna
symulacja testu zderzeniowego z uwzględnieniem
umocnienia odkształceniowego w procesie
wytwarzania energochłonnego elementu samochodu
(Numerical simulation of the crash test accounting for
strain hardening introduced during the manufacturing
stage), Mechanik, 88, 92-96 (in Polish).
Górecki G., Kuziak R., Kwiaton N., Madej Ł., Pietrzyk
M., 2015, DP_builder - the computer system for the
design of the continuous annealing cycles for DP
steels, Computer Methods in Materials Science, 14, (in
press).
Gronostajski, Z., Niechajowicz, A., Polak, S., 2010.
Prospects for the use of new generation steel of the
AHSS type for collision energy absorbing
components, Archives of Metallurgy and Materials,
55, 221-230.
Hofmann, H., Mattissen, D., Schaumann, T.W., 2009.
Advanced cold rolled steels for automotive
applications, Steel Research International, 80, 22-28.
Kusiak, J., Rauch, Ł., Pietrzyk, M., 2015. Holistic
approach to optimal design of technology of materials
processing, Proc. XXXIV Verformungskundliches
Kolloquium, ed., Buchmayr, B., Zauchensee, 56-66.
Kuziak, R., Pietrzyk, M., 2011, Physical and numerical
simulation of the manufacturing chain for the DP steel
strips, Steel Research International, special edition
Conf. ICTP, Aachen, 756-761.
Madej Ł., Kuziak R., Mroczkowski M., Perzynski K.,
Libura W., Pietrzyk M., 2015, Development of the
multi scale model of cold rolling based on physical
and numerical investigation of ferritic-pearlitic steels,
Archives of Civil and Mechanical Engineering, 15,
doi.org/10.1016/j.acme.2015.02.010.
Matlock, D.K., Krauss, G., Speer, J.G., 2005. New
microalloyed steel applications for the automotive
sector, Materials Science Forum, 500-501, 87-96.
Pietrzyk, M., Kuziak, R., 2012. Modelling phase
transformations in steel, in: Microstructure evolution
in metal forming processes, eds, Lin, J., Balint, D.,
Pietrzyk, M., Woodhead Publishing, Oxford, 145-179.
Pietrzyk, M., Kuziak, R., Radwański, K., Szeliga, D.,
2014a. Physical and numerical simulation of the
continuous annealing of DP steel strips, Steel
Research International, 85, 99-111.
Pietrzyk M., Kusiak J., Kuziak R., Madej Ł., Szeliga D.,
Gołąb R., 2014b. Conventional and multiscale
modelling of microstructure evolution during laminar
cooling of DP steel strips, Metallurgical and Materials
Transactions B, 46B, 497-506.
Rauch, Ł., Kuziak, R., Pietrzyk, M., 2014a. From high
accuracy to high efficiency in simulations of
processing of Dual-Phase steels, Metallurgical and
Materials Transactions B, 45B, 497-506.
Rauch, Ł., Skiba, M., Kusiak, J., 2014b. Computer system
dedicated to optimization of production processes and
cycles in metal forming industry, Computer Methods
in Materials Science, 14, 3-12.
Sellars, C.M., 1979, Physical metallurgy of hot working.
In Hot working and forming processes, eds, Sellars
C.M., Davies G.J., The Metals Soc., London, 3-15.
Szeliga, D., Gawąd, J., Pietrzyk, M., Inverse analysis for
identification of rheological and friction models in
metal forming, Computer Methods in Applied
Mechanics and Engineering, 195, 2006, 6778-6798.
Szeliga, D., Sztangret, Ł., Kusiak, J., Pietrzyk, M., 2013.
Optimization as a support for design of hot rolling
technology of dual phase steel strips, Proc. 11th Conf.
NUMIFORM, AIP Publishing, Shenyang, 718-724.
SimulationsandOptimizationofManufacturingofAutomotiveParts
191
