
Optimal Design of Digital Low Pass Finite Impulse Response Filter using
Particle Swarm Optimization and Bat Algorithm
Alcemy G. V. Severino, Leandro L. S. Linhares and F´abio M. U. de Ara´ujo
Department of Computer Engineering and Automation,
Federal University of Rio Grande do Norte, 59078-900, Natal, RN, Brazil
Keywords:
FIR Filter Design, Bat Algorithm, Particle Swarm, Optimization.
Abstract:
In this paper, the traditional metaheuristic Particle Swarm Optmization (PSO) and the Bat Algorithm (BA)
are used to optimal design digital low pass (LP) Finite Impulse Response (FIR) filters. These filters have a
wide range of applications because of their characteristics. They are easy to be designed, they have guaranteed
bounded input-bounded output (BIBO) stability and can be designed to present linear phase at all frequencies.
Traditional optimization methods based on gradient are susceptible to getting trapped on a local optima solu-
tion when they are applied to optimize multimodal problems, such as the FIR filter design. Here, to overcome
this drawback, the aforementioned metaheuristics are adopted to obtain the coefficients of low pass FIR filters
of order 20 and 24. The performance of BA and PSO algorithms are compared with the classical Parks and
McClellan (PM) filter design algorithm, which is a deterministic procedure. For this comparison is consid-
ered the filters pass band and stop band ripples, transition width and statistical data. The simulation results
demonstrate that the proposed filter design approach using BA algorithm outperforms PM and PSO.
1 INTRODUCTION
The digital filters have a relevant role in digital sig-
nal processing systems. By performing mathematical
operations in a given signal, they are able to reduce
or amplify certain aspects of this signal. Digital fil-
ters are used in a large number of applications, such
as, video and audio processing, control and communi-
cation systems, systems for medical purposes, among
others (Mandal et al., 2012a). The Finite Impulse Re-
sponse (FIR) and Infinite Impulse Response (IIR) fil-
ters are the two major types of digital filters (Mandal
et al., 2012b).
The impulse response of a FIR filter has finite du-
ration. On the other hand, the same response of a IIR
filter theoretically extends to infinity. The FIR filters
are guaranteed to be bounded input-bounded output
(BIBO) stable once they are non-recursivefilters. The
IIR filters are knownas recursivefilters, so their appli-
cation requires caution regarding their stability. The
IIR filters are useful for high-speed designs because
they typically require a lower number of multiplies
compared to FIR filters, however their implementa-
tion is more complicated (Litwin, 2000). Therefore,
the FIR filters are an attractive approach in practical
applications. They are easily implemented in digital
systems and do not present instability issues. Further-
more, the FIR filter coefficients can be designed to
be symmetrical about the center coefficient position,
what guarantees a linear phase characteristic (Litwin,
2000; Mandal et al., 2012a).
The optimal design of a filter consists in choosing
a set of coefficients of the filter to have a frequency
response that optimally approximates the desired re-
sponse (Ouadi et al., 2013). The FIR filter design
is a nonlinear, non-differentiable and multimodal op-
timization problem that requires a suitable objective
function to provide an accurate control of the various
parameters of frequency spectrum. Therefore, the tra-
ditional optimization methods based on gradient do
not represent a proper approach to solve this problem.
The Remez Multiple Exchange routine is used by
the classical Parks and McClellan (PM) algorithm to
design an optimal Chebyshev FIR filter (Parks and
McClelland, 1972). This deterministic algorithm ex-
ecutes an iterative process based on the Chebyshev’s
alternation theorem in order to minimize the ripple
value, considering another design specifications, such
as the edge frequency and the filter size. However,
this algorithm does not allow explicit selection of the
maximum of the absolute ripple in the pass band and
stop band (δ
p
, δ
s
), instead one can only specify their
207
G. V. Severino A., L. S. Linhares L. and M. U. de Araújo F..
Optimal Design of Digital Low Pass Finite Impulse Response Filter using Particle Swarm Optimization and Bat Algorithm.
DOI: 10.5220/0005545902070214
In Proceedings of the 12th International Conference on Informatics in Control, Automation and Robotics (ICINCO-2015), pages 207-214
ISBN: 978-989-758-122-9
Copyright
c
2015 SCITEPRESS (Science and Technology Publications, Lda.)

ratio (Ababneh and Bataineh, 2008).
In literature, different metaheuristics have been
used to optimal design digital FIR filters, such as
Particle Swarm Optimization (PSO) (Mandal et al.,
2012a; Mandal et al., 2012b; Saha et al., 2013), Ge-
netic Algorithms (GA) (Najjarzadeh and Ayatollahi,
2008; Ababneh and Bataineh, 2008), Gravitational
Search Algorithm (GSA) (Saha et al., 2012), Cuckoo
Search Algorithm (CSA) (Singh and Josan, 2014).
Among the different metaheuristics, PSO and Bat Al-
gorithm (BA) stand out for their simplicity of imple-
mentation and the low number of parameters that con-
trol their performance and convergence.
The PSO was proposed by Kennedy and Eberhart
(Kennedy and Eberhart, 1995). It is based on sim-
ulating the social behavior of swarm of bird flock-
ing, bees, and fish shooling (Ababneh and Bataineh,
2008). The BA was proposed by Yang (Yang, 2010),
based on the echolocation behavior of bats. Due to
the echolocation, the microbats can find their prey
and discriminate different types of insects even in
complete darkness. Both of these nature inspired
metaheuristics are able to solve multi-dimensional
and multi-modal optimization problems, overcoming
some drawbacks of optimization gradient based meth-
ods.
In this work, the BA and PSO metaheuristics are
employed to optimal design digital low pass (LP) Fi-
nite Impulse Response filters of order 20 and 24. The
performance of these algorithms are compared with
the Parks and McClellan filter design method. The
stop band and pass band ripples, the transition width
and statistical information are evaluated in this com-
parison. The simulation results demonstrated that in
general BA presented the best performance in this
specific study. It is noteworthy that according to the
No Free Lunch Theorem of optimization affirms that
a general purpose universal optimization strategy is
impossible, and the only one strategy can outperform
another is if it is specialized to the structure of the
specific problem under consideration (Ho, 2001).
The remainder of this paper is organized as fol-
lows. Next section presents some basical concepts of
the FIR filter and the objective function used by PSO
and BA. Section 3 briefly describes the mechanisms
of traditional PSO and BA metaheuristics. In Sec-
tion 4, the obtained LP FIR filters are presented and
the filter design approaches are compared. Finally, in
Section 5 concluding remarks are given.
2 FIR FILTER DESIGN
Depending on what criteria are used, filters can be
classified in several different ways. The two major
types of digital filters are Finite Impulse Response
(FIR) and Infinite Impulse Response (IIR) filters. The
digital FIR filter, that is the focus of this study, can be
mathematically described as follows:
H(z) =
N
∑
n=0
h(n)z
−1
(1)
where N is the FIR filter order with (N + 1) coeffi-
cients to be set. Once the designed filters in this paper
are positive and features even symmetry, N is an even
number and only (N/2+ 1) coefficients of h(n) need
to be designed. After the optimization they are con-
catenated to obtain all the (N + 1) low pass FIR filters
coefficients. In this work, the PSO and BA are used
to find these coefficients. Therefore, each individual
(particle and bat) of these metaheuristics corresponds
to a coefficient vector {h(0),h(1),.. ., h(N/2)}.
The frequency response of a FIR filter can be de-
fined as follows:
H
e
jω
k
=
N
∑
n=0
h(n)e
− jω
k
n
(2)
where ω
k
=
2πk
N
and H
e
jω
k
is the complex vector of
the Fourier transform, which provides the FIR filter
frequency response. The frequency is sampled from
0 to π with N samples. The PM algorithm for filter
design uses the approximate error presented in (3).
E(ω) = G(ω)
H
d
(e
jw
) − H
i
(e
jw
)
(3)
where H
d
(e
jw
) is the frequency response of the de-
signed filter and H
i
(e
jw
) is the frequency response of
the ideal filter. G(ω) is the weighting function that
provides the suitable weights for E(ω) in its different
frequency bands. The H
i
(e
jw
) of an ideal filter can be
expressed by the following relation:
H
i
(e
jw
) =
(
1, 0 ≤ ω ≤ ω
c
0, otherwise
(4)
where ω
c
is the edge frequency. The fixed ratio be-
tween the pass band (δ
p
) and stop band (δ
s
) ripples,
presented by δ
p
/δ
s
is the major drawback of the PM
algorithm. In order to obtain more flexibility in the
optimization of the error function, allowing to specify
the desired levels of δ
p
and δ
s
, equation (5) has been
used to design digital filters (Ababneh and Bataineh,
2008; Mandal et al., 2012b; Singh and Josan, 2014).
The cost function J used by the metaheuristics evalu-
ated in this paper is given by (5).
J = max
ω≤ω
p
(|E(ω) − δ
p
|) + max
ω≥ω
s
(|E(ω) − δ
s
|) (5)
ICINCO2015-12thInternationalConferenceonInformaticsinControl,AutomationandRobotics
208

3 OPTIMIZATION ALGORITHMS
3.1 Particle Swarm Optimization
The Particle Swarm Optimization is a nature based
metaheuristic that uses a swarm of particles based on
the social behavior of bird flocking and fish schooling
to search the best solution for a problem to be opti-
mized. Each particle is a possible optimal solution
that moves inside the space of feasible solutions. The
actual position in the search space and the velocity
of the i-th particle of the swarm are given by x
i
and
v
i
, respectively. Besides, after each iteration, the best
position (Pbest
i
) or solution reached by the i-th parti-
cle is determined. Regarding the design of FIR filters,
each dimension of a particle position corresponds to
one coefficient of the filter to be designed. Therefore,
a particle represents a set of coefficients of a digital
filter.
The swarm also have a global feature which cor-
responds to the best global position (Gbest) already
visited by all particles of the swarm. x
i
, v
i
, Pbest
i
and Gbest are n-dimensional vectors, where n is the
dimension of the search space. In traditional PSO the
velocity and position of the i-th particle can be up-
dated using (6) and (7).
v
t+1
i
= ω v
t
i
+ r
1
φ
1
Pbest
t
i
− x
t
i
+ r
2
φ
2
Gbest − x
t
i
(6)
x
t+1
i
= x
t
i
+ v
t+1
i
(7)
The updated values of velocity and position of the
i-th particle is v
t+1
i
and x
t+1
i
, respectively. ω is the in-
ertia weight, φ
1
and φ
2
are constants that indicate the
confidence of the particle in its own experience (lo-
cal search) and the confidence of the particle in the
swarm experience (global search). r
1
and r
2
are uni-
form random numbers between 0 and 1.
3.2 Bat Algorithm
The Bat Algorithm (BA) is inspired in the echoloca-
tion behavior used by bats during their flight move-
ments. The echolocation is based on the emission
of ultrasonic waves and the measurement of the time
spent by these waves to return to their source after
reach the prey or obstacle. The BA pseudocode is
presented in Figure 1.
Initially, a set of N bats is randomly generated in-
side the search space of feasible solutions. The bats
are described according to their position (x
t
i
), veloc-
ity (v
t
i
), emission frequency (f
i
), loudness (A
t
i
) and
While (t < maximum number of iterations)
For i = 1:
N
Generate a new bat (B
new
) using (8), (9) and (10)
If
rand > r
new
Select one among the best solutions and
generate a local solution around this one, using (11)
Select randomly a solution and generate a local
solution around this one, using (11)
Else
End if
Evaluate the bats
If (
rand < A
i
) and (
B
new
<
x
i
)
x
i
=
B
new
Increase
r
i
and reduce
A
i
, using (12) and (13)
End for
Rank bats to find the best solutions in population
Find the best bat
End while
End if
Figure 1: Pseudocode of the Bat Algorithm.
rate of pulse emission (r
t
i
). Regarding the digital filter
design, each dimension of the bat position represents
one of the digital filter coefficients. Therefore, a so-
lution described by one bat is a set of coefficients of
the digital filter. f
max
and f
min
are the maximum and
minimum emission frequency defined as 0 and 0.002
in this work, respectively. β ∈ [0,1] is a vector of ran-
dom numbers with normal distribution. ε is a random
variable between -1 and 1. α and γ are constant pa-
rameters defined as 0.35 in this work. The variable
x
∗
is the current global best position, which is located
after comparing all the solutions among all the bats.
f
i
= f
min
+ ( f
max
− f
min
)β (8)
v
t
i
= v
t−1
i
+ (x
t
i
− x
∗
) f
i
(9)
x
t
i
= x
t−1
i
+ v
t
i
(10)
x
new
= x
old
+ εA
t
(11)
A
t+1
i
= αA
t
i
(12)
r
t+1
i
= r
0
i
[1− exp(−γt)] (13)
4 RESULTS AND DISCUSSION
In this section the simulation results of the optimal
design for LP FIR filters are presented. FIR filters
OptimalDesignofDigitalLowPassFiniteImpulseResponseFilterusingParticleSwarmOptimizationandBatAlgorithm
209

Table 1: Optimized coefficients of the low pass FIR filter of order 20.
Coefficient PM PSO BA
h(1) = h(21) 0.000016462026203 -0.000695081641133 -0.000783617834824
h(2) = h(20) 0.048051046361716 0.036323142108915 0.034504912734454
h(3) = h(19) -0.000023455414888 0.002404782366930 0.002078236516173
h(4) = h(18) -0.036911143268907 -0.039388521163442 -0.035558833869864
h(5) = h(17) -0.000014804257488 -0.002228795879323 -0.002848286056078
h(6) = h(16) 0.057262893095235 0.058189214448380 0.054878934074757
h(7) = h(15) 0.000000677226645 0.005997644375591 0.005087725645620
h(8) = h(14) -0.102172983403192 -0.100284102843516 -0.104969693269015
h(9) = h(13) 0.000011850968750 -0.002421489345895 -0.002895822658702
h(10) = h(12) 0.316962289494363 0.317676093032592 0.318201104593910
h(11) 0.500018538901555 0.503677615564522 0.495333894867404
Table 2: Optimized coefficients of the low pass FIR filter of order 24.
Coefficient PM PSO BA
h(1) = h(25) -0.000037922722817 -0.001877155973793 -0.002252398212624
h(2) = h(24) -0.032842059514712 -0.016508725107988 -0.017785448160513
h(3) = h(23) 0.000037994123700 -0.002070692843938 -0.002036074999033
h(4) = h(22) 0.025333659737802 0.024672556072237 0.024771221865898
h(5) = h(21) -0.000000925584777 0.000991516825629 0.000942322200383
h(6) = h(20) -0.037284360801762 -0.035767575797290 -0.034104768282211
h(7) = h(19) 0.000006294744005 0.000324605801132 0.000357668464521
h(8) = h(18) 0.057619569600668 0.056157880748866 0.055305256615506
h(9) = h(17) 0.000004540157503 0.000780019565850 0.000754780858245
h(10) = h(16) -0.102383739808734 -0.100264251794438 -0.100759858394058
h(11) = h(15) 0.000000730442022 0.000062471248465 0.000056128814183
h(12) = h(14) 0.317060668831323 0.318357596099371 0.320874554639799
h(13) 0.499978577680726 0.496606219356213 0.495598720020515
of order 20 and 24 is evaluated after the adjust of
their 21 and 25 coefficients, respectively. The value
of the sampling frequency adopted is f
s
= 1 Hz and
the number of sampling points is taken as 256. The
specification parameters of the LP FIR filters to be
designed are the pass band ripple (δ
p
) = 0.1, the stop
band ripple (δ
s
) = 0.01, pass band (normalized) edge
frequency (ω
p
) = 0.45; stop band (normalized) edge
frequency (ω
s
) = 0.55; and transition width = 0.1.
In order to establish a fair comparison between
PSO and BA, different parameter values was evalu-
ated for these algorithms. The PSO and BA was exe-
cuted 100 times for each combination of parameters.
In each execution, 20 particles/bats move inside the
search space in 1000 epochs/generations. The empir-
ical best parameters found for PSO and BA to design
the FIR filters in this work are: ω = 0.002, φ
1
= 2,
φ
2
= 1.4, α = 0.35, γ = 0.35, A
0
i
= 0.35, r
0
i
= 0.35,
f
max
= 0.002, f
min
= 0.0. The following results were
obtained using these parameters.
The Tables 1 e 2 list the coefficients of the best
filters of order 20 and 24, respectively, designed by
PSO and BA. The coefficients of the filters obtained
by PM are also presented.
The Table 3 presents a summary of the simula-
tion results obtained by PM, PSO and BA. This table
presents the worst (maximum) ripple value, the aver-
age of the ripples and the best transition width found
in 100 executions of PSO and BA. For the LP FIR fil-
ter of order 20, we can notice that the best values of
maximum and average pass band ripple was obtained
by PM. However, the average pass band ripple of the
filters designed by BA is only slightly higher. Regard-
ing the stop band, the PSO presented higher values
for the maximum and average ripple than PM. The
BA obtained the best average stop band ripple. The
PSO and BA obtained smaller values for the transi-
tion width than PM. The BA presented the best per-
formance considering this last parameter.
Regarding the LP FIR filters of order 24, the max-
imum and average values of the pass band ripples ob-
tained by PSO are higher than the same values ob-
tained by PM. The BA presented the best average
pass band ripple value. Considering the stop band, the
PM algorithm presented better results than PSO. The
BA obtained an average stop band ripple better than
PSO and only slightly higher than PM algorithm. The
PSO and BA obtained smaller values for the transi-
tion width than PM. The BA presented the best per-
formance considering this evaluation index for the LP
filter of order 24.
The Table 4 presents the maximum, mean, vari-
ICINCO2015-12thInternationalConferenceonInformaticsinControl,AutomationandRobotics
210
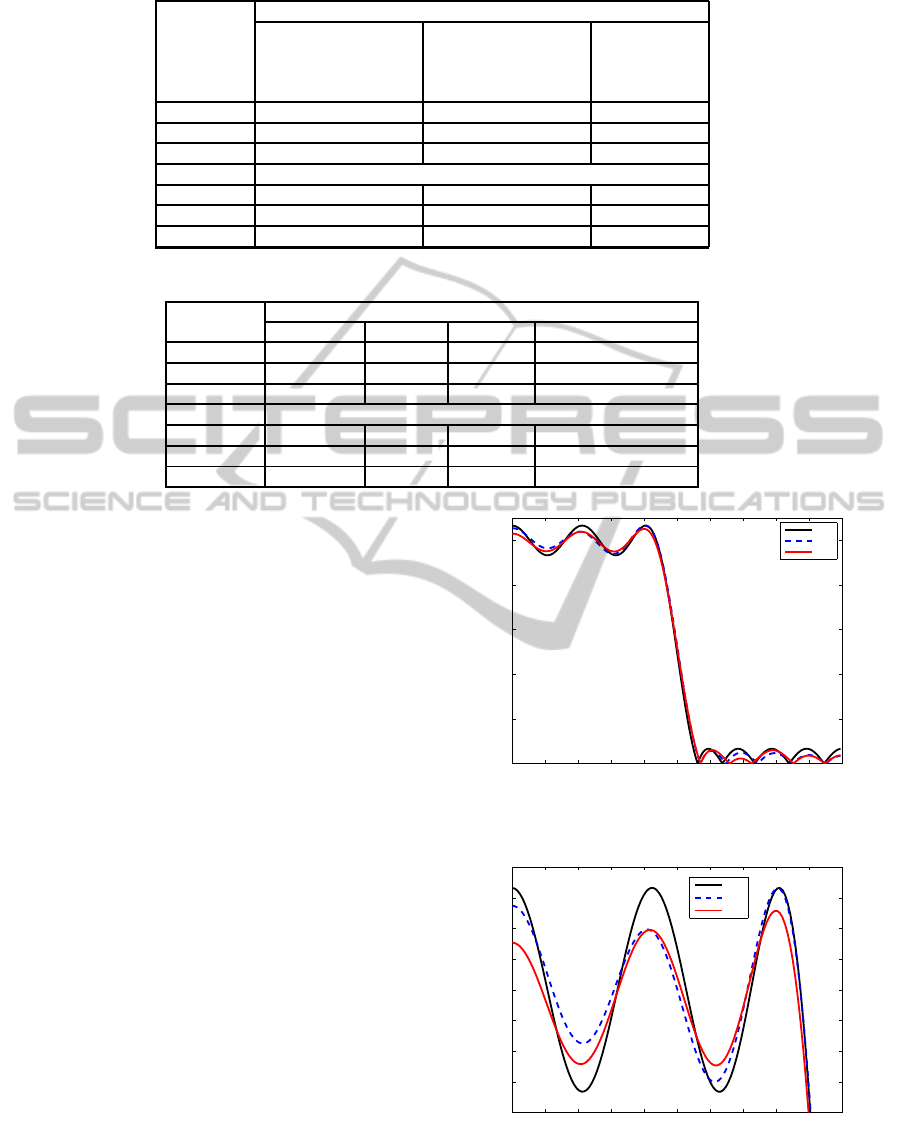
Table 3: Comparative results of performance parameters for the LP FIR filters.
Algorithm
LP filter of order 20
Max, average Max, average Transition
pass band stop band width
ripple ripples (normalized)
(normalized) (normalized)
PM 0.066452, 0.066452 0.066514, 0.066514 0.13297
PSO 0.091927, 0.071713 0.091673, 0.072021 0.12321
BA 0.098898, 0.067153 0.084058, 0.064921 0.11204
LP filter of order 24
PM 0.045192, 0.045192 0.045033, 0.045033 0.090225
PSO 0.068548, 0.052805 0.073533, 0.052655 0.072856
BA 0.054303, 0.038822 0.075469, 0.045328 0.071878
Table 4: Statistical parameters of stop band attenuation.
Algorithm
Order 20
Maximum Mean Variance Standard Deviation
PM 23.5417 23.5417 – –
PSO 20.7552 22.8866 0.62149 0.78835
BA 21.5084 23.7845 0.55516 0.74509
Order 24
PM 26.9293 26.9293 – –
PSO 22.6704 25.6322 1.0551 1.0272
BA 22.4446 26.9313 0.95559 0.97754
ance and standard deviation for dB attenuation in the
filters stop band. For the order 20 filters, PSO ob-
tained a maximum attenuation of 20.7552 dB and
mean attenuation of 22.8866 dB. The BA filters ob-
tained a maximum attenuation of 21.5084 dB and
mean attenuation of 23.7845 dB. Considering the or-
der 24 FIR filters, PSO obtained a maximum attenua-
tion of 22.6704 dB and mean attenuation of 25.6322
dB. The BA filters obtained a maximum attenuation
of 22.4446 dB and mean attenuation of 26.9313 dB.
The BA obtained smaller values of variance and stan-
dard deviation than PSO.
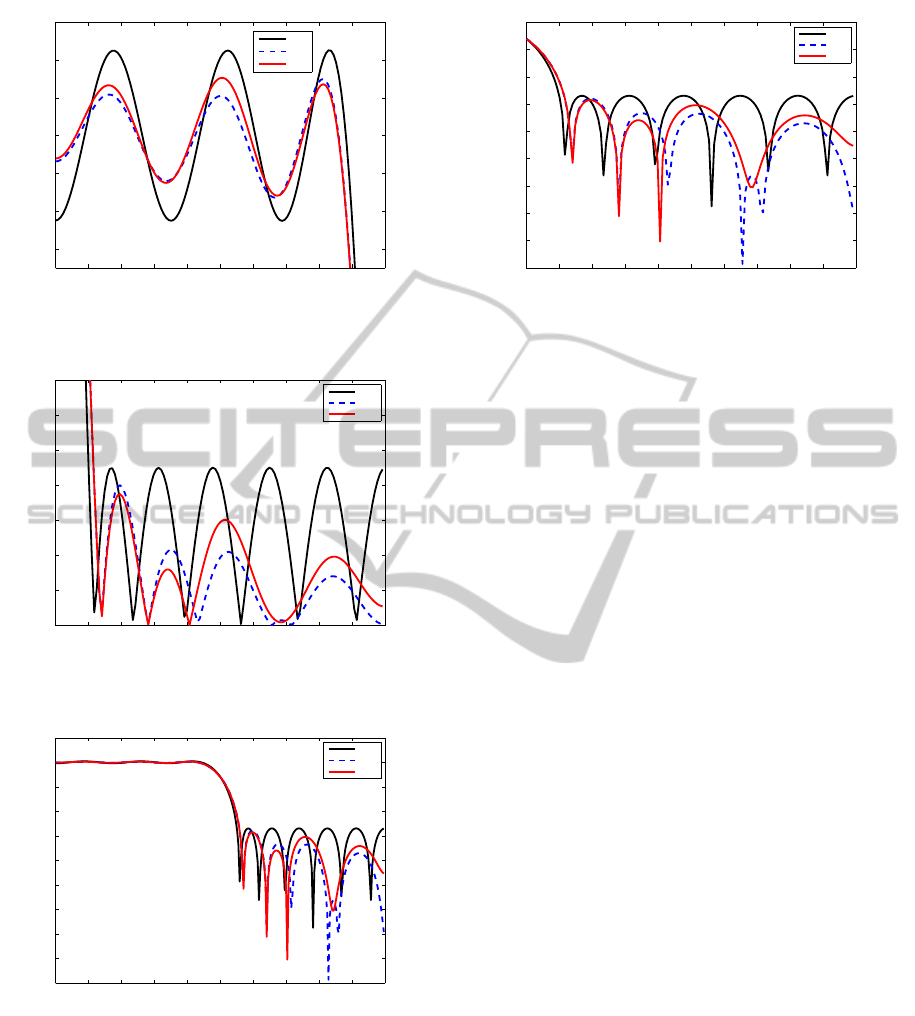
The Figures 2–11 illustrates the magnitude re-
sponse for the best filters found by PSO and BA .
Figures 2 and 7 shows the normalized magnitude re-
sponse for LP FIR filters of order 20 and 24, re-
spectively. Figures 3 and 8 presents the normalized
magnitude response of the pass band. The normal-
ized magnitude response of the stop band is shown in
Figures 4 and 9. The magnitude response in dB can
be seen in Figures 5 and 10, and the magnitude re-
sponse in dB of the stop band is illustrated in Figures
6 and 11.
In Figure 3 we can notice that the pass band rip-
ple of the best LP FIR filter of order 20 designed by
PSO is slightly smaller than PM, and the BA obtained
the best result regarding this performance parame-
ter. The smallest stop band ripple was obtained by
PSO, followed by BA. This is confirmed by Figure 6
that demonstrates that the highest attenuation was ob-
tained with the LP FIR filter designed by PSO.
For the LP FIR filter of order 24, the Figure 8 il-
0 0.1 0.2 0.3 0.4 0.5 0.6 0.7 0.8 0.9 1
0
0.2
0.4
0.6
0.8
1
Frequency
Magnitude (Normalized)
PM
PSO
BA
Figure 2: Normalized plot for the low pass FIR filter of
order 20.
0 0.05 0.1 0.15 0.2 0.25 0.3 0.35 0.4 0.45 0.5
0.92
0.94
0.96
0.98
1
1.02
1.04
1.06
1.08
Frequency
Magnitude (Normalized)
PM
PSO
BA
Figure 3: Normalized pass band ripple plot for the low pass
FIR filter of order 20.
lustrates that the pass band ripple of the best filters
designed by PSO and BA is better than PM. The BA
OptimalDesignofDigitalLowPassFiniteImpulseResponseFilterusingParticleSwarmOptimizationandBatAlgorithm
211
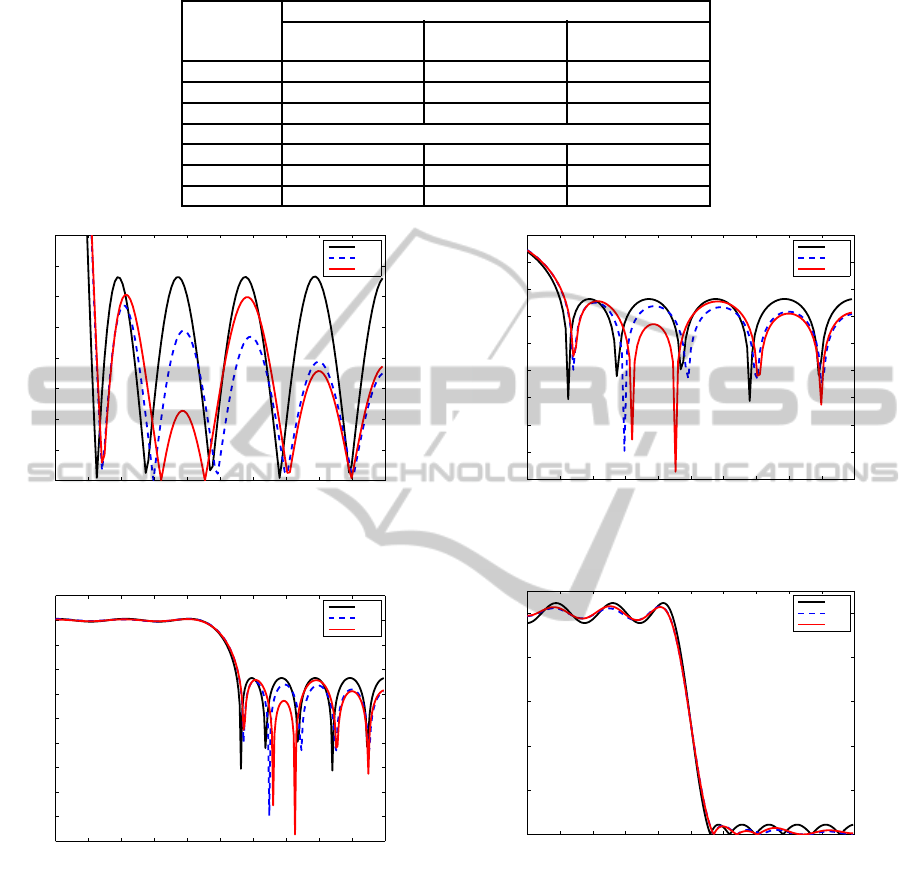
Table 5: Performance Parameters for the best LP FIR filters.
Algorithm
Order 20
Pass band ripple Stop band ripple Stop band ripple
(normalized) (normalized) (dB)
PM 0.066452 0.066514 23.5417
PSO 0.066192 0.057021 24.8792
BA 0.051466 0.060571 24.3547
Order 24
PM 0.045192 0.045033 26.9293
PSO 0.032841 0.040016 27.9554
BA 0.031851 0.040027 27.9529
0.5 0.55 0.6 0.65 0.7 0.75 0.8 0.85 0.9 0.95 1
0
0.01
0.02
0.03
0.04
0.05
0.06
0.07
0.08
Frequency
Magnitude (Normalized)
PM
PSO
BA
Figure 4: Normalized stop band ripple plot for the low pass
FIR filter of order 20.
0 0.1 0.2 0.3 0.4 0.5 0.6 0.7 0.8 0.9 1
−90
−80
−70
−60
−50
−40
−30
−20
−10
0
10
Frequency
Magnitude (dB)
PM
PSO
BA
Figure 5: Magnitude (dB) plot for the low pass FIR filter of
order 20.
obtained the best result for this performance param-
eter. The smallest stop band ripple was obtained by
the filter designed by BA, followed by PSO. This is
confirmed in Figure 11 that demonstrates that the best
BA LP FIR filter presented the highest attenuation.
Some performance parameters of the best LP FIR
filters designed by PSO and BA are presented in Table
5: normalized pass band ripple, normalized stop band
ripple and stop band ripple in dB.
0.5 0.55 0.6 0.65 0.7 0.75 0.8 0.85 0.9 0.95 1
−90
−80
−70
−60
−50
−40
−30
−20
−10
0
Frequency
Magnitude (dB)
PM
PSO
BA
Figure 6: Magnitude (dB) plot for the stop band of low pass
FIR filter of order 20.
0 0.1 0.2 0.3 0.4 0.5 0.6 0.7 0.8 0.9 1
0
0.2
0.4
0.6
0.8
1
Frequency
Magnitude (Normalized)
PM
PSO
BA
Figure 7: Normalized plot for the low pass FIR filter of
order 24.
5 CONCLUSIONS
In this work the traditional Particle Swarm Optimiza-
tion and the Bat Algorithm were adopted to opti-
mal adjust the coefficients of a low pass FIR filter.
The performance of these metaheuristics were com-
pared with the Parks and McClellan algorithm, a well
known and succeeded deterministic technique to de-
sign digital filters. The simulation results demon-
strated that PSO and BA are also efficient approaches
to solve the problem of filter design. The average
ICINCO2015-12thInternationalConferenceonInformaticsinControl,AutomationandRobotics
212
0 0.05 0.1 0.15 0.2 0.25 0.3 0.35 0.4 0.45 0.5
0.94
0.96
0.98
1
1.02
1.04
1.06
Frequency
Magnitude (Normalized)
PM
PSO
BA
Figure 8: Normalized pass band ripple plot for the low pass
FIR filter of order 24.
0.5 0.55 0.6 0.65 0.7 0.75 0.8 0.85 0.9 0.95 1
0
0.01
0.02
0.03
0.04
0.05
0.06
0.07
Frequency
Magnitude (Normalized)
PM
PSO
BA
Figure 9: Normalized stop band ripple plot for the low pass
FIR filter of order 24.
0 0.1 0.2 0.3 0.4 0.5 0.6 0.7 0.8 0.9 1
−90
−80
−70
−60
−50
−40
−30
−20
−10
0
10
Frequency
Magnitude (dB)
PM
PSO
BA
Figure 10: Magnitude (dB) plot for the low pass FIR filter
of order 24.
band ripples of the filters designed by these tech-
niques are close to the ones obtained by PM algo-
rithm, with the closest results being presented by BA.
Regarding the best LP FIR filters designed by the
metaheuristics evaluated in this work, the bat algo-
rithm presented better results for pass band ripple and
transition width than PSO and PM. The best FIR filter
designed by PSO obtained the smallest pass band rip-
0.5 0.55 0.6 0.65 0.7 0.75 0.8 0.85 0.9 0.95 1
−90
−80
−70
−60
−50
−40
−30
−20
−10
0
Frequency
Magnitude (dB)
PM
PSO
BA
Figure 11: Magnitude (dB) plot for the stop band of low
pass FIR filter of order 24.
ple, but BA presented a close value for this same per-
formance parameter. Therefore, the simulation results
presented in this work demonstrated that the best LP
FIR filters of order 20 and 24 were designed by BA.
Once the PSO also have presented satisfactory results,
both metaheuristic algorithms analyzed can be con-
sidered efficient optimizers to solve the problem of
digital filters design. In future works, another meta-
heuristics and deterministic methods will be consid-
ered in order to realize a more extensive comparison
between methods that can be used to project FIR and
IIR digital filters. We also expect to evaluate the use
of different objective functions for this problem.
REFERENCES
Ababneh, J. I. and Bataineh, M. H. (2008). Linear phase
fir filter design using particle swarm optimization
and genetic algorithms. Digital Signal Processing,
18(4):657–668.
Ho, Y.-C. (2001). Simple explanation of the no free lunch
theorem of optimization. In Proceedings of the 40th
IEEE Conf. on Decision and Control, volume 5, pages
4409–4414, Orlando, FL.
Kennedy, J. and Eberhart, R. (1995). Particle swarm opti-
mization. In IEEE Int. Conf. Neural Netw., volume 4,
pages 1942–1948, Perth, WA.
Litwin, L. (2000). Fir and iir digital filters. IEEE Potentials,
19(4):28–31.
Mandal, S., Ghoshal, S. P., Kar, R., and Mandal, D. (2012a).
Design of optimal linear phase fir high pass filter us-
ing craziness based particle swarm optimization tech-
nique. Journal of King Saud University - Computer
and Information Sciences, 24(1):83–92.
Mandal, S., Ghoshal, S. P., Mukherjee, P., Sengupta, D.,
Kar, R., and Mandal, D. (2012b). Design of optimal
linear phase fir high pass filter using improved particle
swarm optimization. ACEEE Int. J. on Signal & Image
Processing, 3(1):5–9.
OptimalDesignofDigitalLowPassFiniteImpulseResponseFilterusingParticleSwarmOptimizationandBatAlgorithm
213

Najjarzadeh, M. and Ayatollahi, A. (2008). A comparison
between genetic algorithm and pso for linear phase
fir digital filter design. In 9th International Confer-
ence on Signal Processing, pages 2134–2137, Beijing,
China.
Ouadi, A., Bentarzi, H., and Recioui, A. (2013). Optimal
multiobjective design of digital filters using spiral op-
timization technique. Springer Plus, 2(461).
Parks, T. and McClelland, J. (1972). Chebyshev approxima-
tion for nonrecursive digital filters with linear phase.
IEEE Trans. Circuit Theory, 19(2):189–194.
Saha, S. K., Kar, R., Mandal, D., and Ghoshal, S. P. (2013).
Adaptive particle swarm optimization for low pass fi-
nite impulse response filter design. In International
Conference on Communication and Signal Process-
ing, pages 19–23, Melmaruvathur, India.
Saha, S. K., Mukherjee, S., Mandal, D., Kar, R., and
Ghoshal, S. P. (2012). Gravitational search algorithm
in digital fir low pass filter design. In Third Interna-
tional Conference on Emerging Applications of Infor-
mation Technology (EAIT), pages 52–55, Kolkata, In-
dia.
Singh, T. and Josan, H. S. (2014). Design of low pass dig-
ital fir filter using cuckoo search algorithm. Interna-
tional Journal of Engineering Research and Applica-
tions, 4(8):72–77.
Yang, X. S. (2010). A new metaheuristic bat-inspired al-
gorithm. In Gonz´alez, J. R., Pelta, D. A., Cruz,
C., Terrazas, G., and Krasnogor, N., editors, Na-
ture Inspired Cooperative Strategies for Optimization
(NICSO 2010), volume 284, pages 65–74. Springer
Berlin Heidelberg.
ICINCO2015-12thInternationalConferenceonInformaticsinControl,AutomationandRobotics
214
