
The University as EV Ecosystem Hub
Education and Outreach to Accelerate EV Adoption
Dunbar P. Birnie III
Department of Materials Science and Engineering, Rutgers University, New Brunswick, New Jersey, U.S.A.
Keywords: Energy Systems Education, EV Ecosystem, Workplace Charging Infrastructure, EV Adoption Acceleration,
Commuter Transportation Electrification.
Abstract: The author’s university location is being developed as an alternative-fuelled-vehicle “ecosystem” that is
serving both educational and research missions. In addition, it is assisting with gradual transition from
gasoline-powered private vehicles to PHEV and EV thereby providing real positive regional environmental
impacts. By highlighting the early phases of this transformation locally and including students in the
discussion we hope to assist in accelerating this transformation for the future. This paper surveys our present
status and provides data on the usage patterns as well as on the costs and practical difficulties encountered
when considering hardware installation and making site selection.
1 INTRODUCTION
EV’s fit into a future where we envision pervasively
installed renewable electricity generation (wind and
solar) allowing for substantial reduction of fossil
fuel usage for transportation. We already see a steep
increase in the number of plug-in vehicles on the
road, as shown graphically in Figure 1, showing
cumulative vehicle sales in the US, with around
10,000 new vehicles being added per month. Still,
this has to be considered the “early adopter” phase
of this technology transformation. Many of the
available vehicles are aimed at higher price points
and are commensurate with the early-stage battery
costs, though these costs are expected to come down
substantially as manufacturing scale is increased.
Another key aspect in this transformation is the
infrastructure changes that will also be required to
facilitate the practical use of this rapidly growing
population of vehicles. This is much more
problematic since we are talking about electrical
installations at high voltage with many safety and
usage considerations.
This technology transformation has begun and
should be showcased to students who will be the
future technology innovators and civic leaders who
will participate in the continuing transformation into
the foreseeable future. To provide this educational
angle our university has chosen to make our campus
location into a visible ecosystem of activity,
involving both educational and research initiatives,
and therefore is actively participating in the
furtherance of this transformation. The next section
surveys the many reasons why EV’s must naturally
be central to the world’s energy usage for the future.
Further sections examine how our university’s
activities can connect into educational, research,
infrastructure, and policy themes – all related to the
future transportation/energy transformation.
Included in this discussion are data measured during
the last two years of on-campus EV charging, which
provide a baseline for future growth of our
ecosystem.
Figure 1: Cumulative US PEV Sales by month showing
steady growth beginning in 2012 (EPIC 2014).
90
P. Birnie III D..
The University as EV Ecosystem Hub - Education and Outreach to Accelerate EV Adoption.
DOI: 10.5220/0005488000900097
In Proceedings of the 1st International Conference on Vehicle Technology and Intelligent Transport Systems (VEHITS-2015), pages 90-97
ISBN: 978-989-758-109-0
Copyright
c
2015 SCITEPRESS (Science and Technology Publications, Lda.)

2 BACKGROUND
The future transportation transformation requires
new electric and hybrid vehicles as well as critical
modifications to the electrical distribution network
to allow convenient charging. These changes are not
easy and many pro and con claims are made about
air quality impacts, energy cost aspects, and usage
parameters. To assess these objectively we have
been studying EV usage on campus and advocating
for expansion of the EVSE infrastructure. In this
section the “carbon-footprint” impacts of EV use are
surveyed, followed by a discussion of possible
battery-storage value propositions enabled by broad
EV adoption.
Many discussions about the possible pros and
cons of electric transportation fall back on gut
instincts and worries about the carbon footprint of
the electric generation side of the picture. The
electricity needed must certainly be generated
somewhere and with some kind of fuel, often fossil
fuel. Using US Department of Energy data on the
energy usage we can learn that coal, natural gas, and
nuclear are the most significant contributing sources
of energy for electricity generation, but each has
significantly different carbon-footprint
contributions. Further, it comes as no surprise that
there is significant regional variation in the fuel-mix
used for electricity generation – and that would then
influence the net carbon-footprint for electric
transportation on a regional comparison basis. The
Union of Concerned Scientists have done a close
analysis of the regional variations in electricity
generation mix and applied that to electric vehicle
transit efficiency (Anair and Mahmassani 2012).
Figure 2 shows their quantification, where darker
Figure 2: Equivalent gasoline mileage (miles per gallon)
required to match typical EV travel environmental impact
on a per-mile carbon footprint basis (Anair and
Mahmassani 2012).
regions have higher carbon-footprint electricity
generation and lighter regions have more renewable
generation. The MPG labels in each region are the
carbon-footprint “break-even point” values for
gasoline vehicles that would yield the same carbon
footprint as typical EV’s. Even in the highest
footprint regions (dark blue) the EVs are better than
a substantial majority of gasoline powered vehicles
currently on the road. In the light blue regions EVs
are substantially better than their conventional
cousins. For New Jersey specifically, a gasoline
vehicle would have to get 64 MPG to be equivalent
to typical EV travel. So, in round numbers for our
region, EV transportation provides perhaps a ~50%
reduction in carbon-footprint, depending on which
gasoline vehicles are replaced (and for many cases
provide a much better reduction than that).
A related question focuses on the full life-cycle
cost of new EVs that by necessity require larger and
larger batteries as we push for longer all-electric
range. This has an added factor that battery
manufacture also has energy and carbon-footprint
impacts. This also means that EVs are typically
more expensive at their initial purchase though
having substantially lower per-mile operating costs.
The life-cycle costs for different range EVs was
assessed by (Samaras and Meisterling 2008) who
found that over all the plug-in life-cycle impacts
were significantly lower than conventional vehicles
and that the relative battery size was a rather smaller
impact on the net system carbon footprint (see
Figure 3). This second finding is not too surprising
given that many vehicle-miles are covered in
relatively short trips, so the larger battery mainly has
impact for the subset of longer distance excursions.
Figure 3: Full life-cycle costs comparing different vehicle
types as noted: Conventional vehicle (CV), hybrid (non-
plug-in, e.g. Toyota’s Prius), and three variants of PHEV
with gradually larger all-electric range (Samaras and
Meisterling 2008). Blue line added to illustrate
approximate effect for NJ-region electricity footprint.
TheUniversityasEVEcosystemHub-EducationandOutreachtoAccelerateEVAdoption
91

The long-term environmental impacts of
electrification are bound to improve with time
because many regions have regulated utilities where
renewable energy generation is mandated (so-called
Renewable Portfolio Standards) and so the carbon-
footprint per mile will gradually get smaller with the
life of the car simply because the grid electricity will
be getting cleaner (Anair and Mahmassani 2012) as
opposed to gasoline vehicles, which tend to become
more polluting with age.
The economics and environmental aspects of
plug-in vehicle usage are important topics and cover
many situations and issues. Whenever a plug-in
vehicle is charging then it is adding to the
instantaneous electrical generation requirement from
the utility. And, since this is not typically a planned
or gradual electrical usage then it must be budgeted
against the more rapidly rampable generation
sources rather than the base load foundational
generation (which are usually not the zero-carbon-
footprint renewables like solar and wind). So the
time-of-day when vehicles are plugged in has
consequences for the cost of electricity generally,
and for the ability of the grid to provide the overall
need.
In addition to the simple charging aspects of
plug-in vehicles, it has been proposed that EV’s be
used for grid storage – essentially allowing
bidirectional charge/discharge usage, a system
which is called “Vehicle-to-Grid”, or V2G
(Kempton and Letendre 1997; Kempton and Tomic
2005; Tomic and Kempton 2007; Lund and
Kempton 2008). Implicit within the V2G concept is
the need for fleets of vehicles to be plugged into the
charging network for times when not in use for
regular driving. This then makes it possible for
smart systems to allocate the service instantaneously
with optimization aimed at maximizing economic
value while preserving comfortable driving range;
operation to minimize carbon footprint is also
imagined (though no battery system has yet been
devised with full 100% round-trip energy retention).
The V2G valuation is increased when the battery
size in the vehicle is increased because it becomes
possible to buy (at night) and sell (during the day)
larger quantities of electricity; and, it is possible
with a larger battery to provide a larger power
input/output to the grid for frequency regulation.
However, it has also been pointed out that these
larger batteries also necessitate the use of heavier
cars than we might otherwise need – and that
driving these heavier cars requires more energy as
well – essentially taxing the energy storage buy/sell
profits that might be possible when using a
stationary battery (Shiau, Samaras et al. 2009;
Viezbicke and Birnie 2011). The optimization of
V2G ultimately requires a large population of
vehicles plugged-in, infrastructure that is able to
monitor and control bidirectional power connection
to the grid, and smart algorithms that can reduce
overall cost and lower carbon-footprint system
wide. This is a classic “chicken-vs-egg” problem
balancing vehicle purchase and infrastructure
availability. As adoption accelerates we will reach a
tipping point where there are enough vehicles
connected that this economic model can move
forward. Thus, in the near-term we must be
examining policies and research efforts that can
accelerate the adoption and bring this new
transportation reality to fruition.
Our initial step in this direction was aimed at
making the connection between workplace solar
power generation and daytime-workplace plug-in
availability (Birnie 2009). Our “Solar-2-Vehicle”
concept thus highlighted that using combined
workplace and home charging that battery range
limitations are diminished substantially and a
greater fraction of travel can be electrically powered
(with a lower carbon-footprint per mile travelled).
This concept has been substantiated by testing
energy usage when trying to maximize the
utilization of workplace solar power (Birnie 2014).
With this background, the main campus of
Rutgers, The State University of New Jersey, has
selected this topic as a strategic initiative – where
research, education, and outreach can be combined
and will highlight this important technology
transformation as it moves forward. As a calibration
of our location, Figure 4 shows the one-way driving
distance between home and school for a
Figure 4: Cumulative probability of travel distance from
home to Rutgers campus using over 900 randomly-chosen
permit holders. About half of the Rutgers parking
population lives within 10 miles of their campus
destination.
VEHITS2015-InternationalConferenceonVehicleTechnologyandIntelligentTransportSystems
92

representative population of parking-permit holders
on campus; a one-way travel distance of 10 or 15
miles is easily handled by many current plug-in
vehicles in all-electric mode showing that work-
place plug-in is a useful stepping stone toward future
transportation electrification. The next section
presents a closer look at recent usage patterns for the
EV infrastructure now available on our campus.
3 ON-CAMPUS USAGE DATA
As noted above, the Solar-2-Vehicle project was
initiated with the intention of testing a specific
commuter operating mode for the plug-in vehicles in
connection with work-place solar power generation.
In addition, it was expected that this would highlight
the importance of solar power installations as
parking lot canopies and that other incidental data
would be gleaned from the usage patterns and
observations. This section provides a partial analysis
of the usage and different energy evaluations that
were achieved, to date.
The majority of detailed testing has been
conducted using a standard production 2012-Model
year Chevy Volt, which was kindly provided for
testing by the Rutgers EcoComplex, with further
support from the Rutgers Energy Institute (REI).
The Chevy Volt has a powertrain that is entirely
electric and a battery capacity of 16 KWH
(nominal). In addition, its standard configuration has
a gasoline powered electric generator, so even when
the battery has been drained the vehicle still has
sizeable range, though traveling on gasoline.
Generally, the vehicle power system uses electricity
first, though in cold weather it cycles back and forth
between gas and electric to protect the battery from
abuse (This operation is beyond the control of the
driver). Detailed commuter operation and data
logging commenced on December 13
th
, 2012 and all
travel information was logged during regular
commuting and other business travel during the
complete following year. Data logged included time
of day, external temperature, dashboard console
information on mileage, energy, and gasoline usage .
In addition, data were maintained on location of
plug-in power used as well as to log the various
other users of the plug-in spots on campus. Further,
the system data from the charging stations (through
ChargePoint and Blink) were gathered at intervals to
understand usage patterns and amounts of energy
provided by the Rutgers grid. These data were
digested to provide the various conclusions here and
in the following sections.
In total during the first year of testing 7809.0
miles of travel were logged. During this time 6197.5
of the miles were under battery-electric mode
(79.4%), while the remaining 1611.5 miles were
under gas-generator-powered mode (20.6%). For
this travel 1979 KWH of electricity was provided
from the Rutgers grid and 44.9 gallons of gasoline
were consumed. If we compare the travel under all-
electric mode with the electricity that has been
provided by charging then we can get a composite
number for the electric-drive efficiency at 3.13 miles
per KWH, averaging through the year. Figure 5
shows how the electric drive efficiency evolved
through the test-year with each data point derived
from each battery fill-up event. Notable reduction in
driving range is evident for winter season driving;
part of this is due to the energy required for cabin
climate control, but part is also likely due to
reduction in battery efficiency at colder
temperatures. Also, during the hotter parts of the
summer there were times of lower efficiency, which
again correlated with times where significant air
conditioning energy usage was experienced.
Figure 5: Miles travelled per KWH of energy metered at
grid source level, through the year 1 testing period.
The average electric-drive efficiency found above
was 3.13 miles per KWH based on the electricity
metered in. However, as this power was only used
after being stored in the battery we are able to assess
this “round-trip” storage efficiency. Figure 6 (next
page) shows a comparison of the energy received
from the meter (X-axis) and the energy metered out
of the battery during use and logged on the
dashboard/console (Y-axis) for each battery recharge
event through the test period. Assuming a simple
linear relationship then we measure an 83% round-
trip efficiency for the charge/discharge process,
averaging through the whole year. It is interesting to
note that this round-trip energy recovery ratio also
changed with season; the best values were typically
found during the colder seasons, suggesting that the
TheUniversityasEVEcosystemHub-EducationandOutreachtoAccelerateEVAdoption
93
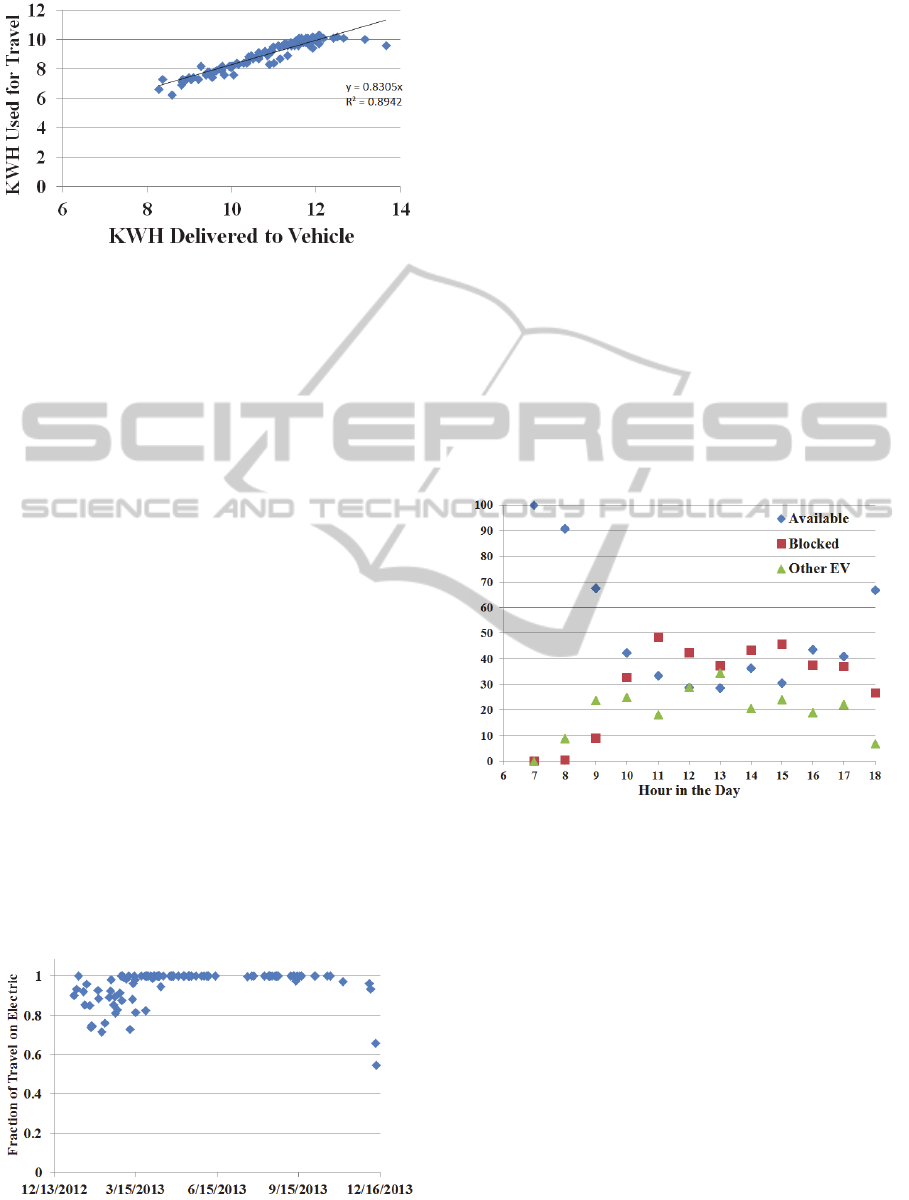
Figure 6: Round-trip electric energy recovery after storage
in the vehicle battery.
relatively complicated battery temperature
management system may add parasitic energy losses
that don’t get logged at the dashboard level
especially during the warmer parts of the year when
active cooling may be needed.
The EV range and its practical utilization for
basic commuting was the core concept for that first
year of testing. The project was aimed specifically at
testing the circumstances where it might be possible
to be a commuter who was able to fully utilize solar-
generated workplace parking/charging locations to
feed full round-trip commuting. Similarly this could
equally well substantiate the converse model: full-
electric commuting sourced at home from grid-
available electricity (which, for most commuters
would likely be taken at night). In either case the
times, distances, and traffic conditions would be the
same. Figure 7 shows the final performance metrics
related to the core hypothesis. For this plot a 40 mile
distance was used as the cut off. Clearly a majority
of the trips have been conducted entirely on
electricity, but in the colder seasons there are many
instances of commute cycles that required some
gasoline after the EV range was exhausted.
During the year of testing complete notes were
kept on the other users and congestion of the four
parking spaces and their connection to the charging
Figure 7: Fraction of simple round-trip commute cycles
powered completely by work-place-sourced electricity.
equipment. While the actual parking spot occupancy
measurement was only possible when I was there
(arriving, leaving, or moving the vehicle), the
connection logs downloaded from the ChargePoint
system provided further information about their
usage. These data were combined to help provide a
more complete picture of the utilization of the EVSE
at Rutgers during that full year.
The occupancy data were processed to provide
an hour-by-hour overview of the usage of the four
spots. To avoid confounding affects caused by
measuring my own utilization, the data reported
below are based on observations of the remaining
parking spots subject to the understanding that I was
typically occupying one of the spots already. Figure
8 shows how the parking space utilization was as a
function of time of day, where the data were
grouped as: “Available”, “Blocked” (meaning
occupied by a non-plug-in vehicle), and “Other EV”.
This chart shows a pattern that would be typical for
a university location: basically empty in the early
Figure 8: Probability of occupancy as a function of time of
day for the EV spots located by the School of Engineering.
The time groupings are rounded down: ie, the 9 O’Clock
entry includes all data points through 9:59.
morning, then with people leaving substantially by
6PM. And, we see pretty constant occupancy
throughout the day which might be expected for a
work-place location where most drivers stay for the
majority of the day, though clearly there is some
turnover. This shows a pretty steady usage, but the
“blocked” fraction is quite significant at around 30-
40% for most of the day. On average this is at least
one full parking spot prevented from access for most
of the day. The parking lot in question was heavily
used and during this time period there was no policy
in place for preferential usage by vehicles needing to
charge and no enforcement, though the signage was
clear that they were EV charging spots.
VEHITS2015-InternationalConferenceonVehicleTechnologyandIntelligentTransportSystems
94
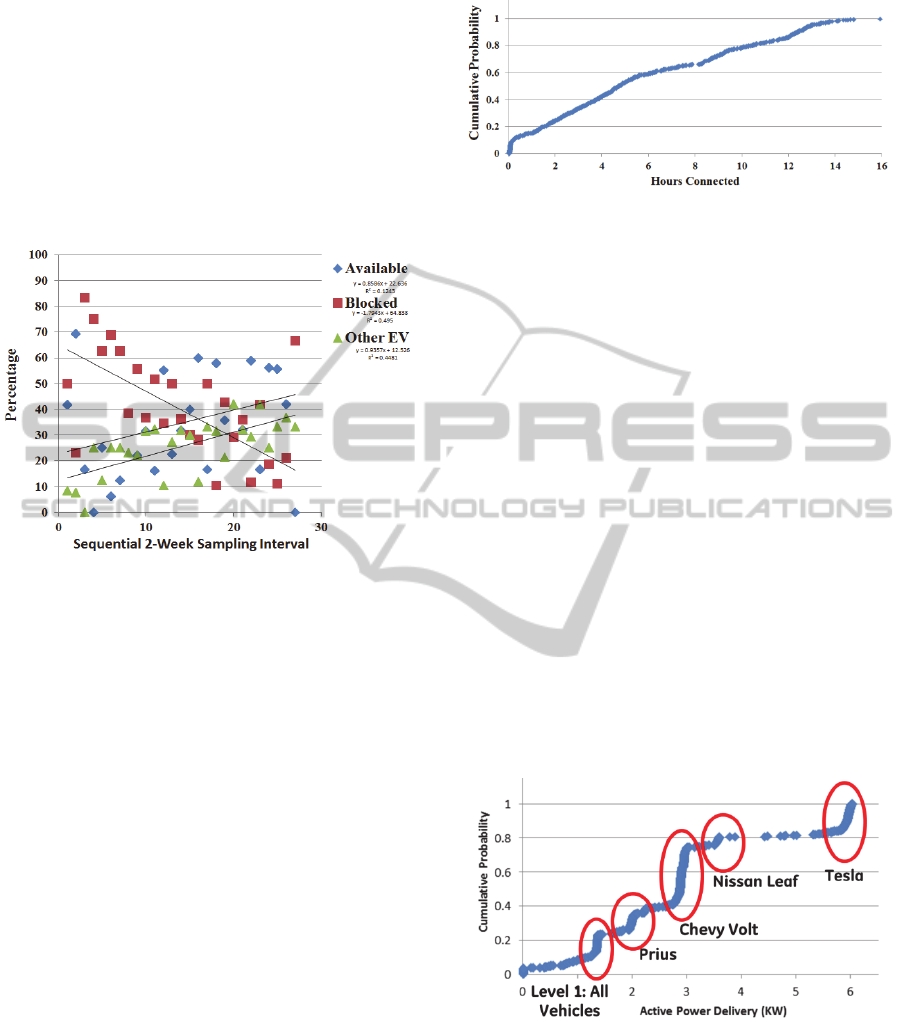
It is interesting to see how the usage changed
during the progress of the one year of study. So the
data were regrouped into 26 2-week intervals and
replotted as Figure 9. It is interesting to see that the
usage by EV’s increased significantly during this
year (which was also clear by the appearance of new
vehicles that hadn’t been system users when the
study commenced). And, the bigger change with
time is the reduction of blocking by non-EV parked
cars. While the signage is clear that preference
Figure 9: Parking spot congestion mapped through the
one-year test period. Other EV usage increased
significantly during this time.
should be given to EV’s, there is no specific penalty
and there has been no enforcement to date.
However, it seems that the population of non-EV
drivers at least has gradually recognized that there
are regular EV users and improved how they
preserve these spots for EVs.
Next we turn attention to the entire population of
EV users and their usage patterns. The ChargePoint
usage logs provide session information that includes
start and stop times, energy delivered (in KWH),
power selected (level 1 or level 2) and some other
basic stats. One key measure of the usage is the
amount of time that the plugs are “in-use” which is a
proxy measure for the length of time that the parking
space has been occupied. Figure 10 shows the
cumulative probability distribution as a function of
the length of time plugged in. Sessions which were
shorter than 2 minutes were not included as these
were often incorrectly initiated or were restarted
immediately after. The distribution shape still has a
population of around 10% of sessions that have been
between 2 and 10 minutes only (the nearly vertical
jog near the origin). After that EV users tend to stay
an hour or longer, but the very smoothly linear
region from 2 to 6 hours covers about 50% of the
sessions. There is a relatively significant grouping at
Figure 10: Duration of plug-in session plotted as a
cumulative probability distribution. Sessions shorter than
2 minutes were not included. The usage is widely and
continuously varying including shorter and longer times.
8-9 hours plug-in time (many of which were plug-in
events associated with the present study). The
gradual sloping up from 2 to 6 hours might be
consistent with events caused by a full-time
employee who needed to attend a meeting on a
different location on campus or went out for lunch
but returned for continued charging later in the day.
These would likely happen at different enough times
that it would have combined to give the shape seen.
Finally, we examined the energy delivered and
the effective duration of active charging to calculate
the power accepted by various vehicles during
charging. These data are shown in Figure 11. It is
not surprising that different vehicle types have
different battery sizes and therefore have electronics
that control the power at different levels. The Level
1 specification for our ChargePoint units is limited
to 16A but the current seems to be limited by the
vehicles at 12A operating at the standard 120V,
providing a comfortable safety margin.
Figure 11: Cumulative probability distribution of the
active power provided for each charging session. The
specific humps represent vehicle types as marked.
Thus, EV charging data collection and vehicle
performance studies can yield a wide range of
information about energy systems and the users of
these systems. This has added educational benefits
when students can participate in these studies, as
outlined in the next section.
TheUniversityasEVEcosystemHub-EducationandOutreachtoAccelerateEVAdoption
95

4 EDUCATIONAL IMPACTS
One key mission of universities is to educate the
future generation in their chosen career fields. An
equal and commensurate mission of universities is
the advancement of new knowledge. Faculty are
involved in research on the cutting-edge and
students are learning the ropes so they can graduate
with the most up-to-date understanding of the world.
So universities are natural places to investigate the
adoption of new technologies, and in this case, the
transformation of transportation from fossil fuels to
electricity. It is a huge effort that spans many
engineering fields, but also intersects with business
majors, supply chain, and social sciences in many
ways.
With our relatively new effort studying EV usage
patterns we have already had many chances to
intersect with students and develop further
understanding about EV usage. For example the
author teaches a solar device technology class with
thematic semester projects required of all students.
Recently one of these project assignments was
aimed at having the students design parking-lot
solar-arrays with the added feature of stationary
battery storage for storm resiliency. Also, one
engineering capstone design team is underway
examining electricity usage by EV fleet vehicles
being operated by the university – with the aim of
providing advice about recharging strategies and
understanding total cost of ownership for these new
vehicles.
EV data and energy strategies are also useful for
outreach in a variety of ways. For example the
author has given several presentations in the
“Energy Café” series organized by the Rutgers
Energy Institute. These are open to the public,
though mostly attract interested students.
In the future we expect students to be engaged in
research projects examining many facets of the
electrification of transportation in the region. For
example: Could EV’s be charged at the university’s
solar array during storm/grid failures and then used
for emergency delivery of power to critical facilities
in the region? This would build on our recent
probability model for guiding battery size for these
resilient power islands (Birnie 2014).
Also, could electric buses be used within the
sprawling university campus? What infrastructure,
performance and environmental impacts would
result (Rutgers maintains one of the largest bus
systems in the state of New Jersey).
Further, could “vehicle-to-grid” (V2G) systems
be fielded on or near campus? New variants of V2G
could be tested and evaluated within the context of a
large commuter population, both of students and for
faculty and staff. Again there are significant
infrastructure, logistics, and social changes that will
be required to allow for smooth operation of V2G
and other complicated energy systems in the future.
Already we are increasing our data gathering
capabilities and will be connecting these data with
driving habits, seasonal temperature variations, and
commuting routes. Our overall aim is to have
students involved in the data gathering, analysis, and
interpretation so that we can increase the impact for
regional transportation modification in the future.
5 INSTALLATION ISSUES
The transformation that we envision is hampered
significantly by the infrastructure needed to provide
power to growing numbers of commuters. The EV
charging hardware is only part of the story as
electric conduit may have to be laid and new circuits
added, depending on the location and anticipated
number of vehicles to be serviced. Up to this point
these infrastructure costs are quite a bit larger than
the value of the electricity that the vehicles receive.
Also, the EV equipment that we have installed so
far has been added with relatively little consideration
of the population of likely users and their charging
habits and how this impinges on the general
limitation on availability of parking. And, the
question of different usage patterns that will match
with Level 1, Level 2 or higher power rates has not
been clarified.
The best strategy will likely be to combine new
EV charging locations with new construction
projects and building renovations so that the
rewiring and new hardware can be made as cost-
effective as possible. And, there may be new ways
of co-funding for charging units that will be used
partly by the university fleet and partly by the
student/faculty/staff private vehicles. This is a wide-
open discussion that is evolving rapidly on campus
as we move this initiative forward.
6 POLICY CONNECTIONS
Our studies of electric transportation integrate the
technological (hardware and algorithms) with the
social (attitudes and behaviour patterns). In many
cases these combined socio-technological changes
will be assisted by policy choices that we make
VEHITS2015-InternationalConferenceonVehicleTechnologyandIntelligentTransportSystems
96

along the way (local to campus, but also state and
federal policies, as well). For example, the IRS has
issued a ruling that electricity provided without cost
to employees in workplace charging is of “de
minimis” value and thus not a taxable benefit. And,
some regions have given EVs priority in the High
Occupancy Vehicles (HOV) lane, providing
encouragement for rush-hour commuters to change
to electric-drive vehicles.
Another gradual policy push will come from the
steadily increasing fuel efficiency standards imposed
on car manufacturers, thus giving preference to
electric vehicles that can take advantage of
regenerative braking and generally have higher
effective fuel efficiencies.
And, we have certainly seen that local policy
choices have had an influence on EV usage patterns
(for example the EV-only parking space interference
by gasoline vehicles when no enforcement policy
was in effect).
In the long run we hope to establish local
policies that encourage our community to rely on
EVs for commuting to campus and to appreciate the
environmental advantage provided by moving from
gasoline to electricity.
7 CONCLUSIONS
Large university campus locations are ideal for
installing, studying, using, and developing
technology needed for the coming transition to
pervasive electric personal transportation. The
involvement of students in these studies and in the
classroom provides an excellent chance for the
future leaders of our country (our students) to
interact with the technology in the formative stages
of their lives and then eventually participate in the
continuation of this transition when they join the
workforce.
ACKNOWLEDGEMENTS
Vehicle testing on campus has been sponsored by
the Rutgers EcoComplex and the Rutgers Energy
Institute. Additional support through the McLaren
Endowment at Rutgers is also greatly appreciated.
REFERENCES
Anair, D. and A. Mahmassani (2012). State of Charge:
Electric Vehicles’ Global Warming Emissions and
Fuel-Cost Savings across the United States
http://www.ucsusa.org/assets/documents/clean_vehicl
es/electric-car-global-warming-emissions-report.pdf,
Union of Concerned Scientists.
Birnie, D. P. (2009). "Solar-to-vehicle (S2V) systems for
powering commuters of the future." Journal of Power
Sources 186(2): 539-542.
Birnie, D. P. (2014). "Optimal Battery Sizing for Storm-
Resilient Photovoltaic Power Island Systems." Solar
Energy 109: 165-173.
Birnie, D. P. (2014). Solar-2-Vehicle Project Annual
Report 2013. http://dx.doi.org/doi:10.7282/T32Z13V6.
EPIC. (2014). "Two Record Months of Electric Vehicle
Sales." from http://energypolicyinfo.com/2014/07/
two-record-months-of-electric-vehicle-sales/.
Kempton, W. and S. E. Letendre (1997). "Electric vehicles
as a new power source for electric utilities."
Transportation Research Part D-Transport and
Environment 2(3): 157-175.
Kempton, W. and J. Tomic (2005). "Vehicle-to-grid power
fundamentals: Calculating capacity and net revenue."
Journal of Power Sources 144(1): 268-279.
Lund, H. and W. Kempton (2008). "Integration of
renewable energy into the transport and electricity
sectors through V2G." Energy Policy 36(9): 3578-
3587.
Samaras, C. and K. Meisterling (2008). "Life Cycle
Assessment of Greenhouse Gas Emissions from Plug-
in Hybrid Vehicles: Implications for Policy."
Environmental Science & Technology 42(9): 3170-
3176.
Shiau, C. S. N., C. Samaras, et al. (2009). "Impact of
battery weight and charging patterns on the economic
and environmental benefits of plug-in hybrid
vehicles." Energy Policy 37(7): 2653-2663.
Tomic, J. and W. Kempton (2007). "Using fleets of
electric-drive vehicles for grid support." Journal of
Power Sources 168(2): 459-468.
Viezbicke, B. D. and D. P. Birnie (2011). "Understanding
Parasitic Energy Costs for PHEV Conversion Packs
as we Move toward V2G." International Journal of
Electric and Hybrid Vehicles 3: 309-317.
TheUniversityasEVEcosystemHub-EducationandOutreachtoAccelerateEVAdoption
97
