
The Impact of Ranking Information on Students’ Behavior and
Performance in Peer Review Settings
Pantelis M. Papadopoulos
1
, Thomas D. Lagkas
2
and Stavros N. Demetriadis
3
1
Aarhus University, Aarhus, Denmark
2
The University of Sheffield, City College, Thessaloniki, Greece
3
Aristotle University of Thessaloniki, Thessaloniki, Greece
Keywords: Peer Review, Free-Selection, Gamification, Computer Science Education, Motivation.
Abstract: The paper explores the potential of usage and ranking information in increasing student engagement in a
double-blinded peer review setting, where students are allowed to select freely which/how many peer works
to review. The study employed 56 volunteering sophomore students majoring in Informatics and
Telecommunications Engineering. We performed a controlled experiment, grouping students into 3 study
conditions: control, usage data, usage and ranking data. Students in the control condition did not receive
additional information. Students in the next two conditions were able to see their usage data (logins, peer
work viewed/reviewed, etc.), while students in the last group could additionally see their ranking in their
group according to their usage data. Results showed that while the three groups were comparable, a range of
different attitudes were visible in the Ranking group. Students with more positive attitude towards ranking
were more engaged and outperformed their fellow students in their group.
1 INTRODUCTION
This study explores the potential of ranking
information, as a type of gamification approach, in
enhancing student engagement and performance in a
peer review setting. Peer review is a popular
instructional approach with a plethora of applied
approaches found in the literature, able to support
both the acquisition of domain knowledge and the
development of higher level skills related to
reviewing. Although studies on peer review are
primarily focused on higher-level learning skills
such as analysis, synthesis, and evaluation
(Anderson & Krathwohl, 2001), there are also
reported benefits on lower level learning (e.g.,
introductory knowledge) (e.g., Turner, Pérez-
Quiñones, Edwards, & Chase, 2010). Peer review
engages students in a constructive and collaborative
learning activity (McConnell, 2001) stimulating and
guiding higher cognitive processes of learning
(Scardamalia & Bereiter, 1994). This is why the
method has been used extensively in various fields
such as second language writing (Hansen & Liu,
2005; Lundstrom & Baker, 2009), statistics (Goldin
& Ashley, 2011), and computer science (Liou &
Peng, 2009; Luxton-Reilly, 2009), our domain in
this study.
Researchers refer to the roles students play in
peer review as “assessors vs. assessees” (Li, Liu, &
Steckelberg, 2010) or “givers vs. receivers”
(Lundstrom and Baker, 2009) and report different
learning outcomes identified for these two different
peer roles. For example, Li et al. (ibid.) report that
the quality of students’ final projects exhibited a
significant relationship to the quality of peer
feedback they provided, while no such relationship
was identified for students receiving feedback.
Similarly, Lundstrom and Baker (ibid.) conclude
that students who reviewed their peers’ writings
were significantly benefited in their own writing,
outperforming those students who only received
peer feedback.
Our interest in the peer review method is focused
on settings where students are to select freely which
peer work to review, without an instructor, a system,
or a method assigning specific work to them. We
refer to this instantiation of the peer review method
as Free-Selection review protocol and it will be the
backdrop of our current study. We have explored the
potential of Free-Selection in previous studies
(Papadopoulos, Lagkas, & Demetriadis, 2012;
2015), showing that when students are allowed to
139
M. Papadopoulos P., D. Lagkas T. and N. Demetriadis S..
The Impact of Ranking Information on Students’ Behavior and Performance in Peer Review Settings.
DOI: 10.5220/0005472801390147
In Proceedings of the 7th International Conference on Computer Supported Education (CSEDU-2015), pages 139-147
ISBN: 978-989-758-107-6
Copyright
c
2015 SCITEPRESS (Science and Technology Publications, Lda.)

select which peer work to review, they tend to
provide feedback to more fellow students than the
required minimum and they read several peer works
before they make their selection. Thus, they are
exposed to a greater range of different perspectives.
Eventually, students in the Free-Selection condition
are able to acquire higher level of domain
knowledge and improve their reviewing skills more
than students that were randomly assigned peer
work. Other studies have also reported significant
benefits from allowing students to select freely
which peer work to review. Online systems such as
PeerWise (http://peerwise.cs.auckland.ac.nz/) and
curriculearn (http://curriculearn.dk/src/index.php),
both focusing on student-generated questions,
support peer review methods without limiting the
number of reviews a student can perform. In such
systems, students with higher grades tend to
contribute more than weaker students, thus resulting
in a greater amount of higher quality feedback being
produced (Luxton-Reilly, 2009).
However, in Free-Selection settings, the success
of the learning activity is heavily based on the level
of student engagement. One of the approaches often
used to keep students’ engagement high is
gamification. Deterding et al. (2011) define
gamification as the use of game design elements in
non-game contexts. Such elements could be winning
points, leaderboards, achievements and badges, and
ranking systems. Denny (2013), for example, reports
a highly significant positive effect on the quantity of
students’ contributions and the time they spent in
PeerWise, in an activity were a large number of
students (n>1000) were awarded virtual
achievement/badges for different levels of
participation in the PeerWise system (e.g., volume
of work submitted, volume of peer feedback
submitted, etc.).
In our context, an approach based on badges
would not be appropriate, since the population of the
students (usually 50-60) and the duration of a typical
online activity in a course (2-3 weeks) are not
enough to allow a high volume of peer work and
feedback to be produced. We decided to focus in this
study on ways to enhance students’ engagement in
peer review, by providing usage and ranking
information. Usage information refers to the effort
put by the students in the activity, as evident by the
number of logins in the learning environment used,
the number of peer submissions read, and the
number of reviews submitted. Ranking information
provides additional value to these data, by also
informing students on their relative position in the
group for each of the usage metrics. The study
examined whether this additional information would
trigger additional motives to the students, or whether
ranking information could have a detrimental effect
on students’ behavior.
2 METHOD
2.1 Participants
The course “Network Planning and Design” is a core
course, offered in the fourth semester of the 5-year
study program “Informatics and
Telecommunications Engineering” in a typical
Greek Engineering School. The course focuses on
analyzing clients’ needs, identifying system
specifications, and designing appropriate computer
networks. As such, it targets students with a strong
technical profile. The study employed 56 students
that volunteered to participate in the activity and
receive a bonus grade for the lab part of the course.
We randomly assigned the students into three study
conditions:
Control: 18 students (11 male, 7 female);
Usage: 20 students (11 male, 9 female);
Ranking: 18 students (10 male, 8 female).
Although the activity tasks were identical for all
students, the information presented to them differed.
Students in the Control group did not receive any
additional information on their activity, students in
Usage group received information on their personal
progress, while students in the Ranking group
received, additionally to the information of personal
progress, their current rankings in their groups.
2.2 Domain of Instruction
The domain of instruction was “Network Planning
and Design”, which is a typical ill-structured domain
characterized by complexity and irregularity. The
outcome of a NP&D technical process results from
analyzing user requirements and demands
compromise in balancing technology against
financial limitations (Norris & Pretty, 2000). The
network designer has to solve an ill-defined problem
set by the client. The role of the designer is to
analyze the requirements, which are usually not fully
specified, and follow a loosely described procedure
to develop a practical solution. Computer network
design involves topological design and network
synthesis, which are best conceived through
studying realistic situations. Students in Computer
Engineering learn to face realistic complex problems
CSEDU2015-7thInternationalConferenceonComputerSupportedEducation
140

and they can be greatly benefited by project-based
learning methods (Martinez-Mones et al., 2005).
2.3 Material
2.3.1 The Learning Environment
The learning environment eCASE was originally
designed as a generic platform, able to support
individual and collaborative learning in ill-structured
domains. The benefit of using a custom-made tool is
that we are able to tailor and modify the study
conditions to address our current research needs. For
example, different versions of the system have been
used in previous studies on scaffolding in case-based
learning (Demetriadis, Papadopoulos, Stamelos, &
Fischer, 2008), on students’ collaboration patterns in
CSCL (Papadopoulos, Demetriadis, & Stamelos,
2009), and on peer review settings (Papadopoulos,
Lagkas, & Demetriadis, 2012).
The system applies case-based instruction and
the material is organized into two categories, the
realistic open-ended scenarios that present the
problem context, and the past cases, providing
supporting material that allows students to address
the issues presented in the scenarios. The scenarios
referred to various installations of computer network
systems in new/restructured facilities. A number of
past cases were accompanying each scenario,
presenting similar past projects and highlighting
important domain factors, such as the cost of the
project, efficiency requirements, expansion
requirements, and the traffic type and end-users’
profile. Students in the study had to take into
account the specific conditions and the contexts
presented, and propose their own computer networks
as answers to the 3 available scenarios.
Regarding the review procedure and the
usage/ranking information presented to students, the
system carried the weight of collecting all
deliverables, granting students access to peer work,
and monitoring student activity throughout the study
phases. While having our own system allows us for
better control of the study, the system itself is not
part of the analysis.
2.3.2 Pre-Test and Post-Test
Students took two written tests. The pre-test
instrument had 6 open-ended questions on domain
knowledge (e.g., “How does knowledge on the end-
user profile of a network affect its architecture?”).
The purpose of the pre-test was to record students’
prior knowledge on the domain and provide a
reference point to our analysis. Similarly, the post-
test also focused on domain knowledge, including 3
open-ended questions (e.g., “What kind of changes
may occur in the architecture of a network, when the
expansion requirements are increased?”). The post-
test focused on the domain knowledge students
acquired through the study.
2.3.3 Attitude Questionnaire
At the end of the study, we asked students to fill out
an online questionnaire recording their opinions and
comments on different aspects of the activity, such
as: the identity of their reviewers, the effect of
usage/ranking data on their performance, the
helpfulness of peer comments, and the amount of
time they spend in each phase in the learning
environment. Students were able to address these
questions through a combination of open and closed-
type items.
2.4 Design
The study followed a pre-test post-test experimental
research design to compare the performance of the
three groups. The presentation of usage and ranking
information was the independent variable. Students’
performance in the environment, in the written tests,
and in their answers in the attitudes questionnaire
were the dependent variables. The study had 6
distinct phases: Pre-test, Study, Review, Revise,
Post-test, and Questionnaire.
2.5 Procedure
Figure 1 shows the sequence and the duration of
each phase. The study lasted 2 weeks, starting with
the written pre-test in the class. Right after, the
students gained access to the online learning
environment and started working (from wherever
and whenever they wanted) on the 3 scenarios and
the accompanying past cases. We allowed students 1
week to read all the material and submit their
descriptions of the 3 computer networks they
suggested. These are considered as “students’ initial
answers” to the scenarios.
At the end of the first week, students continued
with the Review phase that lasted 4 days. During
this period, the system allowed to students access to
all peer work (that is, peers’ initial answers) in the
same group. The peer review process was double-
blinded, and students were free to read and review as
many peer works they wanted, with a minimum
requirement of 1 review per scenario. The first few
TheImpactofRankingInformationonStudents'BehaviorandPerformanceinPeerReviewSettings
141

Figure 1: Activity phases.
Figure 2: Schematic representation of the answer grid. In this depiction, peer answer no.3 has been read and reviewed by
the user.
words (~150 characters) of all students’ initial
answers were presented in random order in a grid
formation along with icons showing whether an
answer has already been read (eye) and reviewed
(green bullet) by the user (Fig. 2).
Each time a student clicked on the “read more”
link of an answer, the system recorded the event and
presented the whole answer along with a review
form including guidelines and asking students to
analyze: (a) the basic points of the peer work, (b) the
quality of the provided argumentation, and (c) the
eloquence and clarity of the work.
Along with the comments, the reviewer had to
also suggest a grade according to the following 5-
step Likert scale: “1: Rejected/Wrong answer; 2:
Major revisions needed; 3: Minor revisions needed;
4: Acceptable answer; 5: Very good answer”.
As we mentioned earlier, the study tasks were
identical for all students in the three groups.
However, what differed was the additional
information they had available during the Review
and Revise phases. The selection of a usage metric
could imply to the students that this metric is related
to better outcomes. Since our objective was to
enhance engagement, we selected metrics that would
suggest to students to: (a) visit the learning
environment more often, (b) get more points of view
by reading what others said, and (c) provide more
feedback to peers. As such, during the Review
phase, students in the Usage and Ranking group
were able to see live results on:
The number of times they logged into the
learning environment;
The total number of peer work they have read;
The total number of peers work they have
reviewed.
It is important to underline that these 3 metrics did
not provide any additional information to the
students, since a meticulous student could keep track
of her activity during the study (of course, we did
not ask students to do so, nor we were expecting
them to do so). In addition to these metrics, students
in the Ranking group were also provided with
information by the system regarding their rankings
and their group’s mean values. This information was
something that students could not have calculated
themselves. In addition, chromatic code was used to
denote the quartile according to the ranking (1st:
green; 2nd: yellow; 3rd: orange; 4th: red).
After the Review phase was completed, no
further reviews were possible and the review
comments became available to the respective
authors. Students had 3 days in the Revise phase to
read the comments they received and revise their
initial work on the three networks as they considered
fit. Students that did not receive peer comment on a
submitted work had to fill out a self-review form
before they were allowed by the system to edit their
initial answer. The self-review form provided
students with guidance on how to analyze and
compare their work with that of others by: (a) listing
the components of their own network, (b) provide
appropriate argumentation for each component, (c)
grade themselves, and (d) identify and explain
intended revisions.
In order for the system to consider this phase
completed, all students had to submit a final version
of their answers for each scenario, even if no
revisions were made. In the beginning of the
Revision phase, one more metric was available to
the Usage and Ranking groups, the average scores
received from peers, along with the number of
CSEDU2015-7thInternationalConferenceonComputerSupportedEducation
142

Table 1: Example of what usage/ranking information students in each group were seeing.
Control Usage Ranking
metric
value value mean ranking
Number of logins in the environment 12 15 9.4 4th
Peer work viewed in total <no data> 9 6 13.9 17th
Peer work reviewed in total 5 5 4.5 6th
Score received from peers (no of peers) 3.8 (5) 3.1 (4) 3.4 11th
Table 2: Pre-test and post-test performance.
Control Usage Ranking
(scale: 0-10)
M SD n M SD n M SD n
Pre-test
2.11 (0.98) 18 1.98 (1.01) 20 2.02 (1.09) 18
Post-test
8.17 (1.01) 18 8.10 (0.96) 20 8.11 (0.93) 18
Table 3: Learning environment performance.
Control Usage Ranking
(scale: 1-5)
M SD n M SD n M SD n
Initial
2.94 (0.58) 18 3.12 (0.75) 20 2.80 (0.77) 18
Revised
3.44 (0.67) 18 3.64 (0.58) 20 3.49 (0.77) 18
received reviews. This was the one metric that
students could not affect. Table 1 presents an
example of the type of information students in the
three groups were seeing.
After the Review and Revise phases, the students
took a written post-test in class, followed by the
attitudes questionnaire that concluded the activity.
3 RESULTS
To avoid biases, students’ answer sheets of the pre
and post-test were mixed and blindly assessed by
two raters that followed predefined grading
instructions. For all statistical analyses a level of
significance at .05 was chosen. To validate the use
of the parametric tests, we investigated the
respective test assumptions and results showed that
none of the assumptions were violated. We
calculated the two-way random average measures
(absolute agreement) intraclass correlation
coefficient (ICC) for the raters’ scores, as a measure
of inter-rater reliability. Results showed high levels
of agreement in each variable (>0.8).
3.1 Written Tests
Table 2 presents students’ scores in pre and post-
test. Students were novices in the domain, scoring
very low in the pre-test instrument. In addition,
analysis of variance (ANOVA) results showed that
the three groups were comparable in pre-test
(p>.05), suggesting that the random distribution of
students in the three conditions we performed was
valid. To compare the outcomes in the three groups,
we performed one-way analysis of covariate, using
pre-test score as the covariate. Results, once again,
showed no statistical differences between the three
groups (p>.05).
3.2 Learning Environment
Table 3 presents students’ scores during the two
weeks of the activity in the learning environment
(Study, Review, and Revise phases). Scores
represent the average scores students received in the
3 scenarios. Raters used the same 1-5 scale as the
students did during the Review phase (1:
Rejected/Wrong answer; 2: Major revisions needed;
3: Minor revisions needed; 4: Acceptable answer; 5:
Very good answer).
One-way ANOVA results for the two variables
revealed no statistically significant differences
between the three groups (p>.05). This was expected
for the scores of Study phase, since the study
conditions were identical for all students. The lack
of statistical difference in the scores of the second
week, though, suggests that the use of usage/ranking
information did not provide a significant benefit to
the Usage and Ranking groups, although paired-
samples t-test results showed significant
improvement between the scores of the initial and
the revised submissions (p<.05) for all groups.
Finally, Table 4 presents students’ data on the four
usage metrics. Once again, result analysis showed
that the three groups were comparable.
TheImpactofRankingInformationonStudents'BehaviorandPerformanceinPeerReviewSettings
143
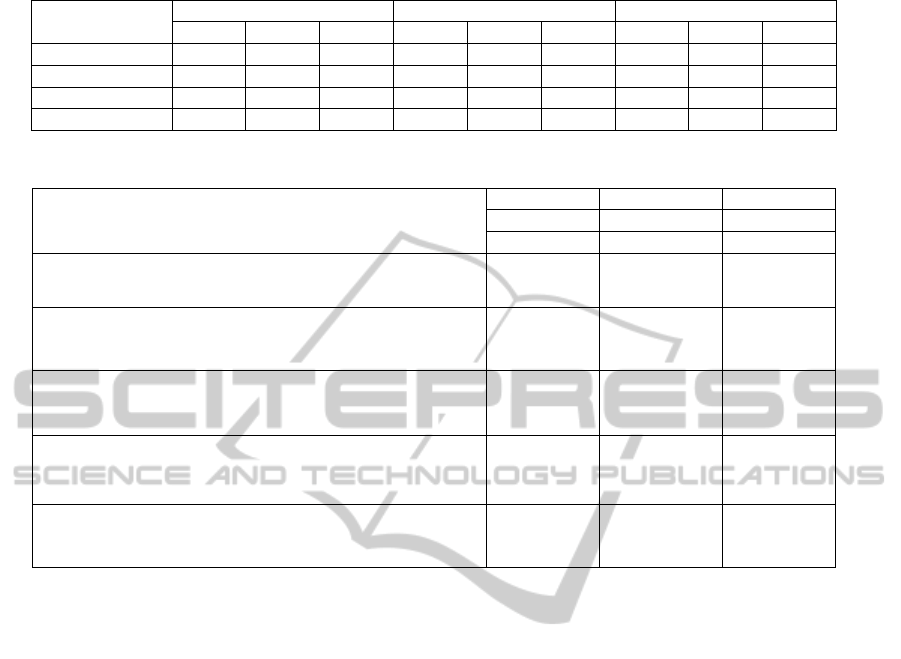
Table 4: Usage metrics performance.
Control Usage Ranking
M SD n M SD n M SD n
Logins
30.29 (12.90) 18 28.73 (14.02) 20 28.06 (14.44) 18
Views
12.54 (9.26) 18 11.47 (10.57) 20 14.31 (7.69) 18
Reviews
4.31 (1.02) 18 4.18 (1.21) 20 4.21 (0.93) 18
Peer Score
3.61 (0.89) 18 3.56 (0.91) 20 3.51 (1.10) 18
Table 5: Questionnaire responses.
Control Usage Ranking
(n=18) (n=20) (n=18)
M (SD) M (SD) M (SD)
Q1. Would you like to know the identity of your peers
that reviewed your answers? (1: No; 5:Yes)
1.70 (0.80) 1.95 (1.16) 1.84 (1.30)
Q2. How many hours did you spend approximately in
the activity during the first week (Study phase)? (in
hours)
10.08 (3.09) 10.12 (3.80) 9.59 (3.94)
Q3. How many hours did you spend approximately in
the activity during the second week (Review and Revise
phases)? (in hours)
2.48 (1.40) 2.33 (1.01) 3.31 (1.13)*
Q4. Would you characterize the usage information
presented during the second week as useful or useless?
(1: Useless; 5: Useful)
n.a. 4.33 (1.06) 4.26 (0.81)
Q5. Would you characterize the ranking information
presented during the second week as useful or useless?
(1: Useless; 5: Useful)
n.a. n.a. 3.53 (1.07)
3.3 Questionnaire
Table 5 presents students’ responses in the most
important items of the attitudes questionnaire.
Additionally, the students had to answer in open-
ended questions giving more details on the 5 items
mentioned in Table 5. Students did not express an
interest in knowing who submitted the reviews they
received (Q1). Out of the 56 students in the study,
only 4 asked to know the identity of the reviewers,
either because they were curious (n=3), or because
they had strong opinions against the reviews they
received (n=1).
We had asked the students to keep track of time
throughout the activity and report this time in the
questionnaire. We had already calculated an
estimation of time spent in the environment.
However, this estimation could have been skewed,
since there was no way to know whether an open
browser window meant that the student was actually
studying. We decided to keep the log data as
reference and compare them to the time students
self-reported. According to students’ responses, the
3 groups were comparable (p>.05) on the time spent
during the first week (Q2). On the contrary, students
in the Ranking group spent significantly more time
(F(2,53)=3.66, p=.03) in the learning environment
during the second week (Q3). The big drop between
the first and the second week was expected. During
the first week, students have to read a lot of material
and answer the scenario questions. On the contrary,
during the second week, students’ workload is
significantly lower, since peers’ answers are shorter,
while revising a scenario answer also takes less time
than writing an initial one.
Regarding the usefulness of the usage data
presented during the second week, almost all
students in Usage and Ranking groups had a positive
opinion, with only 3 students saying that they did
not pay attention to these and did not consider them
important for the activity (Q4). However, when
asked in an open-ended item of the questionnaire to
elaborate on the ways that this information helped
them, students stated that having these data was
rather “nice” and “interesting” than “useful”. The
consensus was being aware of usage data did not in
any way affect how they studied or understood the
material.
Students’ opinions were split, however, when
asked about the ranking information. The majority
of students (n=10) in the Ranking group had a
positive opinion (4:Rather Useful; 5:Useful), while 4
students said that this information was rather useless
(Q5). Students that had a positive opinion found
CSEDU2015-7thInternationalConferenceonComputerSupportedEducation
144

Table 6: Ranking sub-groups performance.
Logins* Views* Reviews Peer Score* Post-Test*
M SD M SD M SD M SD M SD
Indifferent (n=8)
21.88 (5.17) 10.50 (6.58) 4.00 (1.00) 2.89 (0.93) 7.53 (0.78)
InFavor (n=10)
33.78 (4.43) 18.22 (7.46) 4.45 (1.13) 3.83 (0.67) 8.59 (1.02)
ranking information more interesting and useful,
because, according to them, they could use this
information and improve their performance. For
example, a student in the top quartile said: “I liked
knowing my ranking in the group and it was
reassuring knowing that my peers graded my
answers that high.”
3.4 The Ranking Group
The different attitudes recorded by Q4 and students’
statements raised the need to further analyze
students’ performance and behavior in the Ranking
group. We divided the group into two subgroups: (a)
InFavor, including the 10 students with positive
opinions towards ranking (Q4), and (b) Indifferent,
including the rest 8 students that where either neutral
or negative against ranking. Table 6 presents the
subgroups’ performance in the learning environment
and the written post-test.
T-test result analysis showed that there was a
significant difference between the two subgroups in
the number of logins (t[16]=5.26, p=.00), the
number of peer work read (t[16]=2.29, p=.03), the
score they received from peers on the initial answers
(t[16]=2.49, p=.02), and the scores in the written
post-test (t[16]=2.42, p=.02). However, no
significant difference was recorded for the number
of reviews students submitted (p>.05). Since ranking
is based on the actual value of a metric, students in
the InFavor subgroup were usually on the top 10
positions in the Ranking group.
4 DISCUSSION
As we mentioned earlier, the selection of usage
metrics requires additional attention, because it
underlines to the students the aspects of the activity
that should be enhanced. The badges, reputation
scores, achievements, and rankings employed in
various cases are all aiming to enhance student
engagement and performance (e.g., submit this much
work/answer correctly this many questions in a
row/etc. to receive this badge). However, receiving a
badge or a high ranking position among their peers
does not change the study conditions for the
students. In that sense, achieving a higher
participation level in a learning activity is different
than doing the same in a company’s loyalty program
where, for example, reaching a higher level (e.g.,
becoming gold member of an airline company)
means receiving more benefits (e.g., additional
check-in luggage). Despite this, presenting students
with ranking information, badges, or reputation
points may still increase their intrinsic motivation
and result in deeper engagement. Of course, students
filter the learning activity and adapt it according to
their own goals and strategies, meaning that the
reaction towards ranking could vary.
This became apparent in the Ranking group of
the study. Students that explicitly stated an interest
for their rankings in their group were more active in
the learning environment and achieved higher scores
in the post-test. One interesting finding is that these
students also received significantly higher scores
from their peers in their initial answers in the
eCASE. Since, the initial answers were submitted
earlier during the Study phase, where no
usage/ranking information was available yet, we
could hypothesize that these students were also the
ones that had achieved higher levels of knowledge
or felt more comfortable in the learning activity. A
certain limitation of the study is that the comparison
of the InFavor and Indifferent subgroups is based on
a small population. Although statistical analysis
revealed significant differences in almost all the
study variables, we report these findings with
caution, suggesting that a study with larger
population could provide a better picture.
Contrary to the ranking information, usage data
were broadly accepted with a positive attitude from
students in the Usage and Ranking groups. However,
providing usage data alone was not enough for these
groups to outperform the Control group. Providing
only the values of the usage metrics without a
reference point related to the group was perceived as
“nice” but not enough to trigger different behaviors
of better performance. It was impossible for a
student to self-regulate and self-organize her activity
knowing only her personal usage data. This kind of
information could be useful in a longer activity
where the students would be able to monitor their
activity throughout different periods of time. In that
way, the reference point would be, for example, the
activity patterns of previous weeks.
TheImpactofRankingInformationonStudents'BehaviorandPerformanceinPeerReviewSettings
145

In performing a case-by-case analysis to get a
better picture on how rankings could have affected
students, we also identified cases that could be
problematic. Of course, even in the same sub-
groups, we found a range of different behaviors. For
example, there were students who discarded the
ranking information completely, students who tried
only in the beginning to keep up with the others, and
students who pursued a higher ranking until the end
of the activity. Introducing ranking information into
a learning activity could, in some cases, cause
negative results. Two students of the Indifferent
subgroup who expressed a negative opinion about
ranking in the questionnaire said that they did not
like the competitive aspect injected in the activity by
the rankings, and this was the reason they ignored
them completely. Checking the activity logs for
these two students and their scores in post-test, we
saw that they were both above the average of their
subgroup, while one of them was also in the top 10
positions in different usage metrics. On the opposite
side, a student of the InFavor group actively tried to
stay in the top positions throughout the activity and
she managed to do so for most of the metrics of the
study (Logins: 66; Views: 43; Reviews: 3; Peer
Score: 3.53; Post-test: 7.80). So, while this student
had visited the learning environment double the
times of the InFavor average and had viewed (or at
least visited) 43 out of the total 51 available peer
work, she only submitted the minimum number of
reviews and was well below average in the scores
she received on her initial answers from peers and
on the post-test from the two raters. From our point
of view, this student lost the actual focus of the
activity (acquire domain knowledge and develop
review skills) and focused on improving her
rankings. The short periods of time recorded for
each peer work view for this student also suggest
that her engagement in the activity was superficial.
This behavior is very close to what Baker et al.,
(2008) define as “gaming the system”, namely an
effort to succeed by actively exploiting the
properties of a system, rather than reaching learning
goals.
These three cases were the extremes in our
analysis, but they still provide insights into how
under certain circumstances ranking information
could have the opposite effect an instructional
designer is looking for. In addition to this, students
also mentioned that a low ranking in the Peer Score
would alarm them into improving their initial work,
while some students also mentioned that a high
position in this metric was reassuring. The issue here
lies on the fact that sometimes students’ and raters’
opinions about the quality of a work do not match.
Students that relied only on the ranking information
may be misled.
In conclusion, providing students with ranking
information could be beneficial for them, especially
when students develop a positive attitude towards
having this information. In these cases, students’
intrinsic motivation is increased and engagement is
enhanced. However, attention is also needed on how
students act during the learning activity. In certain
cases, chasing after rankings could cause negative
attitudes or superficial engagement.
REFERENCES
Anderson, L. W., & Krathwohl, D. R. (Eds.) (2001). A
Taxonomy for Learning, Teaching, and Assessing: A
Revision of Bloom's Taxonomy of Educational
Objectives. NY: Longman.
Baker, R., Walonoski, J., Heffernan, N., Roll, I., Corbett,
A., & Koedinger, K. (2008). Why Students Engage in
“Gaming the System” Behavior in Interactive
Learning Environments. Journal of Interactive
Learning Research. 19 (2), pp. 185-224. Chesapeake,
VA: AACE.
Demetriadis, S. N., Papadopoulos, P. M., Stamelos, I. G.,
& Fischer, F. (2008). The Effect of Scaffolding
Students’ Context-Generating Cognitive Activity in
Technology-Enhanced Case-Based Learning.
Computers & Education, 51 (2), 939–954. Elsevier.
Denny, P. (2013). The effect of virtual achievements on
student engagement. In Proceedings of the SIGCHI
Conference on Human Factors in Computing Systems,
ACM, 2013.
Deterding, S., Dixon, D., Khaled, R., & Nacke, L. (2011).
From game design elements to gamefulness: defining
"gamification". In Proceedings of the 15th
International Academic MindTrek Conference:
Envisioning Future Media Environments (MindTrek
'11). ACM, New York, NY, USA, 9-15.
Goldin, I. M., & Ashley, K. D., (2011). Peering Inside
Peer-Review with Bayesian Models. In G. Biswas et
al. (Eds.): AIED 2011, LNAI 6738, pp. 90–97.
Springer-Verlag: Berlin.
Hansen, J., & Liu, J. (2005). Guiding principles for
effective peer response. ELT Journal, 59, 31-38.
Li, L., Liu, X. & Steckelberg, A.L. (2010). Assessor or
assessee: How student learning improves by giving
and receiving peer feedback. British Journal of
Educational Technology, 41(3), 525–536.
Liou, H. C., & Peng, Z. Y. (2009). Training effects on
computer-mediated peer review. System, 37, 514–525.
Lundstrom, K., & Baker, W. (2009). To give is better than
to receive: The benefits of peer review to the
reviewer’s own writing. Journal of Second Language
Writing, 18, 30-43.
CSEDU2015-7thInternationalConferenceonComputerSupportedEducation
146

Luxton-Reilly, A. (2009). A systematic review of tools
that support peer assessment. Computer Science
Education, 19:4, 209-232.
Martinez-Mones, A., Gomez-Sanchez, E., Dimitriadis,
Y.A., Jorrin-Abellan, I.M., Rubia-Avi, B., & Vega-
Gorgojo, G. (2005). Multiple Case Studies to Enhance
Project-Based Learning in a Computer Architecture
Course. Education, IEEE Transactions on, 48(3), 482-
489.
McConnell, J. (2001). Active and cooperative learning.
Analysis of Algorithms: An Active Learning
Approach. Jones & Bartlett Pub.
Norris, M. & Pretty, S. (2000). Designing the Total Area
Network. New York: Wiley.
Papadopoulos, P. M., Demetriadis, S. N., & Stamelos, I.
G. (2009). Analyzing the Role of Students’ Self-
Organization in Scripted Collaboration: A Case Study.
Proceedings of the 8th International Conference on
Computer Supported Collaborative Learning – CSCL
2009 (pp. 487–496), Rhodes, Greece. ISLS.
Papadopoulos, P. M., Lagkas, T. D., & Demetriadis, S. N.,
(2012). How to Improve the Peer Review Method:
Free-Selection vs Assigned-Pair Protocol Evaluated in
a Computer Networking Course. Computers &
Education, 59, 182 – 195. Elsevier.
Papadopoulos, P. M., Lagkas, T. D., & Demetriadis, S. N.,
(2015). Intrinsic versus Extrinsic Feedback in Peer-
Review: The Benefits of Providing Reviews (under
review).
Scardamalia, M., & Bereiter, C. (1994). Computer support
for knowledge-building communities. The Journal of
the Learning Sciences, 3(3), 265-283.
Turner, S., Pérez-Quiñones, M. A., Edwards, S., & Chase,
J. (2010). Peer review in CS2: conceptual learning. In
Proceedings of SIGCSE’10, March 10–13, 2010,
Milwaukee, Wisconsin, USA.
TheImpactofRankingInformationonStudents'BehaviorandPerformanceinPeerReviewSettings
147
