
A Sensitivity Study of PMU-based Fault Detection on Smart Grid
Richard Barella
1
, Duc Nguyen
1
, Ryan Winter
1
, Kuei-Ti Lu
1
, Scott Wallace
1
, Xinghui Zhao
1
and Eduardo Cotilla-Sanchez
2
1
School of Engineering and Computer Science, Washington State University,
14204 NE Salmon Creek Ave., Vancouver, WA 98686, U.S.A.
2
School of Electrical Engineering and Computer Science, Oregon State University,
3023 Kelley Engineering Center, Corvallis, OR 97331, U.S.A.
Keywords:
Smart Grid, Sensitivity, Fault Detection, Accuracy, PMU Deployment.
Abstract:
Phasor measurement units (PMUs) are widely used in power transmission systems to provide synchronized
measurements for the purpose of fault detection. However, how to efficiently deploy those devices across a
power grid – so that a comprehensive coverage can be provided at a relatively low cost – remains a challenge.
In this paper, we present a sensitivity study of a PMU-based fault detection method using three different dis-
tance metrics. This study can serve as a guideline for efficient PMU deployment. To illustrate the effectiveness
of this approach, we have derived an alternative PMU placement plan for a power grid. Experimental results
show that our PMU placement reduces the required PMU deployment by more than 80% as compared to the
original placement, yet still provides similar level of accuracy in fault detection.
1 INTRODUCTION
Phasor measurement units (PMUs), or synchropha-
sors, are devices that are deployed in power systems
to measure phase angles and magnitudes of the elec-
trical waves in real time, for monitoring the health of
the power grid. A significant amount of work has
been done in analyzing real-time PMU data for de-
tecting faults (Jiang et al., 2000) (Liang et al., 2014),
oscillations (Liu and Venkatasubramanian, 2008), as
well as tracking fault locations (Chang et al., 2008).
However, these approches assume a comprehensive
coverage of PMUs on the power grid. Due to the in-
stallation cost, instrumenting every bus with PMUs
is not always practical. Therefore, it is critical to effi-
ciently deploy a limited number of PMUs so that com-
prehensive coverage in terms of fault detection can be
provided. Instead of developing fault detection meth-
ods based on a known topology of PMUs on a power
grid, we take a different approach in which we use
an existing fault detection algorithm as a guideline to
derive more efficient PMU placement plans.
As the first step toward better deployment of
PMUs, it is essential to quantitively analyze how the
distance between a fault and the PMU(s) used to de-
tect that fault impact the detection process itself. To
this end, we have carried out a sensitivity study of dis-
tances in PMU-based fault detection. Specifically, we
use a PMU-based fault detection method that we pre-
viously developed as a baseline, and investigate the
accuracy of this method with respect to the distance
between the fault location and the PMUs being uti-
lized Here, three distance metrics are studied: topo-
logical distance, logical distance, and electrical dis-
tance. Topological distance is derived from the sys-
tem schema of the grid, i.e., number of hops between
two sites. Logical distance is the Pearson correla-
tion coefficient which is derived from two PMU data
streams. Electrical distance is derived from the Ybus
of the power grid, representing another way to elu-
cidate the electrical structure of a power grid (Hines
et al., 2010).
The results of the sensitivity study indicate that
there is a potential to accurately detect faults even
when no PMU is placed on a bus immediately adja-
cent to the fault. Rather, fault detection remains accu-
rate within a small neighborhood near the fault, and
then accuracy falls off as distance from the fault in-
creases. This relationship creates an opportunity for
efficient PMU deployment. Specifically, we use the
results of the sensitivity study as a guideline and de-
velop a PMU placement algorithm which derives de-
ployment solutions based on distance constraints. We
verified our algorithm using PMU data collected from
a power grid; experimental results show that our PMU
placement plan uses 80% fewer PMUs compared to
185
Barella R., Nguyen D., Winter R., Lu K., Wallace S., Zhao X. and Cotilla-Sanchez E..
A Sensitivity Study of PMU-based Fault Detection on Smart Grid.
DOI: 10.5220/0005453801850192
In Proceedings of the 4th International Conference on Smart Cities and Green ICT Systems (SMARTGREENS-2015), pages 185-192
ISBN: 978-989-758-105-2
Copyright
c
2015 SCITEPRESS (Science and Technology Publications, Lda.)

the original placement; however, it provides similar
level of accuracy in detecting faults.
The remainder of the paper is organized as fol-
lows. Section 2 reviews related work in both PMU-
based fault detection and PMU placement in a smart
grid. Section 3 introduces the background of this
work, including the fault detection method we use
in this study, as well as a description of the dataset
we use. The experimental results from the sensitivity
study we carried out on three different distances are
presented in Section 4. In Section 5, we develop a
new PMU deployment algorithm which derives pos-
sible PMU placement solutions based on the results
from the sensitivity study. Section 6 concludes the
paper and proposes future directions for this work.
2 RELATED WORK
With the growing popularity of using phasor measure-
ment units (PMUs) to monitor power systems and
enhance their reliability, there is increasing interest
in analyzing real-time PMU data to detect and lo-
cate faults in the power grid. A significant amount
of work has been done to detect or monitor certain
conditions of a power grid by leveraging informa-
tion extracted from PMU data. Jiang et al. propose
an online approach for fault detection and localiza-
tion using SDFT (smart DFT) (Jiang et al., 2000).
Liu et al. use Frequency Domain Decomposition for
detecting oscillations (Liu and Venkatasubramanian,
2008). Kazemi et al. propose a multivariable re-
gression model to track fault locations using PMU
data (Chang et al., 2008). A more comprehensive sur-
vey can be found in (Glavic and Van Cutsem, 2011).
These approaches assume a comprehensive PMU de-
ployment across the smart grid. Most recently, with
the emergence of big data analytics, a variety of ma-
chine learning techniques have been applied to an-
alyze PMU data in power grid systems, including
classification (Alsafasfeh, 2010), clustering (Antoine
and Maun, 2012), artificial neural networks (Mishra
et al., 2008), Support Vector Machines (Gomez et al.,
2011), and regression trees (Zheng et al., 2013).
Along with the work of monitoring the power grid
using PMUs, the challenge of optimizing PMU place-
ment has also attracted much attention. This is be-
cause deploying PMUs is expensive and a per-bus
coverage of PMU deployment is not always practi-
cal (Mili et al., 1990). Traditional approaches formu-
late PMU deployment as an optimization problem, in
which the power grid is modeled as a graph, and the
objective is to deploy PMUs at a minimum number of
nodes so that the state of the whole power grid is ob-
servable (Anderson and Chakrabortty, 2012a) (Ander-
son and Chakrabortty, 2012b) (Brueni, 1993) (Haynes
et al., 2002). This problem has been proven to be
NP-complete. It has also been proven that no more
than 1/3 of the nodes in a connected graph of at least
3 nodes are requirement to be equipped with PMUs
in order to provide coverage for the whole power
grid (Brueni and Heath, 2005).
Besides these graph-theoretic approaches, simu-
lation based methods have also been used in devel-
oping optimal placement for PMUs. For instance,
in (Liu et al., 2012), a generic algorithm is proposed to
find optimal deployment for heterogeneous measure-
ment devices, including both PMUs and Smart Meter-
ing systems. The results are tested using simulation.
Similar simulation approaches are used in (Zhu et al.,
2009) to evaluate a PMU placement method which
aims for improving the accuracy of state estimation
of the grid. In (Lien et al., 2006), a concept of fault-
location observability is proposed. PMUs are placed
on buses based on the one-bus spaced deployment
strategy, and then the results are tested using simu-
lation. In (Pegoraro et al., 2012), generatation from
renewable sources are considered in the deployment
of PMU and smart metering.
In this paper we propose a novel approach to de-
rive an anytime-optimal PMU placement plan guided
by a sensitivity study of a PMU-based fault detection
method. Our work differs from the previous work in
the following aspects. First, instead of proposing a
theoretical deployment algorithm, we take a practical
approach by developing a fault detection algorithm
first, and then carrying out a sensitivity study which
serves as the guideline for PMU deployment. Sec-
ond, instead of using simulation, we used real PMU
data collected over one-year period on a smart grid
in Pacific NorthWest region of the United States of
America.
3 BACKGROUND
In order to derive efficient PMU deployment plans for
a smart grid, we first develop a simple fault detection
method, and verify this method using a year worth of
real PMU data collected from a smart grid in the Pa-
cific NorthWest of the United States of America. The
dataset we used in this study, as well as the fault detec-
tion method are presented in the following sections.
3.1 Dataset
The dataset we use in this research is from Bonneville
Power Administration, the first utility agency that im-
SMARTGREENS2015-4thInternationalConferenceonSmartCitiesandGreenICTSystems
186

plements a comprehensive adoption of synchropha-
sors in their wide-area monitoring system. The smart
grid is located in pacific northwest area in the United
States, and it contains both 500KV and 230KV buses.
In this grid, there are 31 sites which are equipped
with PMUs to measure voltage, current, and fre-
quency data. The dataset we use in this paper is col-
lected from October 17, 2012 to September 16, 2013.
During this time period, there are 107 documented
faults, including single-line-to-ground faults, line-to-
line faults, and three-phase faults.
3.2 Fault Detection Method
The fault detection method used in this study was de-
veloped based on a theoretical analysis on the charac-
teristics of faults, as well as the BPA datasets (Liang
et al., 2014). The algorithm is a threshold based
decision tree, which classifies faults into the three
fault types – single-line-to-ground, line-to-line, and
three-phase – using the voltage sag values on all three
phases. This fault detection method classifies faults
based on a set of pre-defined threshold values on
voltage sags, which are calculated by surveying the
dataset for the voltage sag values during the same
type of faults. The voltage sag values are in p.u., nor-
malized with respect to the voltage level at the steady
state of that phase.The steady state voltage magnitude
is calculated as follows: 1) use a sliding window to
scan a period before the fault occurs; 2) calculate the
median of voltage magnitude within the window; 3)
if the fluctuation of the voltage magnitude in the win-
dow is within a small range, we consider the median
of voltage steady state; otherwise we keep searching
by moving the sliding window forward, until we find
a steady state.
It has been shown that the accuracy of this method
is more than 96% (Liang et al., 2014). Further, it is
worth noting that we develop this simple fault detec-
tion technique to serve as a baseline for our sensitivity
study, but the approach presented in this paper is not
limited to this fault detection method. Any other ap-
proaches for fault detection could also be used for this
purpose.
4 SENSITIVITY STUDY
When a fault occurs on a power grid, the signature is
typically visible at nearby locations although the sig-
nature is typically reduced in magnitude. This fact
makes it possible to optimize the PMU placement by
removing PMUs which provide redundant coverage.
To fully understand the impact of distances on smart
grid fault detection, we have carried out a sensitivity
study on the fault detection method described in Sec-
tion 3. Specifically, we have investigated the accuracy
of the method when fault signatures are observed by
PMUs at different locations on the power grid.
Site1 (Faulted Site)
Site2
Site3
Site4
dis(1,3)
dis(1,2)
dis(1,4)
FD(t) = SLG
FD(t) = SLG
FD(t) = SLG
FD(t) = F
Site5
FD(t) = F
dis(2,5)
Figure 1: Impact of a Fault on Smart Grid.
4.1 Distance Metrics
A smart grid consists of a large number of intercon-
nected sites. In order to efficiently deploy PMUs
across the grid, we must first analyze the impact of
various types of faults on the entire grid. Figure 1
shows an example grid which includes 5 sites. Sup-
pose at certain point in time, a single-line-to-ground
fault (SLG) occurs at Site 1, the impact of this fault
is usually observable from other locations of the grid.
As shown in Figure 1, this impact can be captured
by our fault detection method FD which is executed
on various sites. Here in this example, the fault type
(SLG) is successfully detected at sites 1, 2, and 3.
However, as indicated in Figure1, Site 4 and 5 have
failed to detect the fault, simply because they are fur-
ther away. In this specific example, if a PMU is de-
ployed on any of the sites 1, 2, or 3, this particular
single-line-to-ground fault can be detected.
As the first step toward efficient deployment of
PMUs across a power grid, we have carried out a sen-
sitivity study of our fault detection method with re-
spect to the distances to the faulted locations (sites)
using real PMU data gathered from BPA’s smart grid.
Note that the distance between two sites can be repre-
sented in different ways. In our work, we have inves-
tigated three different distance metrics: topological
distance, logical distance, and electrical distance.
Topological distance, or hop distance, is a dis-
tance metric for estimating geographical distances.
To calculate the topological distance between two
ASensitivityStudyofPMU-basedFaultDetectiononSmartGrid
187

sites, we represent the grid as a graph with intercon-
nected nodes. Each node is a site with a functioning
PMU and edges between nodes are transmission lines
that are also monitored by one or more PMUs
1
. We
then use Dijkstra’s algorithm (Dijkstra, 1959) to de-
rive the shortest path between any two sites, and con-
struct a distance matrix for the grid. Note that the
topological distance matrix is static for a given smart
grid, because it is derived from the topology of the
grid.
Logical distance is a dynamic distance metric
representing the linear correlation between two data
streams. In this work, we use Pearson correlation
coefficient (PCC) as the metric for logical distance.
The PCC of two data streams X(x
1
, x
2
, ..., x
n
) and
Y (y
1
, y
2
, ..., y
n
) can be calculated as follows:
PCC =
∑
n
i=1
(x
i
− X)(y
i
−Y )
q
∑
n
i=1
(x
i
− X)
2
q
∑
n
i=1
(y
i
−Y )
2
(1)
The value of PCC ranges from −1 to 1, represent-
ing the linear relationship between the two PMU data
streams: 0 indicates no linear relationship, 1 and −1
indicate linear relationships, in positive or negative di-
rection.
Electrical distance is an electrical cohesiveness
metric, as proposed in (Cotilla-Sanchez et al., 2012).
The electrical distance between buses i and j is ob-
tained from the quadrant of the ac power flow Jaco-
bian that measures the incremental change in voltage
phase angle difference between i and j for an incre-
mental active power transaction between i and j. This
power flow Jacobian is itself computed from a combi-
nation of the Y
bus
(nodal admittance matrix), and gen-
eration and load information. In this particular set
of experiments we build a ‘nominal’ power flow Ja-
cobian by assuming that power injections are small
increments, whereby the Jacobian is basically inher-
ited from the Y
bus
structure (this is analogous to a ‘flat
start’ before solving the power flow problem).
The above three metrics represent distances be-
tween sites in different ways. However, they are also
related. For example, the topological distance, i.e.,
hop distance, has been shown to be a good indica-
tor for electrical distance. Figure 2 shows a box-
plot which depicts the relationship between these two
types of distances derived from our dataset. As shown
in Figure 2, the electrical distance increases when the
topological distance increases. Note that a topological
1
Note that this method of deriving the connectivity
graph means ensures that our representation is a subset of
the underlying power grid’s full connectivity (other paths
between sites may exist)
Figure 2: Topological Distance vs. Electrical Distance.
distance of −1 indicates that the two sites are not con-
nected by a path that is monitored by PMUs. Those
sites generally have higher electrical distances too, as
shown in the figure.
4.2 Fault Detection Sensitivity
With the three distance matrices being calculated, we
can then analyze the accuracy of our fault detection
algorithm presented in Section 3 across the whole
smart grid, with respect to the distance to the faulted
site.
4.2.1 Topological Distance
For each documented fault in our dataset, we first
execute our fault detection algorithm on every PMU
site, using the data being recorded during the time
of the fault, then we compare the results with the
ground truth (the recorded fault type), to determine
whether the fault is correctly detected on each site.
We then associate each result with the topological dis-
tance between the site where the data is collected and
the faulted site. After all the faults have been ana-
lyzed, we calculate the accuracy of our fault detection
method on a certain topological distance.
Figure 3 shows the histogram of the accuracy of
the the fault detection method at various of distances
away from the location of the fault. There is a clear
correlation between the accuracy of the fault detec-
tion method and the topological distance from the
fault location to the PMU where the data is collected.
Specifically, if the PMU is located within 2 hops from
the fault location, the accuracy of our fault detection
method is above 80% for all 107 recorded faults in the
dataset. The accuracy decreases as topological dis-
tance increases.
SMARTGREENS2015-4thInternationalConferenceonSmartCitiesandGreenICTSystems
188
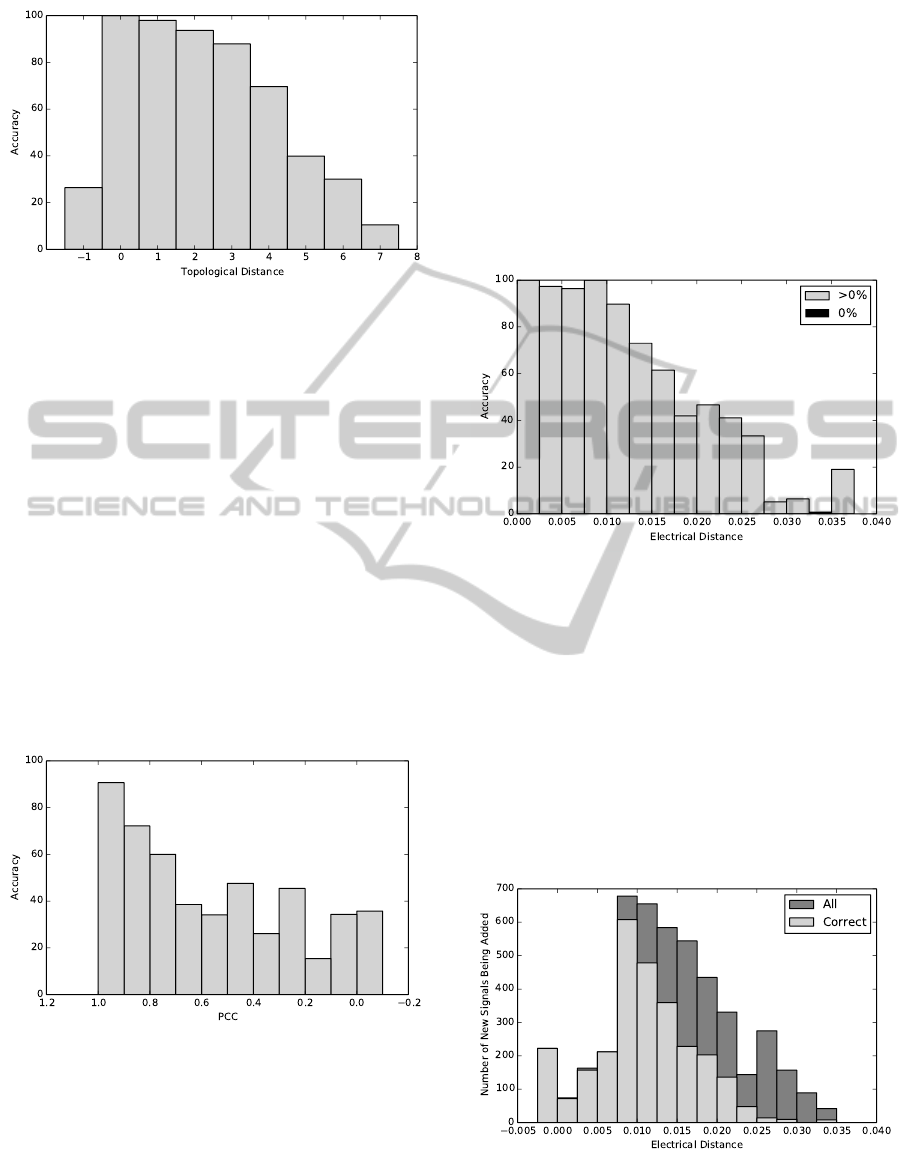
Figure 3: Accuracy vs. Topological Distance.
4.2.2 Logical Distance
We represent logical distance between two sites us-
ing Pearson correlation coefficient (PCC) as shown in
Equation 1. This distance metric models the similar-
ity of two data streams within a certain period of time,
therefore it is a dynamic metric which changes over
time. In our study, we calculate logical distance using
a 15-second time window preceding a fault, and ana-
lyze the accuracy of the fault detection method with
respect to this distance metric. Specifically, for each
fault, we first calculate the logical distance between
the fault location and any other PMU site using the
15-second time window before the fault, then we ex-
ecute the fault detection method using the data col-
lected at each of the non-fault site, and associate the
accuracy with the logical distance.
Figure 4: Accuracy vs. Logical Distance.
The results of the sensitivity analysis with respect
to the logical distance are shown in Figure 4. In gen-
eral, the fault detection methods has higher accuracy
when it is executed on a PMU site which has higher
correlation with the fault location.
4.2.3 Electrical Distance
Similarly, we have carried out a sensitivity study on
electrical distance, which is a static distance metric
derived from the schema of the smart grid, as de-
scribed in Section 4.1. The results are shown in Fig-
ure 5. As expected, the accuracy of our fault detec-
tion method decreases when the electrical distance to
the fault location increases. However, the accuracy is
close to 100% when the electrical distance is within
0.010.
Figure 5: Accuracy vs. Electrical Distance.
To further investigate the electrical distance, we
have calculated the number of added signals when
we gradually increase the electrical distance bound-
ary. Figure 6 shows the results. Green indicates the
signals on which the fault detection method can accu-
rately detect faults, while blue bars indicate the total
set of signals for within a specific electrical distance
from the fault’s source. When the electrical distance
is within 0.010, the fault detection method is accurate
for most of the signals. When the boundary increases,
more signals result in incorrect detection results.
Figure 6: Electrical Distance vs. Sites.
The sensitivity study presented in this section indi-
cates that it is not necessary to deploy PMUs at every
ASensitivityStudyofPMU-basedFaultDetectiononSmartGrid
189

site in a smart grid. This is simply because most of
the faults can be detected from a site which is within
a certain distance from the fault location.
5 PMU DEPLOYMENT
Based on the sensitivity study, we can derive an im-
proved PMU deployment plan for the smart grid.
Here we use the topological distance as an example
to illustrate this approach.
The sensitivity study suggests that the accuracy of
our fault detection method is reasonably good when
the PMU is located within two hops from the fault.
Based on this observation, we have developed a PMU
placement algorithm which deploys PMUs in the way
that each site in the smart grid is less than or equal to
n hops away from a PMU. Algorithm 1 shows how a
PMU placement plan is derived.
Algorithm 1: PMU Placement.
randomly pick a site S
0
;
place PMU at S
0
;
S
0
.distance = 0;
Queue.push(S
0
);
while Queue is not empty do
nextSite = Queue.pop();
currentDistance = nextSite.distance;
if nextSite.distance ≤ 2 then
Visited.append(nextSite);
for neighbor in nextSite’s neighborset
do
if neighbor is not visited then
neighbor.distance =
nextSite.distance+1;
Queue.push(neighbor);
end
end
end
else
place PMU at nextSite;
nextSite.distance = 0;
Queue.push(nextSite);
end
if Queue is empty && not all sites are
visited then
randomly pick an unvisited site;
Place PMU at newSite;
newSite.distance = 0;
Queue.push(newSite);
end
end
The algorithm randomly picks a starting site to
place a PMU, then traverses the grid while iteratively
placing PMUs on the sites as needed. Depending on
the staring site, and choices made during the course
of execution, the algorithm may return different solu-
tions. Figure 7 shows an example placement solution
which uses only 6 PMUs (highlighted in gray in the
figure), as opposed to 31 in the original smart grid
schema.
2
The placement is derived with a topologi-
cal distance constraint of 3, which means that any site
on the smart grid is less than or equal to 3 hops away
from a site with a PMU.
To evaluate the PMU placement plan shown in
Figure 7, we have simulated a smart grid with these
6 PMUs, and execute our fault detection method us-
ing data from these 6 PMUs. For the 107 recorded
faults, the accuracy of the fault detection on the 6-
PMU smart grid is 93.9%, only 2.1% less than the
accuracy of the original smart grid with 31 PMU-
equipped sites (96%). These results illustrate that it is
possible to accurately detect faults using significantly
less PMUs, creating the opportunities of cost savings
for PMU deployment.
Since our PMU placement approach shown in Al-
gorithm 1 can generate a number of different solutions
for one distance constraint, to illustrate the accuracy
of the new PMU placement plans generated by this
algorithm, we randomly picked some placement so-
lutions generated by our PMU deployment algorithm
using various of distance constrants, and calculated
their accuracy. Figure 8 shows a comparison of the
accuracy of these solutions with respect to their dis-
tance constraints. The number of PMUs of each solu-
tion is also noted in the figure. As shown in the figure,
it is possible to achieve more than 90% of accuracy
in fault detection with only 6 PMUs. As expected,
when the distance constraint increases, the accuracy
descreases, so does the number of required PMUs.
Based on a recent cost analysis report by Department
of Energy (Department Of Energy, 2014), the average
cost per PMU ranges from $40k to $180k, which in-
cludes cost for procurement, installation and commis-
sioning. Therefore, our work can potentially result in
significant cost savings for a smart grid.
2
The actual site names are not displayed in Figure 7
due to security reasons. Figure 7 shows 36 sites because
we included 5 sites which do not have PMUs installed in
the original grid, in order to maintain the original topol-
ogy. Note that the new PMU deployment plan we generated
only places PMUs on the sites that are PMU-equipped in
the original power grid.
SMARTGREENS2015-4thInternationalConferenceonSmartCitiesandGreenICTSystems
190

Site33
Site18
Site28 Site27Site14
Site29 Site31
Site35
Site12
Site5
Site34
Site36
Site1
Site2
Site10
Site11 Site32
Site3
Site22
Site23
Site4
Site17
Site9 Site6
Site7
Site21
Site25
Site8
Site15Site20
Site19
Site24
Site30
Site26
Site13Site16
Figure 7: An Example PMU Placement Plan (PMU sites are highligthed in gray).
Figure 8: Comparison of PMU Placement Plans.
6 CONCLUSION
Synchrophasors are widely used in power grids to en-
hance situation awareness, and robustness of power
delivery. A significant amount of work has been done
in fault detection using PMU data. However, these
approaches assume a predefined PMU deployment
scheme across the smart grid. Since deploying PMUs
is costly, it is not necessarily practical or scalable to
equip every bus with a PMU. A more cost-effective
solution for PMU deployment is needed.
While traditional approaches usually simulate the
power grid and derive efficient PMU deployment
plans, in this paper, we take a novel approach to in-
vestigate ways to efficiently deploy PMUs across a
power grid based on the accuracy of detecting faults.
The goal of this work is to deploy the fewest PMUs
while still providing comprehensive coverage in terms
of fault detection. Specifically, we first developed a
fault detection method based on voltage sags of three
phases, and then carried out a sensitivity study on the
accuracy of this method, with respect to the distance
from the fault location. To this end, we have investi-
gated three different types of distances, namely topo-
logical distance, logical distance, and electrical dis-
tance. The sensitivity study shows that our fault de-
tection method can achieve high accuracy when it is
executed using data collected within certain distance
to the fault location. This creates opportunities to de-
tect faults using less PMUs. We then developed a
PMU deployment algorithm which derives valid so-
lutions for PMU deployment based on a pre-defined
distance constraint. The evaluation results show that
our new PMU deployment plan can achieve high ac-
curacy with less than one-fifth of PMUs originally de-
ployed in the smart grid.
Our work is ongoing in several directions. First,
we will develop new fault detection approaches us-
ing machine learning techniques, such as classifica-
tion and clustering. Second, we will create visualiza-
tion tools based on our study, for enhancing the real-
time situation awareness of a smart grid. Third, we
will investigate the possibilities to repurpose our fault
detection techniques for solving other problems on a
smart grid, such as data cleansing, and cyber security
challenges.
ACKNOWLEDGEMENT
The generous support from Bonneville Power Admin-
istration and OregonBest through the NW Energy XP
Award is gratefully acknowledged. The authors also
would like to thank Bonneville Power Administration
for providing PMU data used in this research.
REFERENCES
Alsafasfeh, Q. H. (2010). Pattern Recognition for Fault De-
tection, Classification, and Localization in Electrical
Power Systems. PhD thesis, Kalamazoo, MI, USA.
ASensitivityStudyofPMU-basedFaultDetectiononSmartGrid
191

Anderson, J. and Chakrabortty, A. (2012a). A Minimum
Cover Algorithm for PMU Placement in Power Sys-
tem Networks Under Line Observability Constraints.
In IEEE Power and Energy Society General Meeting,
pages 1–7.
Anderson, J. and Chakrabortty, A. (2012b). Graph-
Theoretic Algorithms for PMU Placement in Power
Systems Under Measurement Observability Con-
straints. In the 3rd IEEE International Conference
on Smart Grid Communications (SmartGridComm),
pages 617–622.
Antoine, O. and Maun, J.-C. (2012). Inter-Area Oscilla-
tions: Identifying Causes of Poor Damping using Pha-
sor Measurement Units. In IEEE Power and Energy
Society General Meeting, pages 1–6.
Brueni, D. J. (1993). Minimal PMU Placement for Graph
Observability: A Decomposition Approach.
Brueni, D. J. and Heath, L. S. (2005). The PMU Placement
Problem. SIAM J. Discret. Math., 19(3):744–761.
Chang, G., Chao, J.-P., Huang, H.-M., Chen, C.-I., and
Chu, S.-Y. (2008). On tracking the source location
of voltage sags and utility shunt capacitor switching
transients. IEEE Transactions on Power Delivery,
23(4):2124–2131.
Cotilla-Sanchez, E., Hines, P., Barrows, C., and Blumsack,
S. (2012). Comparing the Topological and Electrical
Structure of the North American Electric Power In-
frastructure. IEEE Systems Journal, 6(4):616–626.
Department Of Energy (2014). Factors Affecting PMU
Installation Costs. https:// www.smartgrid.gov/
sites/ default/ files/ doc/ files/ PMU-cost-study-final-
10162014.pdf. Accessed: 2015-03-24.
Dijkstra, E. (1959). A Note on Two Problems in Connexion
with Graphs. Numerische Mathematik, 1(1):269–271.
Glavic, M. and Van Cutsem, T. (2011). A short survey
of methods for voltage instability detection. In IEEE
Power and Energy Society General Meeting, pages 1–
8.
Gomez, F., Rajapakse, A., Annakkage, U., and Fernando,
I. (2011). Support vector machine-based algorithm
for post-fault transient stability status prediction using
synchronized measurements. Power Systems, IEEE
Transactions on, 26(3):1474–1483.
Haynes, T. W., Hedetniemi, S. M., Hedetniemi, S. T., and
Henning, M. A. (2002). Domination in Graphs Ap-
plied to Electric Power Networks. SIAM J. Discret.
Math., 15(4):519–529.
Hines, P., Blumsack, S., Cotilla Sanchez, E., and Barrows,
C. (2010). The topological and electrical structure of
power grids. In Proceedings of the 43rd Hawaii In-
ternational Conference on System Sciences (HICSS),
pages 1–10.
Jiang, J.-A., Yang, J.-Z., Lin, Y.-H., Liu, C.-W., and Ma,
J.-C. (2000). An adaptive pmu based fault detec-
tion/location technique for transmission lines. i. the-
ory and algorithms. IEEE Transactions on Power De-
livery, 15(2):486–493.
Liang, X., Wallace, S., and Zhao, X. (2014). A technique
for detecting wide-area single-line-to-ground faults.
In Proceedings of the 2nd IEEE Conference on Tech-
nologies for Sustainability (SusTech 2014), SusTech
’14, pages 1–4. IEEE.
Lien, K.-P., Liu, C.-W., Yu, C.-S., and Jiang, J.-A. (2006).
Transmission Network Fault Location Observability
with Minimal PMU Placement. IEEE Transactions
on Power Delivery, 21(3):1128–1136.
Liu, G. and Venkatasubramanian, V. (2008). Oscillation
monitoring from ambient pmu measurements by fre-
quency domain decomposition. In IEEE International
Symposium on Circuits and Systems (ISCAS 2008),
pages 2821–2824.
Liu, J., Tang, J., Ponci, F., Monti, A., Muscas, C., and Pe-
goraro, P. (2012). Trade-Offs in PMU Deployment for
State Estimation in Active Distribution Grids. Smart
Grid, IEEE Transactions on, 3(2):915–924.
Mili, L., Baldwin, T., and Adapa, R. (1990). Phasor Mea-
surement Placement for Voltage Stability Analysis of
Power Systems. In Proceedings of the 29th IEEE Con-
ference on Decision and Control, pages 3033–3038.
Mishra, S., Bhende, C., and Panigrahi, K. (2008). Detec-
tion and Classification of Power Quality Disturbances
Using S-Transform and Probabilistic Neural Network.
IEEE Transactions on Power Delivery, 23(1):280–
287.
Pegoraro, P., Tang, J., Liu, J., Ponci, F., Monti, A., and
Muscas, C. (2012). Pmu and smart metering deploy-
ment for state estimation in active distribution grids.
In IEEE International on Energy Conference and Ex-
hibition (ENERGYCON), pages 873–878.
Zheng, C., Malbasa, V., and Kezunovic, M. (2013). Re-
gression Tree for Stability Margin Prediction Using
Synchrophasor Measurements. Power Systems, IEEE
Transactions on, 28(2):1978–1987.
Zhu, K., Nordstrom, L., and Ekstam, L. (2009). Applica-
tion and Analysis of Optimum PMU Placement Meth-
ods with Application to State Estimation Accuracy. In
IEEE Power Energy Society General Meeting, pages
1–7.
SMARTGREENS2015-4thInternationalConferenceonSmartCitiesandGreenICTSystems
192
