
An Approach to using a Laser Pointer as a Mouse
Jeremiah Aizeboje and Taoxin Peng
School of Computing, Edinburgh Napier University, 10 Colinton Road, Edinburgh, U.K.
Keywords: Blob Detection, Edge Detection, Corner Recognition, Thresholding, Quadrilateral Transformation.
Abstract: Modern technologies have evolved to present different ways users can interact with computers. Nowadays,
computers and projectors are commonly used in teaching and presentations, in which the mouse and the
USB wireless presenter are two of the main presentation devices. However, the USB wireless presenter,
usually a laser pointer, cannot simulate the movement of a mouse but only simulate the actions of a right
and left arrow key. This paper proposes a novel approach to allowing users to interact with a computer from
a distance without the need of a mouse, but instead using a laser pointing device, a projector and a web
camera, by developing a novel screen detection method (based on a simple pattern recognition technique), a
laser detection method, and an accuracy algorithm to control the accuracy of the movement of the mouse
cursor. The test results confirmed the laser pointer could be used to simulate the movement of the mouse as
well as mouse clicks with very high accuracy. It could also be potentially used in a gaming environment.
1 INTRODUCTION
Modern technologies have evolved to present
different ways users can interact with computers.
Over the past decades, teaching and presenting
methods have graduated from chalk board to white-
board and now the use of projectors. Moreover, the
mouse and the USB wireless presenter are two of the
main presentation devices used in combination with
a projector. In such an environment, a camera would
be used to capture the projected screen along with
the laser dot. The projected screen can be seen as a
“laser-touchscreen” because the laser pointer device
would act as a mouse; the cursor would move to the
position of the laser in relation to the projected
screen. However, the USB wireless presenter,
usually a laser pointer, cannot simulate the
movement of a mouse but only simulate the actions
of right and left arrow keys.
The main aim of this work is to explore the
possibilities of using a laser pointer as a computer
mouse through the help of a projector and a
webcam. The idea is to give the user more flexibility
in controlling a computer at any distance the laser
pointer can cover. This would give the presenter the
ability to move freely amongst the audience
knowing that they don’t have to rush back to the
computer in order to do a simple mouse interaction
with it.
This paper proposes a novel approach to allowing
users to interact with a computer from a distance
without the need of a mouse, but instead using a
laser pointing device, a projector and a web camera,
by developing a novel screen detection method
(based on a simple pattern recognition technique), a
laser detection method, and an accuracy algorithm to
control the accuracy of the movement of the mouse
cursor. The test results confirmed the laser pointer
could be used to simulate the movement of the
mouse as well as mouse clicks with very high
accuracy. It could also be potentially used in a
gaming environment.
The rest of this paper is structured as follows.
Related works are described in next section. Section
3 introduces image recognition techniques that will
be used to develop the application. The main
contribution of this paper is presented in section 4,
which introduces the novel approach, the design and
implementation of the application. The testing and
evaluation are discussed in section 5. Finally, this
paper is concluded and future work pointed out in
section 6.
2 RELATED WORK
Beauchemin (2013) compared and analysed different
image thresholding techniques and proposed an
543
Aizeboje J. and Peng T..
An Approach to using a Laser Pointer as a Mouse.
DOI: 10.5220/0005378005430552
In Proceedings of the 17th International Conference on Enterprise Information Systems (ICEIS-2015), pages 543-552
ISBN: 978-989-758-097-0
Copyright
c
2015 SCITEPRESS (Science and Technology Publications, Lda.)

image based thresholding based on semivariance
analysis. This method “measures the spatial
variability of a variable at different scales”.
Semivariance thresholding proved to be highly
competitive from the results gained when compared
against other popular thresholding methods.
Regardless of the positive results gained, the
semivariance method fails when the images’
background is outshined by intermittent spatial
patterns.
A rectangle shape recognition algorithm was
developed by Rajesh (2010). The algorithm proposes
the use of a one-dimensional array to examine the
rectangular shape. The algorithm requires the image
to be in binary mode. Afterwards, the image would
need to be rotated to a standard X – Y axis before
the rectangle testing algorithm can be run. The
algorithm has been tested for three sample
applications; ‘Rice Sorting’, ‘Rectangle Shaped
Biscuits Sorting’ and ‘Square Shaped Biscuits
Sorting’ as well as ‘Raw Shape Sorting’. Rajesh
proves the algorithm to be fast and accurate based on
these applications. However, since only a one
dimension array is used, only limited information
can be stored. The algorithm doesn’t take into
consideration if the recognised shape is actually a
rectangle and not an unequal quadrilateral.
Moon et al (2013) proposed a method, through
the use of blob detection, to help computers detect
tumours in automated ultrasound images. This
computer-aided detection (CADe) method was
proposed to revolutionise the way hand held
ultrasound images are carried out since the results
are dependent on the user. Blob detection has made
it possible for an efficiently detailed and automated
ultrasound to be proposed. However, before this
method can be used in a clinical environment,
further work needs to be done to reduce its frames
per second as well as its execution time.
There are also two existing commercial systems
like electronic whiteboard and USB wireless
presenter:
Electronic Whiteboard (E.W.): The accuracy
of this device is reliable when it has been calibrated.
On the other hand it is quite costly and is not
financially feasible for some commercial uses. This
device works like a touchscreen; built with
functionalities like mouse clicks and movement of
the mouse cursor. (SMART, 2015)
USB Wireless Presenter (USB W.P.): This
device can be relied on when used within range of
its receiver. It is built with an average range of 15
metres. It is also quite cheap and easily acquired. Its
functionalities are merely pre-programmed buttons
that simulates some keyboard buttons i.e. arrow
keys. The USB receiver cannot work with any other
pointer than the one that was built for it (SANOXY,
2015).
3 IMAGE PROCESSING
TECHNIQUES
This section discusses image recognition techniques
that will be used in this application.
3.1 Image Processing
Image processing can be defined as running a list of
mathematical operations on an image in order to
achieve the desired result. It has been in existence
since the 1920s. The earliest record of a machine
based image processing system was first recorded in
1952. As the development and improvement of
computers grew so did this field as it became a
widespread area. (Bailey, 2011).
Image processing has been used to solve several
problems identified but it still has not solved some
sensitive issues gathered in 1993, (Huang & Aizawa,
1993) such as:
Compression: Image compression is a technique
for reducing the amount of digitized information
needed to store a visual image electronically. Images
are compressed to speed up transmission time from
one place to another. This process causes the image
to loose quality. If image processing could be used
to compress a 1.2Mbps video stream to a desirable 1
kbps video stream without degrading in quality then
“compression” would not be a problem in image
processing.
Enhancement: Image enhancement is a method
used to improve the quality of an image. Attributes
such as hue, contrast, brightness, sharpness etc. of an
image may cause the need for an image to need
enhancement. These could be seen as
“degradations”. The main problem of enhancement
in image processing is how to remove these
degradations without affecting the intended outcome
of the image. Though many algorithms have been
implemented but they still do not fully solve this
problem.
Recognition: Image recognition is the
identification of objects within an image. This area
is widely used in computer vision. Such a system
should be able to recognize objects from its input
parameters (analysis of the image retrieved). The
difficult task would be, being able to identify
ICEIS2015-17thInternationalConferenceonEnterpriseInformationSystems
544

different classes of objects i.e. chairs, table etc. How
can one develop a general purpose system such as
this? This is a question yet to be answered.
Even though all these problems and more exist,
different algorithms and techniques have been
developed in an attempt to address these issues. It
can be argued to what extent the developed methods
help in a quest for a solution
3.2 Blob Detection
“Blob tracking is a method by which computers can
identify and trace the movements of objects within
images.” (Yao et al, 2013). A computer can find a
blobs position in successive frames using this
method. The idea is to track a group of pixels with
similar colour or light values.
Apart from using blob detection for colour
detection, Hinz (2005) explains how blobs can be
categorized by its geometric values:
Blob area
Geometric moments: centre points, and higher
order moments
Boundary length
Parameters of a robustly fitted ellipse like:
- Length
- Width
- Orientation
In any case, for a specific end goal in blob
tracking to be viable, blob tracking calculations need
to conquer the challenges revealed by high blob
interaction, for example frequent uniting and
disuniting of blobs (Sharma, 2012).
3.3 The Canny Edge Detector
When analysing an image, one of the popular
operations carried out is edge detection. The cause
of its popularity is that edges form the outline of an
object, in the generic sense. An edge outlines the
perimeter of an object from another object or
background. Edge detection is essentially needed for
accuracy in identifying various objects in images
(Parker, 2010).
The Canny Edge Detector is a very popular and
effective edge feature detector that is used as a pre-
processing step in many computer vision algorithms.
In 1986, John Canny characterized a set of
objectives for an edge identifier and portrayed an
optimal strategy for attaining them (Parker, 2010).
Canny also stated three problems that an edge
detecting system must overcome. These are:
Error rate — the edge detector should respond
only to edges, and should find all of them; no
edges should be missed.
Localization — the distance between the edge
pixels as found by the edge detector and the
actual edge should be as small as possible.
Response — the edge detector should not
identify multiple edge pixels where only a
single edge exists.
The Canny edge detector is a multi-step detector
which performs smoothing and filtering, non-
maxima suppression, followed by a connected-
component analysis stage to detect ‘true’ edges,
while suppressing ‘false’ non-edge filter responses
(Luo & Duraiswami, 2008).
3.4 Thresholding
“Thresholding is a non-linear operation that converts
a gray-scale image into a binary image where the
two levels are assigned to pixels that are below or
above the specified threshold value.” (WaveMetrics,
2014). Thresholding is a simple method used in
segmenting images. It can be used to partition out
different areas of an image. This partition is
dependent upon the strength of the difference
between the object pixels and the background pixels
(OpenCV, 2014). Before thresholding is applied, the
image is normally converted to a greyscale image.
Assuming an 8-bit greyscale image conversion was
used, each pixel would have a value between 0 and
255; where 0 is black and 255 is white.
Figure 1: Thresholding applied on image. (OpenCV,
2014).
Figure 1 illustrated thresholding applied to the
greyscale image on the left. The result produced on
the right only contains two colours. The black colour
could be classified as ‘0’ and the non-black colour
could be classified as ‘1’ in terms of binary. When
thresholding is being applied, it compares each pixel
with the threshold value. If the compared pixel is
less than the threshold value, that pixel is converted
to 0 (black). But if the compared pixel is greater than
the threshold value, that pixel would normally be
converted to a non-black value (the user defines this
value; between 0 – 255). This can also work in
AnApproachtousingaLaserPointerasaMouse
545
reverse as there are different forms of thresholding.
The main goal of thresholding is to clearly separate
or compress the wanted pixels from the unwanted
pixels.
4 THE APPROACH
4.1 Introduction
The implementation of this system is defined by its
requirements. The functional requirement of this
system is basically being able to use a laser pointing
device to interact with a computer through the help
of a web camera and a projected screen. The
interaction here means the mouse must move when
the laser pointing dot is moved within the projected
screen and a click must be simulated when the laser
pointer is turned off and on.
The accuracy of the movement is one of the
main challenges. To achieve this objective, the
system should answer the following two questions
which are its non-functional requirements:
How accurately are the four corners of the
screen recognized?
Is the position of the laser dot translated with
great accuracy?
4.2 Screen Detection
This section proposes a method that can be used to
detect the screen. When detecting the screen, the aim
is to retrieve and store the coordinate of the four
corners of the screen. When this coordinates have
been stored, there would be no need to keep on
detecting the screen. This would be costly and
useless if the screen is being detected at every frame
alongside with detecting the laser dot. Since the
screen is inanimate and only going to be at one
place, there is no need to keep on tracking so the
detecting operation is carried out once. If the
projector moves or is being readjusted, this method
would need to be run again.
In order to detect the edges of the screen, the
Canny edge detecting method was implemented as
seen below.
The low threshold value applied varies but is
reasonably high since we are aiming to detect the
most intense pixels in the image (thanks to the light
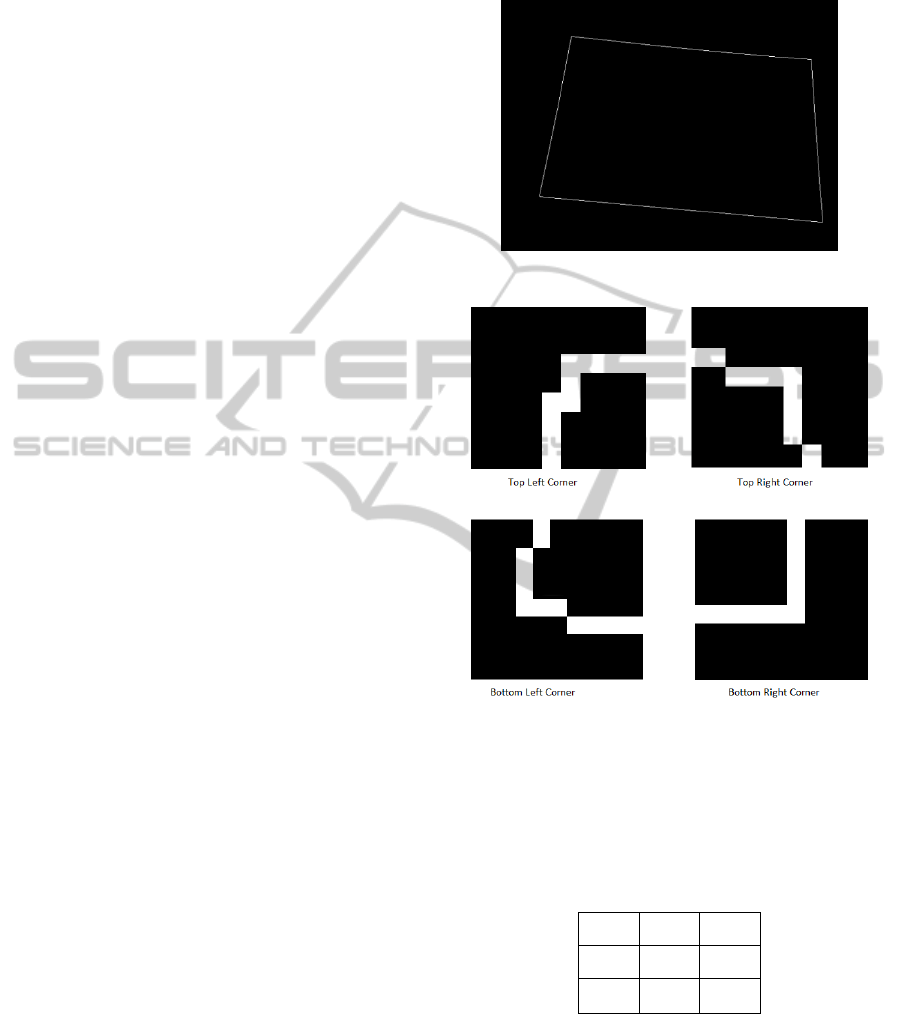
from the projected screen). Figure 2 shows a black
background with a white quadrilateral. This
quadrilateral reveals the edges of the screen would
hardly be a perfect square or rectangle.
Retrieving the four corners would require some
pattern matching technique. Below are samples of
patterns retrieved from a live test.
Figure 2: Canny edge applied to detect screen.
Figure 3: Patterns of screen corners.
Then 2D arrays (3x3) to represent the corners of the
binary images in figure 3 can be generated. Table 1
shows an example array for the top left corner of the
image in figure 3:
Table 1: A 2D array (3x3) representing the top left corner.
0 0 0
0 S 1
0 1 0
In order to recognise the left top corner of the screen
where S is the current pixel in question; if S = 1 and
the surrounding pixels have the values shown in
table 1 then the top left corner of the screen has been
found. The main goal is to check all the 8 pixels
around a visible pixel for the pattern and if found,
the S value is stored as a recognised corner
ICEIS2015-17thInternationalConferenceonEnterpriseInformationSystems
546
4.3 Laser Detection
This detection method implemented the thresholding
technique. Each frame received was first of all
converted to a grey scale image before thresholding
was applied because a greyscale image has only one
channel to work with while the original colour
(RGB) image would have three channels to work
with. Thresholding requires one channel and the
greyscale image provides just that.
Then blob detection is applied to the retrieved
binary image. The tracked feature would be the
intensity of the image.
The following method is adopted from the
OpenCV library which is used to find a blob within
a binary image:
cvLabel(grey, displayFrame, blobs)
In the above implementation, cvLabel takes in
three parameters. The first parameter (grey) passes
in a greyscale image array (IplImage). The second
parameter (displayFrame) passes by reference an
empty image array (IplImage) to be filled on
completion of the method run. The third parameter
(blobs) passes by reference an object (cvBlobs) to
store the blob details found.
The centroid values (x and y) of the blob found
represents the L
dot
values used in the accuracy
algorithm, proposed in next section.
4.4 The Accuracy Algorithm
This novel algorithm is proposed to make a realistic
‘laser-touchscreen’. The accuracy algorithm can be
seen as an automated screen calibration system. This
algorithm was designed to answer the two questions
stated in section 4.1.
The algorithm translates the location of the laser
dot on the projected screen to the expected mouse
position on the computer.
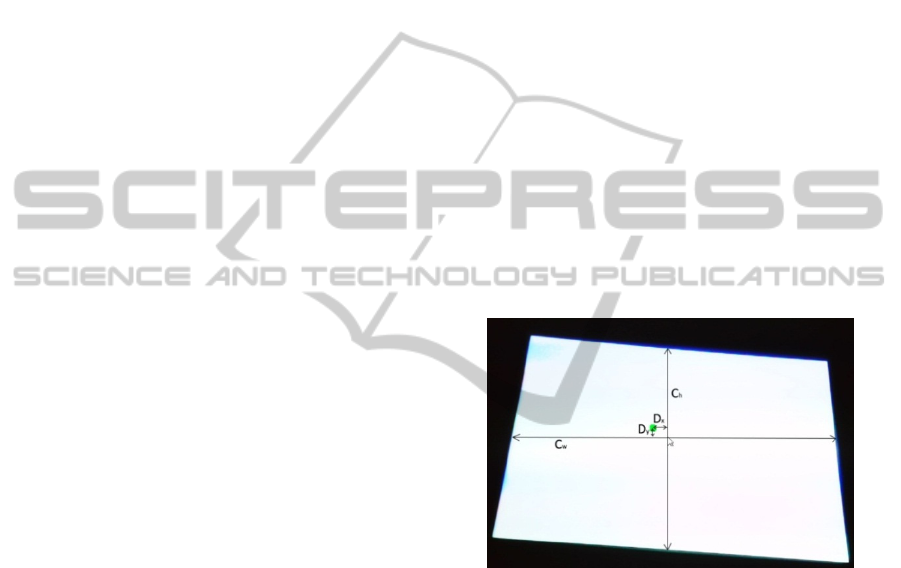
Figure 4: Sketch of webcam view when application is
running.
A simple application would represent the screen as
the bounding box. This would mean the only
accurate point given in figure 4 would be the centre.
If the perimeter of the projected screen (P
1
, P
2
, P
3
,
P
4
) were to be the same as that of the bounding box
then that technique would work, but it may be quite
difficult to achieve this depending on where the
camera is placed and how the projected screen is set
up.
In order to detect L
dot
accurately, the bounding
box would need to be skewed to the shape of the
quadrilateral screen. The following steps were used
to achieve this goal.
Every pixel that the edges of the screen pass
through would need to be known but just now, only
P
1
, P
2
, P
3
and P
4
is known which was automatically
detected.
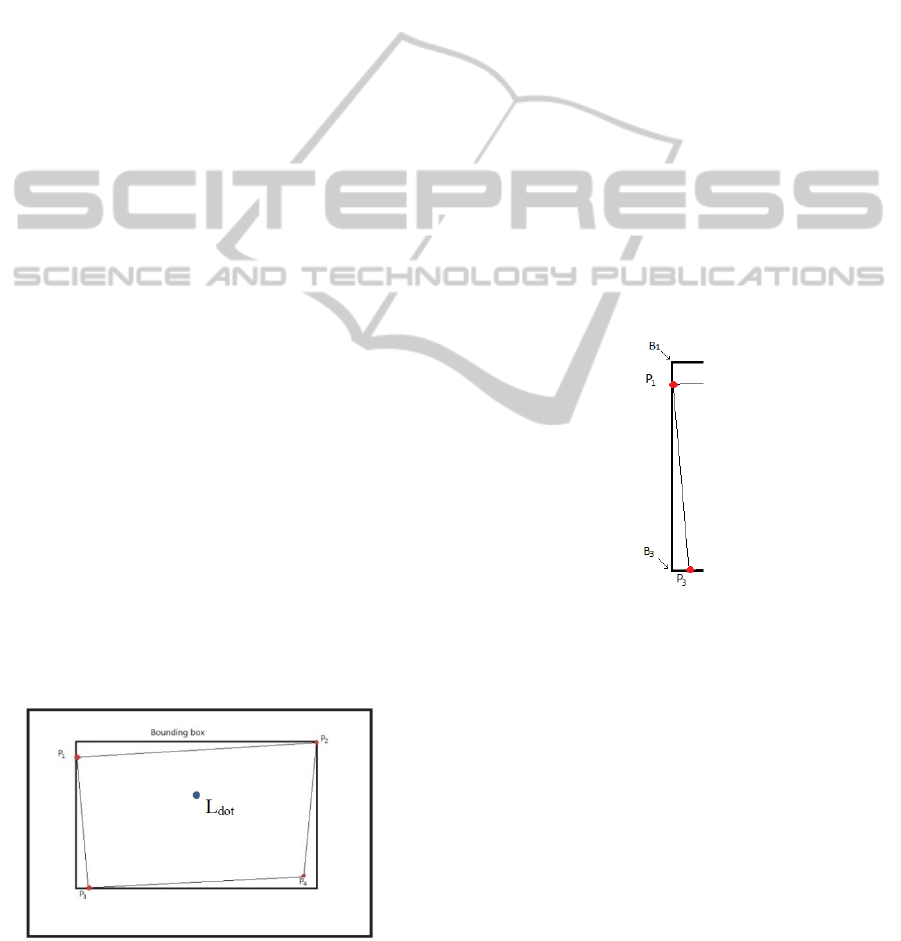
For example, to get all the values from the left
edge (from P
1
to P
3
) of the screen (Figure 5), the
height (P
h
) would be needed, which would be P
3.y
-
P
1.y
(P
n.y
gives the y axis value; value of y axis
increases downwards) and also the width (P
w
) which
would be P
3.x
- P
1.x
(P
n.x
gives the x axis value; value
of x axis increases rightwards).
Figure 5: Sketch of left edge of the projected screen.
This line has a positive gradient. The following
equation calculates the current vertical percentage
value of the laser dot in relation to the height of the
left edge:
Y
percentage
= L
dot.y
/ P
h
L
dot.y
is the current y coordinate value of the laser
dot. Using the Y
percentage
, the starting x value for each
row can be calculated.
Assuming the difference between P
3
and B
3
(the
bottom left corner of the bounding box) were to have
a value of 4 and Y
percentage
had a value of 0.75, then
any values on the L
dot.y
row that is below 3 is not
considered.
If the line were to have had a negative gradient, 1
- Y
percentage
would have been used, which would have
AnApproachtousingaLaserPointerasaMouse
547
returned a value of 1 (25% of 4) and not 3 (75% of
4) because the positive gradient would use the
Y
percentage
value as seen in the previous paragraph to
calculate the starting x value for each row.
The above method was used to determine the
boundaries of the projected screen. All the edges
would need to be solved (known) before the next
stages.
On the L
dot.y
row, the difference between the
minimum considered x value (L
minX
) and the
maximum considered x value (L
maxX
) given the
current width value L
cw
. L
maxX
is known when the
edge P
2
to P
4
has already been solved.
In order to calculate the actual percentage value
(i.e. 0.5 if 50%) for the x coordinates, the following
formula was created:
(L
dot.x
– L
minx
)/L
cw
This is the final formula used to complete the
accuracy algorithm. This formula ports the current
coordinate (L
dot
) in relation to the webcam image to
the coordinates in relation to the recognised screen.
The result obtained is stored in a 2D array. In order
to get the actual percentage value for the y
coordinate, these steps would need to be applied
when the edge being calculated is P
1
to P
2.
The L
dot
values are actually being simulated by
looping over two different 2D arrays (one for the x
coordinates and the other for the y coordinates) at
the same time, where their size is the same as that of
the bounding box. The arrays’ indexes are the L
dot.x
and L
dot.y
values.
Before the application actually starts moving the
mouse, the accuracy algorithm would have been run
to pre calculate the accuracy of all the possible L
dot
values; the results would be stored in two 2D arrays
(one for the x coordinates and the other for the y
coordinates).
The pseudocode of the accuracy algorithm is
outlined as below:
lu = top left corner coordinate
ld = bottom left corner coordinate
ru = right top corner coordinate
rd = right down corner coordinate
width = max_x_value(ru,rd) –
min_x_value(lu, ld)
height = max_y_value(ld,rd) –
min_y_value(lu, ru)
portXcoordinate = 2d array of width by
height
portYcoordinate = 2d array of width by
height
FOR currentX = 1 to width
FOR currentY = 1 to width
start_x =
get_min_x_value_for_row(currentY)
end_x =
get_max_x_value_for_row(currentY)
start_y =
get_min_y_value_for_column(currentX)
end_y =
get_max_y_value_for_column(currentX)
Ypercentage =
(currentY - start_y)/(end_y - start_y)
Xpercentage =
(currentX - start_x)/(end_x - start_x)
set current position in
portXcoordinate to Xpercentage
set current position in
portYcoordinate to Ypercentage
END FOR
END FOR
4.5 Evaluating the Accuracy Algorithm
In order to test how effective the accuracy algorithm
is, an evaluating method is proposed in this section.
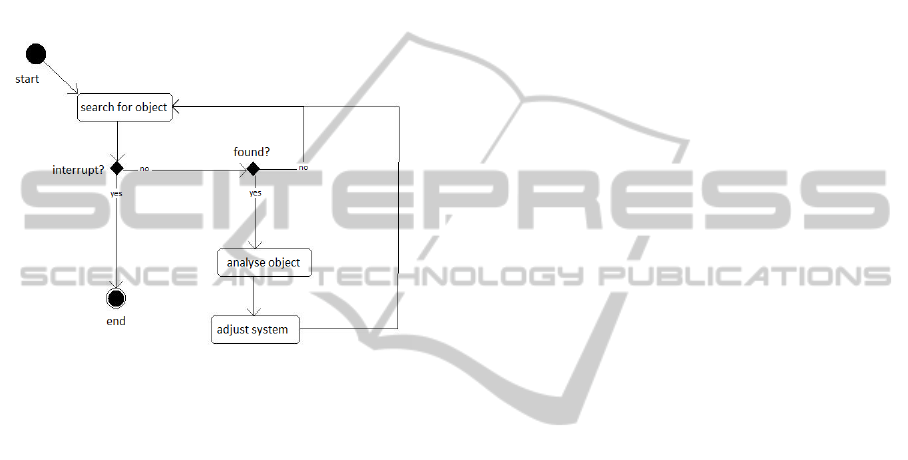
Figure represents a projected screen with a green
laser dot and a mouse cursor. It illustrates an
inaccurate system for a better explanation on how
the accuracy of this system is going to be evaluated.
Figure 6: A projected screen; Explanation of formula used
to test applications accuracy.
D
x
and D
y
represent the x and y distance,
respectively. C
w
and C
h
represent the height and
width values for the current row and column of the
mouse cursor, respectively.
To evaluate the accuracy of results, the
following is designed:
S
accuracy
= (1 – ( (D
x
+ D
y
) / ( C
w
+ C
h
) ) )*100
The formula calculates how close the position of the
x and y coordinates of the laser dot is to the position
of the x and y coordinates of the mouse on the
screen.
4.6 Activity Design
The diagram shown in figure 7 summarises the flow
ICEIS2015-17thInternationalConferenceonEnterpriseInformationSystems
548
of the program. The ‘search for object’ process
searches for either the projected screen (when setting
up the program) or the laser dot (when main aspect
of the program is running). When an object has been
found the program analyses the object. If the laser
dot is detected the ‘analyse object’ process checks
for its position (coordinates) from the camera frame
and then adjusts the system by moving the mouse to
its designated position. If the user sends an interrupt
command (press of the Esc key) the program
terminates.
Figure 7: Flow chart for detecting an object (projected
screen and laser light dot).
4.7 Event Design
This section elaborates on the ‘adjust system’
process from figure 7. Table 2 explains the possible
states and actions carried out by the program during
this process.
States, variables and functions that are involved
in the ‘adjust system’ process are defined as follows:
States:
INIT – when the program is run for the first
time.
SEEN – when the laser pointer dot is seen
by the camera
NOT_SEEN – when the laser pointer dot is
not seen by the camera
Variables:
seen – set to true if the laser dot has been
seen or else false;
dc – set to true if the
‘determine_click_timer()’ function is called
and running.
nsc – this is a counter. Counts how many
times there was a SEEN to NOT_SEEN
state when dc is true.
range – set to true if laser dot is within the
projected screen range or else false
last_x – stores the last x-coordinate value
seen.
last_y – stores the last y-coordinate value
seen.
click_interval – number of seconds to wait
after a single click to determine if the user
has finished clicking. (500 milliseconds or
1 second; user defined)
Functions:
move_mouse(x, y) – This moves the mouse
cursor to coordinate (x, y) on the screen.
determine_click_timer() – This starts a
timer.
mouse_click(type) – This simulates a
mouse click. When type is:
- 1: single left click
- 2: double left click
- 3: single right click
5 EXPERIMENTS AND
EVALUATION
The main focus of the following experiment is to
evaluate if the proposed approach is feasible as an
interactive system.
The tests carried out on the application are based on
the developed functional and non-functional
requirements stated in section 4.1. Because there are
no benchmark scenarios for this kind of testing, the
most common scenario was designed where the
device is used in a lecture room and the
light/brightness of the room doesn't affect what the
camera sees e.g. the screen and the laser pointer dot.
For the results presented in this chapter, the camera
was placed right above (on) the projector with a
slight angle. The distance from the right bottom
corner of the projected screen to the centre of the
projector’s bulb was measured as 132cm while the
distance from the left bottom corner of the projected
screen to the centre of the projector’s bulb was
measured as 151cm. The goal of the following test is
to see how well the system works in a bad setup.
5.1 Accuracy Test
Once the accuracy algorithm has been run, its results
can be evaluated using the method proposed in
section 4.5 to evaluate how accurate the accuracy
algorithm is in a real world environment.
AnApproachtousingaLaserPointerasaMouse
549
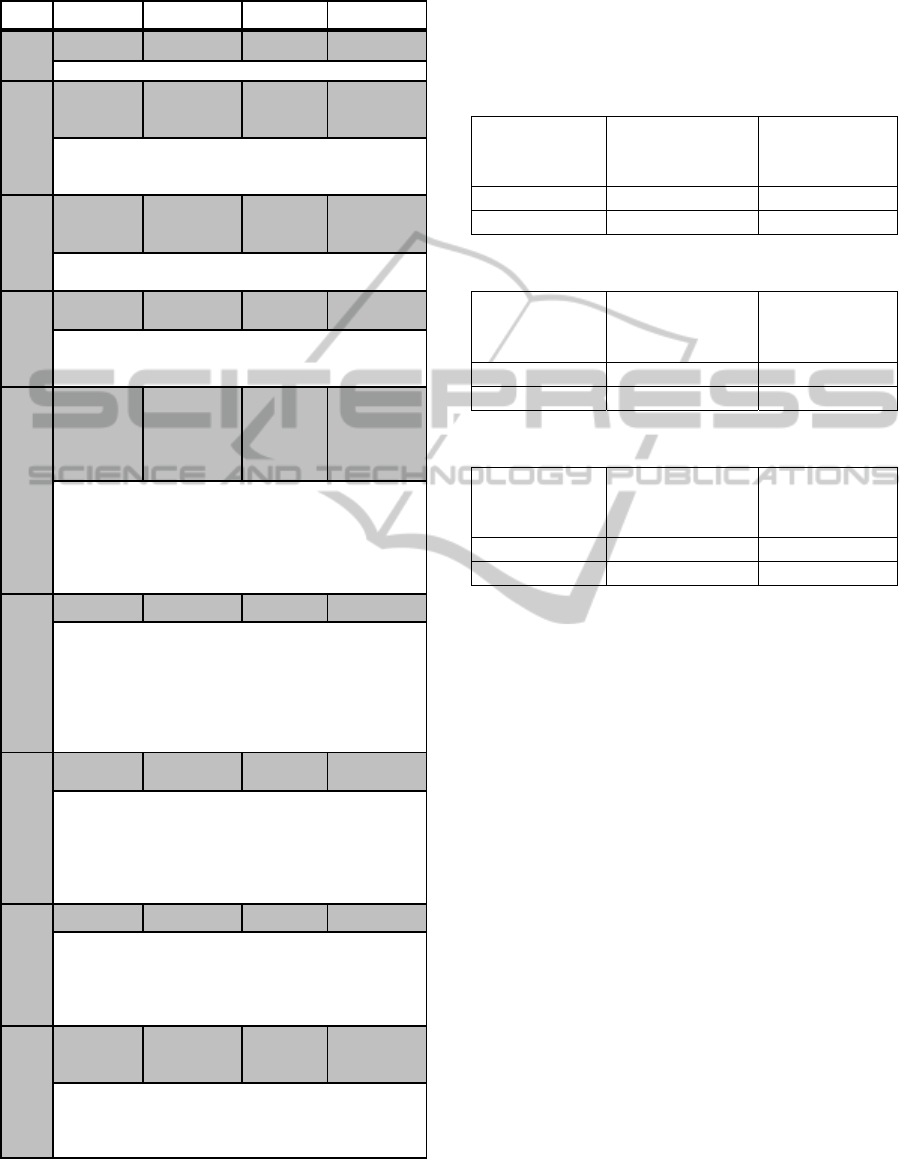
Table 2: All possible laser triggered events at runtime.
ID From To Condition Action
0
INIT INIT (!seen) (dc=false)
Remain in the init state until laser pointer is first seen.
1
INIT SEEN
(seen,
range)
(move_mouse
(xNew,
yNew))
Go to seen state after seeing the laser pointer for the firs
t
time. Move the mouse to the point where the laser pointe
r
is currently seen.
2
SEEN SEEN
(seen,
range)
(move_mouse
(xNew,
yNew))
Stay in seen state and move the cursor to the point where
the laser pointer is currently seen.
3
SEEN SEEN (seen ,
!range )
-
This will occur, when the laser dot has been moved of
f
the projected screen area or is being seen outside the
p
rojected screen area.
4
SEEN NOT_SEEN
(!seen,
range, !dc)
(determine_cl
ick_timer(),
dc = true, nsc
= 0, last_x =
x, last_y=y)
When the laser pointer is not visible and was last visible
in range, go to the not_seen state and since dc is false, we
can call the determine_click_timer() function. Then set dc
to true and nsc to 1. The program needs to know if the
user is attempting to click on something so it stores the x
and y coordinates of the current position.
5
NOT_SEEN NOT_SEEN (!seen, dc) -
Stay in the not_seen state. The timer called by event 4 is
currently running. If the elapsed time from the previous
click (event 4 or event 7) to now is currently greater tha
t
the click_interval then the timer would be stopped, dc
will be set to false, nsc to zero. This is to prevent fake
clicks (situations when the user switches off the lase
r
p
ointer or wants to cancel a click).
6
NOT_SEEN SEEN
(seen,
range, dc)
-
Since we are still trying to determine if user is attempting
a click, we do nothing. After this event, event 7 is likely
to run to simulate a left double click or a right click. If the
elapsed time from the previous click (event 4 or event 7)
till now is currently greater that the click_interval then
event 8 will run.
7
SEEN NOT_SEEN (!seen, dc) (nsc++)
The laser dot is now not_seen when dc is true. Since it is
currently trying to determine if the user is clicking, jus
t
increment the nsc value by 1. No need to move mouse.
Event 6 will need to be run again when the user has
finished clicking. Restart the determine_click_timer().
8
SEEN SEEN
(range,
!dc,nsc>0,
nsc<4 )
(mouse_click(
nsc), nsc=0,
dc=false)
The determine_click_timer() has run its course. We call
the mouse_click(type) function and pass the nsc variable
to it. This is to determine what kind of click is called.
Reset nsc to zero afterwards.
For this test, the screen resolutions that would be
used are 800x600, 1024x768, 1280x1024, and the
camera resolutions used are 640x480 and 320x240.
These resolutions are commonly found or supported
by most projectors. Testing results are shown in
Table 3 – 5.
Table 3: Results from an 800x600 display resolution.
Camera
Resolution
Best Accuracy
Achieved
Worst
Accuracy
Achieved
640x480 99.99% 97.02%
320x240 99.99% 96.88%
Table 4: Results from a 1024x768 display resolution.
Camera
Resolution
Best Accuracy
Achieved
Worst
Accuracy
Achieved
640x480 99.99% 97.33%
320x240 99.99% 96.51%
Table 5: Results from a 1280x1024 display resolution.
Camera
Resolution
Best Accuracy
Achieved
Worst
Accuracy
Achieved
640x480 99.99% 97.23%
320x240 99.99% 96.58%
The 640x480 camera resolution was able to
process an average of 15 frames per second while
the 320x240 camera resolution was able to process
an average of 28 frames per second. Doubling the
camera resolution halved the frames per seconds
obtained.
The best accuracy was always achieved at the
four corners of the projected screen. The reason
could be because the accuracy algorithm used these
points to define the screen boundaries.
On average the system can be said to be over
98% accurate. The testing results confirm the
proposed accuracy algorithm provides a perfect
answer to the two questions in section 4.1.
5.2 Clicking Test
The purpose of the clicking test evaluates how well
the system simulates the clicking action by using
laser pointer instead of the mouse.
There are 3 click actions involved; a left click, a
double left click and a right click. A left click action
is done by turning off and on the laser pointer,
simulating the left click of a mouse. A double left
click action is done by turning off and on the laser
pointer device twice within a space of 1 second. A
right click action is done by turning off and on the
ICEIS2015-17thInternationalConferenceonEnterpriseInformationSystems
550
laser pointer thrice within a space of 1 second,
simulating a right click of a mouse.
The testing results show that the approach
worked perfectly on PowerPoint slides.
The application was also tested on DirectX game
applications but it didn’t work. Further research into
a solution resulted in the need of using the DirectX
API to simulate a mouse which remains as future
work.
5.3 Evaluation
Comparing the developed screen detection method
(section 4.2), against Rajeshs’ (2010) rectangle
shape recognition algorithm, the image does not
need to be rotated to detect the quadrilateral screen.
Rajeshs’ binary segmentation algorithm wouldn’t
have been able to separate the screen from the
background because it requires the background
colour to be known. Since this application is being
developed to be used in unknown environments the
Canny detector (section 3.3.) proved to be superior.
The Laser-touchscreen (L.T.) developed in this
project can be said to be accurate based on the
results from the accuracy test carried out. The
camera and the laser pointer used cost less than $100
which is relatively cheap. The interaction range of
this system is dependent on the range of the laser
light. The laser pointer used has a range 3 miles
(DIGIFLEX, 2015). This system can simulate three
mouse actions and also move the mouse cursor to
the position of the laser dot. Different laser pointer
devices can be used – its parts are interchangeable
(P.I.)
Comparing this project with two interactive
commercial devices described in section 2, E.W and
USB P.W. would help to prove the usefulness of this
project.
Table 6: Comparing similar devices.
E.W USB W. P. L.T
Reliable
Yes Yes Yes
Cost
Expensive Cheap Cheap
Range
Short Medium Long
Accurate
Yes N/A Yes
P.I.
N/A No Yes
Table 6 shows that the developed prototype can
easily replace the use of an electronic whiteboard
and a USB wireless presenter.
The test results illustrate that using a higher
camera resolution could improve the accuracy but at
the same time reduce the number of frames that can
be processed in a second. It all comes down to
sacrificing the application’s speed against its quality
(accuracy).
6 CONCLUSIONS AND FUTURE
WORK
In this paper, a novel approach for using a laser
pointer as a mouse while using a cheap camera is
presented. The cheap camera used makes the
implementation of this system attractive to potential
users and perhaps financially feasible. The
application area of this project is focussed on
PowerPoint (or a similar sort) presenters as the result
from the testing and evaluation proves the
possibilities of using a laser pointer as a mouse to be
achievable.
To achieve this approach, a novel screen
detection method (based on a simple pattern
recognition technique), a laser detection method, and
an accuracy algorithm were developed, which were
successfully used to create the laser-touchscreen
system.
While the prototype meets all requirements set
out within the aims of the project, a vital issue
remains. For future development, further research is
required to determine the best course of action on
how to improve the developed accuracy algorithm so
it works better under terrible setups. Either by
improving the existing prototype or by creating a
new standalone project for the sole purpose of
improving its accuracy.
Another possible application area is in gaming if
the DirectX API is implemented. We believe it
would be very user friendly in first person shooter
games or games where the user is required to aim at
a particular area on the screen to achieve a goal.
Once a more improved accuracy algorithm has
been developed, image processing chips could be
looked into and how it could be integrated into a
projector alongside with a good quality camera.
Integrating all the external components utilised in
this project into a single device would ensure proper
setup and would be widely welcomed by non-
technical users.
REFERENCES
Bailey, D. G., 2011. Design for Embedded Image
Processing on FPGAs. Singapore: John Wiley & Sons
(Asia) Ltd.
Beauchemin, M., 2013. Image thresholding based on
semivariance. International Association for Pattern
AnApproachtousingaLaserPointerasaMouse
551

Recognition 34(5). Pp. 456-462.
DIGIFLEX, 2015. TRIXES 5in1 Green Laser Pointer Pen
with 5 Patterned Projection Caps. Retrieved January
27, 2015 from. http://www.digiflex.co.uk/p-2046-
trixes-5in1-green-laser-pointer-pen-with-5-patterned-
projection-caps.aspx.
Hinz, S., 2005. Fast and subpixel precise blob detection
and attribution. IEEE International Conference on
Image Processing, Vol 3, pp. 11 – 15.
Huang, T. S., Aizawa, K., 1993. Image Processing: Some
challenging Problems. Proceedings of the National
Academy of Sciences of the United States of America,
90(21), pp. 9766-9769.
Luo, Y., Duraiswami, R., 2008. Canny edge detection on
NVIDIA CUDA. IEEE Computer Society Conference
on Computer Vision and Pattern Recognition
Workshops. Anchorage, Alaska, USA, pp.1-8.
Moon, W. K., Shen, Y., Bae, M. S., Huang, C., Chen, J.,
Chang, R., 2013. IEEE Transactions on Medical
Imaging. 32(7), pp. 1191 – 1200.
OpenCV, 2014. Basic Thresholding Operations. Retrieved
January 20, 2014 from. http://docs.opencv.org/doc/
tutorials/imgproc/threshold/threshold.html.
Parker, J. R., 2010. Algorithms for Image Processing and
Computer Vision (2nd ed.). Indiana: Wiley Publishing,
Inc.
Rajesh, F., 2010. Rectangle shape recognition using one-
dimensional array. IEEE International Conference on
Computational Intelligence and Computing Research.
SANOXY, 2015. RF Wireless remote control USB
PowerPoint PPT presenter laser pointer PenSmart.
Retrieved January 27, 2015 from.
http://sanoxy.com/product/computer-accessories-
presentation-pointers/laser-pointer/
Sharma, V., 2012. A blob representation for tracking
robust to merging and fragmentation. IEEE Workshop
on Applications of Computer Vision. Colorado, USA,
pp. 161-168.
SMART, 2015. SMART Board 8000 Series. Retrieved
January 27, 2015 from. http://smarttech.com/
Home+Page/Solutions/Business+Solutions/Products/8
000+series+interactive+flat+panels.
WaveMetrics, 2014. Image Threshold. Retrieved February
17, 2014 from. http://www.wavemetrics.com/
products/igorpro/imageprocessing/thresholding.htm.
Yao, N., Liu, Z., Qian, F. & Sun, Z., 2013. Target
Tracking Method Based on Image Patches Exemplars.
Journal of Computational Information Systems 9(21).
Pp. 8561-8570.
ICEIS2015-17thInternationalConferenceonEnterpriseInformationSystems
552
