
A Defect Dependency based Approach to Improve Software Quality
in Integrated Software Products
Sai Anirudh Karre and Y. Raghu Reddy
Software Engineering Research Center, International Institute of Information Technology, Hyderabad, India
Keywords: Defect Dependency, Defect Dataset, Dependency Metric, Software Quality, Integrated Software Products,
Rule-based Classification.
Abstract: Integrated software products are complex in design. They are prone to defects caused by integrated and non-
integrated modules of the entire integrated software suite. In such software products, a small proportion of
defects are fixed as soon as they are reported. Rest of the defects are targeted for fixes in future product
release cycles. Among such targeted defects, most of them seem to be insignificant and innocuous in the
current version but have the potential to become acute in future versions. In this paper, we propose an
approach to study defect dependency of the reported defect using a dependency metric. Identifying the
dependency of a defect in an integrated product suite can help the product stake-owners to prioritize them
and help improve software quality.
1 INTRODUCTION
Integration of two or more software products forms
an integrated software product. Usage of large-scale
integrated products is increasing in software
industry. Expanding business operations, desire for
increasing top-line revenues, increasing
organizational synergy, providing value-adds to the
customers, etc. are some of the reasons contributing
to this increased usage of integrated products. In
most integrated software products, the entire product
may not essentially be exposed to all the direct end
users. Access may be provided to requisite business
layers (sub-product or a module/sub-module) that
specific users may use to execute their regular
business activity.
Defects are not exceptional to integrated
software products. If they are sensed, they require a
good slice of time and effort of developers and
testers to deal with them. Severe challenges arise for
industries that are directly dependent on integrated
software products when they go in for acquisitions
or mergers. They tend to invest additional resources
and time on merging existing softwares which are
used independently. The defects are recorded when
they go operational with integrated software suites.
These defects are difficult to address due to higher
degree of dependency between each other. For
example, let’s consider an E-Commerce integrated
software product consisting of the following two
sub-products: Supply-Chain and Revenue Reporter.
The major objective of Supply-Chain sub-product is
to track product billing while the other sub-product’s
objective is to report revenue. One of the most
common defects in the integrated product is
rounding-off of the product price. As an end result
for the integrated product, revenue reports incorrect
data. If the results are taken separately, rounding-off
defect can be insignificant for chain-supply but is
critical for product billing. In such scenarios,
product development team working on the supply
chain product might decide not log it as a defect or
even if it’s logged, they may not choose to address
the defect in the current release or not to address it at
all. The same defect is considered as a severe defect
for revenue reporter and hence needs to be addressed
at once. In such cases, prioritization of the defect
becomes important.
Product developers might not be able to judge
the criticality of the defect in the integrated product
until the cause of the issue is identified. Hence, this
defect becomes more of a concern to the budgeting
team than product development team. This gap can
be filled if there exists a criterion to evaluate defect
dependency in the integrated software products, such
that the corresponding defects can be prioritized.
The stakeholders involved may then choose to fix
110
Karre S. and Reddy Y..
A Defect Dependency based Approach to Improve Software Quality in Integrated Software Products.
DOI: 10.5220/0005368801100117
In Proceedings of the 10th International Conference on Evaluation of Novel Approaches to Software Engineering (ENASE-2015), pages 110-117
ISBN: 978-989-758-100-7
Copyright
c
2015 SCITEPRESS (Science and Technology Publications, Lda.)

the defect based on the prioritization results. Given
this context, the major contributions of the paper are:
Deduce an approach to study the dependency of
defects among respective modules or sub-
products in an integrated software product.
Introduce methods to measure the defect
dependency using machine-learning techniques
like rule-based classification and Generalized
Dependency degree Γ over a defect dataset.
Evaluate the proposed approach over a real time
defect dataset of an integrated software product.
The rest of the paper is organized as follows:
Section 2 provides an overview of the related work
and Section 3 details the background needed to
understand our approach. Section 4 talks about the
proposed approach. Section 5 and 6 discusses
experimental details and their results. We provide
some threats to our approach in section 7 and
suggest possible future work in Section 8.
2 RELATED WORK
Clarke formulated the initial work on defect
dependency by proposing a model over program
dependencies (Clarke LA, 1990). Generalizations of
control and data flow dependencies were studied
from both semantic and syntactic perspective. The
dependency implications over tester and debuggers
were recorded. (Laporte, 1998) listed down the
challenges and laid out processes required for
developing an efficient integrated software product.
The study stressed on improving quality from initial
stages. (Suryn, 2004) proposed a generic life cycle
model for integrated software with high stress on
quality during development. (Trinitis, 2004) were
the first among others to study on dependencies of
models in integrated softwares. They concentrated
more on quality of software in integrated mode for
better implementation and integrity strategies. Their
work was oriented towards reliability and
maintainability. Such dependency study is now
required from design and development perspective.
(Schertz, 2005) were the first to study on
methods to quantify and understand integration
testing. They proposed a new approach based on
binary dependency framework that can determine
control and data dependencies using dependency
graph. (Nagappan, 2007) have studied relationship
between software dependencies and churn measures
to assess failure using statistically methods. (Sallak,
2014) proposed probability based methods to study
dependency and independency of modules from a
reliability perspective.
Different approaches are currently followed
by software practitioners for building integrated
software. Moog Inc. has introduced an integration
testing tool (Moog, 2014) for software used in the
manufacturing industry. It studies and evaluates the
behaviour of workflow in a multi-component
software product. LDRA is another business leader
which markets testing solutions to manufacture
industries (LDRA Inc., 2014); they use integrated
softwares for detecting the functional and raw-data
faults. SAP Labs also provide testing solutions (SAP
Labs, 2011) which studies the integration defects
using priority & prediction methods with supplied
pre-input test data. Oracle provides application
testing tool (Oracle, 2014), which includes analysis
on studying integral flow on inter-related modules
with automation in test case generation. Failure
mode effect analysis & Fault tree analysis (Tague,
2004) are most widely used methods in current day
integration testing tools. However, they lack
methods for assessing the dependencies of a defect
over entire software product.
(Gartner, 2014) had released an analyst
report with Magic Quadrant for Integrated Software
Quality Suites. They identified market leaders who
provide tools to industries to test qualitative
integrated software products. From the report, the
common theme seems to the focus on automation of
functional and load testing of the integrated
softwares. Common deficiencies across all such
quality suites include integral dependency of defects,
defect life cycle, etc.
3 BACKGROUND
This section provides brief overview of existing
methods used as part of our approach to study
dependency among real-time entities.
3.1 Rule based Classification
Classification is a data mining technique used to
understand and extract desired data patterns. Rule
based classification or classifier is a type of
classification based on a set of rules/conditions.
While performing an experiment, it can be difficult
to operate on the entire dataset. Hence certain rules
can be applied to extract desired patterns from our
experiment dataset to perform the experiment. Rule
base classification works efficiently over larger and
complex datasets. This is applied using series of
ADefectDependencybasedApproachtoImproveSoftwareQualityinIntegratedSoftwareProducts
111
conditions for pattern extraction. It is fast and
efficient in generating accurate patterns for the
experiment.
Introduced by (Cohen, 1995), this classifier uses
IF and THEN conditions to extract desired data
pattern for evaluating our approach. For example, let
us consider a dataset C from which we want to
extract specific data pattern. We need to pre-process
the dataset first (i.e. prune – choose only required
data attributes on which we are interested to assess)
and then apply IF and THEN conditions on pruned
dataset C to extract the criteria. Tools like WEKA®,
CART, Apache Mahout and Orange®, etc. - can be
used to prune the unstructured dataset and apply
respective method to fetch desired output. In this
paper, we use this classifier to extract desired data
pattern from defect dataset to evaluate the proposed
approach.
3.2 Generalized Dependency Degree
Rough set theory is a mathematical approach to
study sets or entities. Initial developments to rough
set theory were proposed in (Pawlak, 1999). Specific
studies on set dependency and dependency over
equivalent classes were first proposed. (Haixuan,
2007) later proposed a generalized dependency
degree Г defined below, which helps to deduce the
list down the dependencies of two sets over one
another.
Г(O, H) =
||
∑
|
∩
|
|
|
(1)
Here O & H are two equivalent classes that are
generated over an equivalence relation framed from
some disjoint sets of universal set D.
Many researchers have adopted this
concept to address dependency issues. (Ivo, D,
2000)
implemented this method using statistical
approach to evaluate dependency. (Shamaei, 2011)
have practically applied in the field of artificial
intelligence to study the inter-dependency along
with probability methods. In this paper we are
adopting this generalized dependency degree to
study the defect dependency over defect dataset.
4 PROPOSED APPROACH
This section contains details of proposed approach to
study dependency of a defect among software
modules or sub-products using a new metric called
Dependency Metric (denoted by D*).
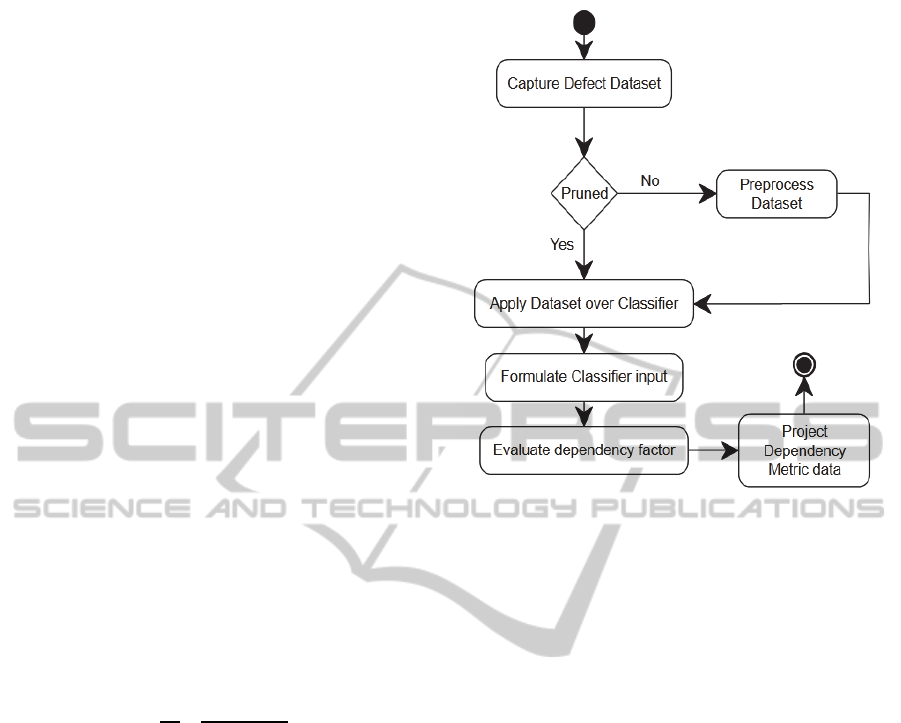
Figure 1: Approach to find dependency factor.
4.1 Pre-processing Defect Dataset
The first step in our approach is to identify and
capture the required attributes (for example, defect
reports) of the defect dataset. The input dataset may
not always be accurate for performing dependency
study. In practice, the defect dataset may contain lot
of noise (unrelated data). Presence of noise patterns
in source defect data can result in incorrect
observations.
This noisy data is not relevant for dependency
evaluation and hence the input defect dataset must
be pre-processed to remove noise. Stake-owners
should filter the bug reports and come up with
required dataset. Machine learning techniques like
outlier analysis or other anomaly detection methods
can be performed to remove noise. Noise free
dataset can be re-used to perform dependency study
for any number of times.
4.2 Apply Rule-based Classifier on
Dataset
Pre-processed dataset will be passed as an input to
rule-based classifier. Rules are to be defined by the
stake-owners on desired attributes. Rules follow IF
and THEN conditions to formulate input data into
required buckets. These rules are flexible enough to
be operated at multi levels i.e. multiple IF and
THEN conditions.
ENASE2015-10thInternationalConferenceonEvaluationofNovelSoftwareApproachestoSoftwareEngineering
112

Let us consider an enterprise integrated software
product L – consisting of p
1
, p
2
, p
3
... p
n
as
products. These may further contain sub-products or
modules as given below:
p
1
= {m
1
, m
2
, m
3
, m
4
… m
n
}
p
2
= {t
1
, t
2
, t
3
, t
4
... t
n
}
p
3
= {s
1
, s
2
, s
3
... s
n
}
...
p
n
= {y
1
, y
2
, y
3
... y
n
}
where m, n ... y are modules in the respective
product pillars. Similarly, m
1
as a single module
might further contain sub-modules resulting into a
complex software product. For such Enterprise
products, defects can be substantial, primarily due to
the multiple levels of integration needed. It is
difficult to perform an overall dependency study on
such large dataset. Hence, specific rules are to be
defined to classify the dataset into buckets and
extract required defect data. Below can be an
example for writing a rule R where
Rule R: IF P = p
2
AND p
3
THEN M = t
1
,t
2
,t
3
,s
5
,s
7
where p
2
, p
3
are products and t
1
, t
2
, t
3
ϵ p
2
and s
5
, s
7
ϵ p
3
. These rules can also be applied
on different versions of similar product to study the
nature of defects d ϵ D, where D is Universal set of
defects reported in product L.
4.3 Construct Attribute Value Table
for Defect Dataset
Using d (obtained from rule R), defects should be
organized either in numeric form or in an attribute
format for evaluation. To calculate the dependency
metric, we need to convert the data points in dataset
into disjoint sets. This is achieved by generating an
information system that can be represented using
attribute-value table. The table consists of rows and
columns, where rows are labelled by objects of the d
and columns by components in L. d is considered as
a collection of disjoint sets of modules of product L,
with attribute in rows against respective defect in
columns.
Using rule set R and defect set d, below is
the sample attribute-value table.
Table 1: Attribute-value table for H Defect Dataset.
Attribute-value defect table
p
2
p
3
t
1
{d
1
, d
2
, d
3
} -
t
2
{d
7
, d
8
, d
9
} -
Table 1: Attribute-value table for H Defect Dataset (cont.).
Attribute-value defect table
p
2
p
3
t
3
{d
12
, d
4
, d
5
} -
s
5
- {d
8
, d
1
, d
7
}
s
7
- {d
5
, d
0
, d
4
}
There are many ways to construct attribute value
tables. We have adopted manual listing of d against
components of L for sake of simplicity. It’s stake-
owner’s choice to re-structure data by grouping them
to form disjoint sets and have them recorded so that
they are readable. Alternatively, the construction of
attribute value table can be automated.
At times datasets may or may not be flexible
enough to be described in a tabular format. In such
cases defect (d) - component (L) attribute values can
be visualized using tree based view, tile based view
matrix based view, etc. The main reason for
creating an attribute-value table is to describe the
disjoint-ness of the defects reported across the
integrated software within respective products and
modules.
4.4 Training and Test Dataset
It is always recommended to first create a training
dataset (samples) with defect counts of specific
modules for sandbox validation. Say M is a module
with o
1
, o
2
, o
3
... o
n
where ∀o
n
ϵ M as
defects, a sample out of M can act as a Training
Dataset. Upon successful validation of the training
dataset, the metric can be applied over a business
specific rule to generate the actual experiment’s test
dataset. The primary purpose of creating a training
dataset is to estimate time and resource to perform
the experiment.
Test dataset is a superset dataset chosen from
collection of training dataset ϵ D. If the stake-
owners would like to perform the experiment for
entire suite to compare module level defect
dependency, the approach can be applied on entire
defect dataset.
4.5 Dependency Metric
Say defects reported in product p
i
are defined as d
pi
such that
{d
p1
⋃d
p2
⋃d
p3
... ⋃ d
pn
= D}
(2)
Here d
p1
, d
p2
, d
p3
... d
pn
are disjoint defect
sets of respective products belongs to defect dataset
D. Also
ADefectDependencybasedApproachtoImproveSoftwareQualityinIntegratedSoftwareProducts
113

{d
p1
⋂ d
p2
⋂ d
p3
... ⋂ d
pn
= ɸ}
(3)
Here d
p1
, d
p2
, d
p3
... d
pn
are disjoint defect
sets of with no common defects. In practice, such
defects form disjoints sets and can be further drill
downed to module or sub-modules of L.
Equivalence relation (E) can be generated over d
pi
.
A new defect set D
e
is constructed which comprises
equivalent classes of E over D i.e. D
e
is collection of
sets of equivalent classes of E.
If D
e
is considered as collection of equivalent
classes defined over D, using generalized
dependency degree (1) from rough set theory D
e
is
be applied in D*, the dependency metric as (using
(1))
D* = Г(O, H) (4)
Here O & H are two equivalent classes belong to D
e
.
In case of more than two disjoint sets A
1
, A
2
, A
3
,
A4…A
n
exists, then the function Γ is operated by
constructing of distinct equivalent classes of all
these disjoint sets. Then the metric D* is defined as
Γ(A
1
,A
2
,……A
n
).
To understand the notion of disjoint sets and to
study how generalized dependency degree is
calculated, let’s consider the example of an
influenza dataset from (Haixuan, 2007). This dataset
is simple and pruned so that it is feasible to calculate
Г. It contains 7 user samples (U) of influenza (d)
affected people with the symptoms Headache (a),
Muscle pain (b), Body temperature(c). The
equivalence relation was represented in a tabular
format.
During pruning the dataset, decision values are
defined to construct the dataset in tabular format.
Headache (a) has a decision values Y for user who
has headache and N for user who has no headache.
Muscle pain (b) has decision values Y for user who
has muscle pain and N for user who has no muscle
Table 2: An Influenza Dataset.
U
Headache
(a)
Muscle
pain
(b)
Body
temperature
(c)
Influenza
(d)
e1 Y Y 0 N
e2 Y Y 1 Y
e3 Y Y 2 Y
e4 N Y 0 N
e5 N N 1 N
e6 N Y 2 Y
e7 Y N 1 Y
pain. In case of body temperature(c) 0 - low, 1 -
medium and 2 - high. Aggregated to form an
equivalence relation, influenza (d) takes Y for yes
and N for no influenza.
Let A={a,b,c,d} be the corresponding set
of attributes on whose disjoint subsets the
dependency degree is calculated,
U={e1,e2,e3,e4,e4,e5,e6,e7} are the
user samples. Using Table 1, when created two
disjoint subsets to operate on O= {a,b,c} &
H={d} where we will be finding dependency
degree of H over O. Below are the equivalence
classes defined for set O and H.
O(e1)={e1}, O(e2)={e2}, O(e3)={e3},
O(e4)={e4}, O(e5)={e5}, O(e6)={e6},
O(e7)={e7},
H(e1)=H{e4}=H{e5}={e1,e4,e5},
H{e2}=H{e3}=H{e6}=H{e7}={e2,e3,e6,e
7}
Then we have
Г(O,H)=
|
⋂
|
|
|
|
⋂
|
|
|
|
⋂
|
|
|
|
⋂
|
|
|
|
⋂
|
|
|
|
⋂
|
|
|
|
⋂
|
|
|
/7
= (1+1+1+1+1+1+1)/7 =1
Therefore the Г(O,H) =1, which is nothing but the
generalized dependency degree of set H over set O.
Similarly we can calculate the generalized
dependency degree over other sets as well.
4.6 Metric for Software Quality
We propose this Generalized Dependency degree Γ
as a Dependency metric (D*) so as to calculate
dependency of a defect over chosen entities. (D*)
can be calculated by framing a equivalence relation
of defect dataset, subsequently framing it’s
equivalent classes on disjoint defect sets over a D
will generate a justifiable value to judge what and
when to prioritize. D
e
– the set of defect equivalence
classes, should be first deduced from training dataset
as a preliminary sample test. Later the approach
should be applied over test dataset.
The scope of evaluating this metric study is up to
the evaluation requirement of the stake-owners who
are performing the action. If they would like to study
the scope of dependency of a defect set over entire
product, the classification step can be ignored and
the entire integrated product suite becomes a test
ENASE2015-10thInternationalConferenceonEvaluationofNovelSoftwareApproachestoSoftwareEngineering
114

dataset. Currently there is no generic scale defined
for metric D*, but the results mostly range between
0 and 10. Practitioners should be able to create a
scale as per results obtained via training dataset.
Scale might differ while calculating this metric from
product to product and between one input dataset to
another with in similar product. Subsequently, the
scale can be mapped to test dataset.
Below is an algorithmically approach to evaluate
a dependency metric over a defect dataset.
Algorithm DEPENDMETRIC(D,P,M,ER,EC)
begin
for i=1 to n do
read P
i
ϵ D //read products
for j=1 to m do
read M
j
ϵ P
i
//read modules
get rule:R //getrule
for k=1 to z do
read d
pk
//read defects
for l=1 to z
D = ER(d
pk
,R);
for l=1 to z
D
e
= EC(ER(d
pk
,R));
for l=1 to z
D*= Γ(EC
l
,D);
print D*
end
The algorithm is primarily meant to evaluate the
dependency metric and doesn’t focus on the time
complexity of the actual computation itself.
Improving the efficiency of the algorithm from a
performance perspective is beyond the scope of this
paper and shall be explored in future.
5 EXPERIMENT
A real time dataset was obtained from an
Information Technology product firm to perform an
experimental evaluation of our approach. Due non-
disclosure clause, we are unable to list the exact
name of the organization that provided the dataset.
Defect dataset “H” was extracted from an enterprise
bug-tracking tool called JIRA™. The “H” dataset
contains defects registered for HRMS (Human
Resource Management System) integrated software
product which has 3 products under one master
pillar (Learning Management System - LMS, Talent
Management System - TM & Payroll - WFM). The
3 products consisted of 7 integrated sub-modules
{(LMS – Administration, Manager and Reporting),
(TM – Succession, Compensation and Talent Book),
(WFM – Workforce and Pay book)}. The defect
dataset “H” contains the list of defects that were
considered insignificant in current version and hence
were targeted to be addressed in future versions.
Below is an attribute value table for “H” with
respective defect count against respective modules
and products targeted for fixes in future release.
Table 3: Attribute-value table for “H” Dataset.
Attribute-value defect table
P
1
P
2
P
3
M
1
24
-
-
M
2
56
-
-
M
3
4
-
-
S
1
-
9
-
S
2
-
7
-
T
1
-
-
43
T
2
-
-
24
As listed above - P
1
, P
2
& P
3
are 3 products that
are integrated as single pillar. Product - Module
relation is defined as follows {M
1
, M
2
, M
3
ϵ P
1
},
{S
1
, S
2
ϵ P
2
} and {T
1
, T
2
ϵ P
3
}. The figure
shows the number of defects targeted for future
versions under each product – module relation. For
example, table 3 shows that 24 defects are targeted
to be fixed for Product P
1
– module M
1
and 7 are
targeted to be fixed for Product P
2
– module S
2
.
Using “H”, rule based classifier was applied to
perform the study of dependency of defects in a
given module with another within chosen products.
Below are the three rules extracted and applied to
study the dependency with in each rule using the
DEPENDMETRIC algorithm mentioned in the
previous section:
Rule 1: IF Product = P
1
& P
2
THEN Module = M
1
& S
1
Rule 2: IF Product = P
1
& P
3
THEN Module = M
2
& T
2
Rule 3: IF Product = P
2
THEN Module = S
1
& S
2
For each rule, Equivalence relation was
programmatically calculated. For example, in case
of rule 1, 33 defects (24 + 9) are used to frame the
equivalence relation. Later, its equivalence classes
are generated and applied over Dependency metric
D* to calculate how each chosen module is
dependent on each other.
6 RESULTS
Dependency metric D* was calculated using
ADefectDependencybasedApproachtoImproveSoftwareQualityinIntegratedSoftwareProducts
115

equation (1). The results for respective rules (Rule 1,
Rule 2, and Rule 3) are shown in table 4, 5 and 6.
Table 4: D* for Rule 1.
D* P
1
P
2
M
1
0.76
0.59
S
1
0.21
1.04
Table 5: D* for Rule 2.
D* P
1
P
3
M
2
0.89
0.23
T
2
0.14
0.97
Table 6: D* for Rule 3.
D* P
2
S
1
0.47
S
2
0.31
By summarizing above results for Rule 1,
dependency metric for modules M
1
& S
1
within
products P
1
and P
2
can be deduced. In this case, M
1
module is more dependent (
D* value is 1.35) when
compared with module S
1
(D* value is 1.25) over
products P
1
& P
2
. The stakeholders can use this
value to place M
1
module with high priority than
fixing S
1
module.
In case of Rule 2, module M
2
appears to be more
dependent when compared with module T
2
over
products P
1
& P
3
. If defects arising from P
1
and P
3
are to be fixed, module M
2
should be given more
priority than T
2
. Similarly, for Rule 3, defects related
to module S
1
should be prioritized compared to S
2
.
The above given metric values provide us a
quantitative basis for addressing defects pertaining
to specific components with in integrated software
product. Based on the defect dependency metric
value, we were able to list down most critical
modules or sub-product that needs to be prioritized
to improve the quality of integrated software
product.
7 THREATS TO VALIDITY
The defect dependency metric provides a
quantitative number for assessing the importance of
fixing defects in a particular product or module or
sub-module in the context of an integrated product.
The technique can be used to drill down to a assess
defect dependency on specific defects. However the
validity of the results are still to be assessed.
Currently we have been able to monitor the results
for only one release of the integrated product. The
employees of the product firm followed the normal
defect-fix cycle and fixed defects without taking
defect dependency into consideration. We used our
approach to compute the defect dependency value.
However, to appropriately know the impact on our
approach compared to the previous approach we
need multiple releases of the integrated product and
the corresponding defect datasets.
Rough set theory forms the basis for our
approach. One of the fundamental concepts of rough
set theory is the notion of disjoint sets. In other
words, our work assumes that the defects are disjoint
from each other in the defect dataset. We have not
considered cases where in the defect has been
double counted or the same defect has been logged
in semantically different manner
Another threat to our study is the interpretation
of the defect dependency value. It needs to be noted
that ultimately the stake-owners have to make a
decision on prioritization of defects in a specific
order by taking into account factors like business
strategy, competition, time to market, etc. in real
world. In our work, we have not considered these
factors and have just compared it based on a high-
low basis.
8 CONCLUSION AND FUTURE
WORK
In this paper, we proposed an approach to help the
stake-owners prioritize defects with in modules with
higher dependency degree. This in turn leads to
better defect resolution cycle. If the approach is
practised in every future release cycle it can lead to
significant improvement in the quality of the
integrated product. This also avoids surprise
functional breakdown of the entire suite in future
versions.
There are few shortcomings with our approach
that we plan to address as part of our future work.
Dependency metric is an initial attempt to study
the dependency of a defect over a software
product and is not the only solution to the
reported problem. Other methods are yet to be
formulated to justify and address the real time
issues.
While extracting the rules from defect dataset,
we need to take care while pruning the dataset.
We need to ensure that the defects are genuine
ENASE2015-10thInternationalConferenceonEvaluationofNovelSoftwareApproachestoSoftwareEngineering
116

and they belong to respective modules in the
integrated software product. Also it must be
ensured that the defect reports have relevant
relation with master product and are targeted for
future release.
Below are the open challenges that require
further study:
Improve time-complexity of proposed approach
and automate the calculation of the dependency
metric.
Current approach should be scaled downed from
module level to the level of single defect for
more significant results
Proposed dependency metric is only generalized
for targeted defects. Further study is required to
analyse the defect behaviour among modules
that are shared among multiple product.
ACKNOWLEDGEMENTS
Authors would like to thank Product Managers from
software industry for their extended support on
sharing their valuable feedback and real time data
set for evaluation & validation.
REFERENCES
Clarke LA, Podgurski A (1990) ‘A formal model of
program dependences and its implications for software
testing, debugging and maintenance’, IEEE Trans
Software Eng, pp. 965–979.
Laporte, C.Y (1998) ‘Development and Integration Issues
about Software Engineering, Systems Engineering and
Project Management Processes’, Actes - Software
Process Conference, Monte Carlo.
Pawlak, Z. (1999) ‘Rough classification’, In International
Journal of Human-Computer Studies, pp. 369–383.
Gunther, G., Ivo, D. (2000). ‘Statistical techniques for
rough set data analysis in rough sets: New
developments’, pp. 545–565. Heidelberg/Berlin,
Physica Verlag, Springer-Verlag Publishers.
Gediga G, and Ivo Düntsch (2001) ‘Rough approximation
quality revisited’. Journal on Artificial Intelligence,
Elsevier Science Publishers, pp. 219–234.
Trinitis. C, Walter, M. (2004) ‘How to Integrate Inter-
Component Dependencies Into Combinatorial
Availability Models’, Annual Reliability and
Maintainability Symposium (RAMS) Proceedings.
Modeling and Simulation Techniques.pp. 226 – 231.
Ball T, Nagappan N (2007) ‘Using software dependencies
and churn metrics to predict field failures: An
empirical case study’ In International symposium on
empirical engineering and measurement, Madrid,
Spain, pp. 364–373.
William W. Cohen. (1995) ‘Fast effective rule induction’,
In Proc. of the 12th International Conference on
Machine Learning. Tahoe City, CA, pp. 115-123.
Trinitis. C, Walter, M. (2004) ‘How to Integrate Inter-
Component Dependencies Into Combinatorial.
availability Models’, Annual Reliability and
Maintainability Symposium (RAMS) Proceedings.
Modeling and Simulation Techniques.pp. 226 – 231.
A. Srivastava, T. J., and C. Schertz, (2005) ‘Efficient Inte-
gration Testing using Dependency Analysis’ Micro-
soft Research-Technical Report.
Nancy R. Tague (2004) ‘The Quality Toolbox’, 2
nd
Edition, ASQ Quality Press, pp. 236–240.
Suryn W., Abran A., Laporte, C.Y (2004), ‘An Integrated
Life Cycle Quality Model for General Public Market
Software Products’. Actes-12th International Software
Quality Management & INSPIRE Conference (BSI)
Canterbury, Kent. pp. 5–7.
Daniel Lowd, Arash Shamaei, (2011) ‘Mean Field
Inference in Dependency Networks: An Empirical
Study’, Association for the Advancement of Artificial
Intelligence. San Francisco, USA.
Sebastien Destercke, Michael Poss, Mohamed Sallak,
(2014) ‘Reliability analysis with ill-known
probabilities and dependencies’, In Proceedings of
ICVRAM, Liverpool, United Kingdom, pp. 887-894.
Gartner Report, (2014) Magic Quadrant for Integrated
Software Quality Suites, Whitepaper [Online],
Available: https://www.gartner.com/doc/2833819/
magic-quadrant-integrated-software-quality [24 Aug
2014]
Haixuan Yang, Irwin King and Michael R. Lyu, (2007)
‘The Generalized Dependency Degree between
Attributes’ Journal Of The American Society For
Information Science And Technology. pp. 2280-2294.
Oracle (2014), ‘Oracle Application Testing Suite’,
Available: http://www.oracle.com/technetwork/oem/
app-test/etest-101273.html.
LDRA Inc. (2014), ‘Unit, System & Integration Testing’
Tool, Available: http://www.ldra.com/en/software-
quality-test-tools/group/by-software-life-cycle/unit-
system-integration-testing.
SAP Labs (2011), ‘Integrated Product Development:
Managing for Speed, Quality, and Flexibility’
Available: http://www.sap.com/bin/sapcom/ro_ro/
downloadasset.2010-02-feb-08-08.integrating-product-
development-across-business-functions-pdf.html.
Moog (2014), ‘A integrated software test suite’, Moog Inc.
Available: ttp://www.moog.com/literature/ICD/Moog-
Test-AutomotiveTestSoftware-Overview-en.pdf,
http://www.moog.com/literature/ICD/Moog-Test-
IntegratedTestSuite-Overview-en.pdf.
ADefectDependencybasedApproachtoImproveSoftwareQualityinIntegratedSoftwareProducts
117
