
Using Personality Traits and a Spatial Ability Test to Identify
Talented Aspiring Designers in User-Centred Design Methodologies
Farshid Anvari and Deborah Richards
Department of Computing, Macquarie University, Sydney, Australia
Keywords: User-Centred Design, Holistic Persona, Scenario, Personality Traits, Big-Five Factors, Imagination, Spatial
Ability.
Abstract: User-Centred Design (UCD) methodologies have been increasingly used during the past decade to develop
software applications and products that are tailored to the needs of individuals and allow for human
computer interactions on emotional and psychological levels. UCD designers and developers need to have
special abilities and training to design products that meet the demands of users. This paper presents novel
techniques to identify talented aspiring designers in UCD methodologies. Twenty-three undergraduate
students, studying at a research-intensive metropolitan Australian university, participated in this study.
Participants completed a spatial ability test, answered personality trait questionnaires and performed a
design activity. Our results indicate that students who score high in the imagination personality factor and
spatial ability tests are talented aspiring UCD designers. The implication of our study is that talented
students who can design using UCD methodologies can be identified early in their studies and they can
benefit by receiving advanced training. Likewise the less talented students can be given extra tutoring as
abilities are not immutable and, interest and persistence is important in achieving expertise.
1 INTRODUCTION
User-Centred Design (UCD) methodologies, which
consider the goals of the users as the primary
requirement for developing software application
(Norman 1986), have been actively developed and
promoted by the Human-Computer Interaction
(HCI) community (Seffah and Metzker 2004) and
are increasingly used in software engineering
practices and processes (Aoyama 2007, Grimes et al.
2008), particularly in the design and development of
software applications and products (Vredenburg et
al. 2002). The performance of designers in carrying
out novel tasks depends on their abilities and
training, as well as their motivations (Maslow et al.
1987). The relationship between performance in
creative professions and personality has been studied
by a number of researchers (Feist 1998, Furnham
and Bachtiar 2008, Poropat 2009). It has been found
that professionals who have been successful in
domains such as architecture, engineering and
programming are good in spatial ability (Mohler
2006). In a longitudinal study of mechanical
engineering students, Field (2007) found that their
performance in design subjects was more related
with their intuition and spatial ability and less
related with their logical and mathematical ability. A
specific link between design, spatial ability and
personality has not been explored within software
engineering and UCD methodologies.
Based on these previous findings and the
identified gap, this paper presents a study that seeks
to identify talented aspiring designers in UCD
methodologies from among software engineering
students by their performance in a spatial ability test
and their answers to questionnaires which determine
their personality traits. This study also contributes to
our understanding of the personality traits and
abilities required for being a talented designer using
UCD methodologies.
The literature review in the next section
introduces the concept of persona and previous work
on intelligence, personality traits and spatial ability
followed by research questions, methodology,
results, discussion (includings threats to experiment
and measures to mitigate these), conclusion and
plans for future research.
90
Anvari F. and Richards D..
Using Personality Traits and a Spatial Ability Test to Identify Talented Aspiring Designers in User-Centred Design Methodologies.
DOI: 10.5220/0005366600900101
In Proceedings of the 10th International Conference on Evaluation of Novel Approaches to Software Engineering (ENASE-2015), pages 90-101
ISBN: 978-989-758-100-7
Copyright
c
2015 SCITEPRESS (Science and Technology Publications, Lda.)

2 LITERATURE REVIEW
Personas, archetypical users, are tools used within
UCD methodologies for software applications or
product design and communication with
stakeholders (Cooper 1999, Goodwin 2009,
Miaskiewicz and Kozar 2011). Scenarios are the
actions carried out by the personas interacting with
the applications (Goodwin 2009). Personas support
the design of the application by focusing on target
users and facilitating communication with
stakeholders regarding the scope and final outcomes
(Goodwin 2009). Personas are authored using
photographs, sketches, factual information gathered
by market research, such as demographics,
profession, hobbies and interests, etc. (Cooper 2004,
Goodwin 2009). Long (2009) reported a higher level
of empathy toward personas with photos of real
people compared with illustrated personas. To
improve the usability and accessibility of the
application, and hence reduce cognitive load on the
users, and for better communication with
stakeholders, Anvari and Tran (2013) proposed
Holistic Persona, a persona with five dimensions:
Factual, Personality, Intelligence, Knowledge and
Cognitive Process.
Intelligence is the ability to solve problems.
Gardner (1993) listed seven intelligences: linguistic,
logical-mathematical, spatial, musical, bodily-
kinaesthetic, interpersonal and intrapersonal.
Persons with innate ability or giftedness have high
talent in one or more domains; with little tutoring,
they can understand the abstract concepts, ask deep
questions, reflect on various interpretations of the
problems (Winner 2000) and can transfer their
knowledge from similar domains (Anvari et al.
2013). Plucker et al. (2004, p 156) based on a
number of peer reviewed journals defined creativity
as “the interplay between ability and process by
which an individual or group produces an outcome
or product that is both novel and useful as defined
within some social context”. Abilities are not fixed
and, interest and persistence is important in
achieving expertise (Lohman 2009).
Relationships between personality, creativity and
academic performance were studied by a number of
researchers. The Big-Five Factors (BFF) of
personality is widely used to understand the
structure of personality (Butt and Phillips 2008,
Chittaranjan et al. 2011, Hu and Pu 2013, Nov et al.
2013, Oliveira et al. 2013, Poropat 2009, Wilson et
al. 2010). Two models of the BFF of personality that
are used by researchers are Trait Descriptive
Adjective (TDA) by Goldberg (1993) and NEO
Personality Inventory, Revised (NEO PI-R) by Costa
and McCrae (1992). Both models use similar terms
to describe the five factors (Goldberg 1993).
According to Goldberg (1993) the BFF are: (1)
Extraversion, (2) Agreeableness, (3)
Conscientiousness, (4) Emotional Stability and (5)
Imagination or Intellect. Creative scientists were
more likely to have personality traits of extraversion
and openness to experience (Feist 1998, Furnham
and Bachtiar 2008) and academics were more likely
to be agreeable, conscientious and open to
experience (Read et al. 2007). Silvia (2008)
suggested that Plasticity (Extraversion and
Imagination) is more strongly related to creativity
than Stability (Agreeableness, Conscientiousness
and Emotional Stability). McCrae (1987) in a study
of 268 men found that openness to experience and
divergent thinking, a psychometric investigation of
the creativity, were correlated. Poropat (2009) in a
meta-analysis of students’ measures of academic
performance measured by grade point average found
that secondary and tertiary students’ performances
were related to consciousness and intelligence. In a
longitudinal study of engineering students, Field
(2007) observed that students who excelled in
design subjects did not necessarily do well in other
academic subjects; excellence in design requires
different abilities.
The importance of spatial ability in science and
engineering are studied by many researchers. Shea et
al. (2001) in a longitudinal study of 563 students in
late 1970s using Scholastic Assessment Test and
spatial ability tests found that those who scored
better in a spatial ability test had selected careers in
Science, Technology, Engineering or Mathematics
(STEM). Similarly Webb et al. (2007) in studying
1060 students during the 1990’s found that spatial
ability provided greater variance in predicting
individuals’ preferences for STEM. Wai et al. (2009)
drawing a random sample from the population of
400,000 students, who were longitudinally studied
for 11 years, found that among those who chose
careers in science, technology or mathematics scored
high in spatial ability during their adolescence.
Charyton et al. (2011) in a study of engineering
students found that their score in a Creative
Engineering Design Assessment, a test for
measurement of creativity in engineering, is related
to their performance in Purdue Spatial Visualization
Test of Rotation. Ault and John (2010) surveyed the
literature across the USA with the result that
students doing four year engineering courses
generally scored about 75% in the Spatial Rotation
of Visualisation test. Students with higher spatial
UsingPersonalityTraitsandaSpatialAbilityTesttoIdentifyTalentedAspiringDesignersinUser-CentredDesign
Methodologies
91

ability have been found to perform better in other
fields. Anvari et al. (2013) found that students with
high spatial ability had lower cognitive load while
performing 3D computer graphics drawing and were
better able to transfer knowledge from one domain
to another similar domain.
3 RESEARCH QUESTION &
METHODOLOGY
Based on the studies of Anvari et al. (2013),
Charyton et al. (2011), Feist (1998), Field (2007),
Furnham and Bachtiar (2008), Poropat (2009), Shea
et al. (2001) we find that both personality traits and
spatial ability are important in cognitively
demanding tasks such as creativity and design within
the software engineering field. Hence in this paper
we address the research question:
Can we use a spatial ability test and self-
assessment of personality traits to identify
talented aspiring designers in UCD
methodologies?
We conducted an empirical study to obtain data to
allow us to answer the above research question as
well as other research questions that were part of a
larger study concerning the influence of the Holistic
Persona on the designer and the relation between the
designer’s and persona’s personality traits. In the
study we investigated two factors of the personality,
extraversion and emotional stability. Our findings
for these other questions are reported elsewhere
(Anvari et al. 2015).
Before the study commenced, we provided a
brief introduction to UCD methodologies, an
example of a persona, a conceptual design and a
scenario; these materials were for educational
purposes only. Participants were then asked to give
consent if they wished to continue. The 75-minute
study consisted of six parts: demographics
questionnaires, self-assessed personality traits,
assessing four Holistic Personas, a design task for
one of the randomly assigned personas, post design
questionnaires and a spatial ability test. The parts
that are relevant to this paper are described briefly in
the following subsections. The final subsection
describes the evaluation and scoring of the
participant’s design.
3.1 Demographic Questions
Demographic questionnaires consisted of questions
about the participant’s gender, birth year,
occupation, interest in design, level of competence
in the English language, country in which they spent
their youth and the courses they are studying or have
studied. The demographic data was used for analysis
of the results.
3.2 Self-assessed Personality Trait
Participants rated their own personalities using
Goldberg’s 50 question Trait Descriptive Adjectives
(TDA) on a 5-point Likert scale. The test is adopted
from the literature (Goldberg 1993) and the
International Personality Item Pool (IPIP 2013). The
bi-polar answers to the self-assessment questions on
a 5 point likert scale are added together after reverse
scoring the negative questions (Goldberg 1993) to
provide results in the range of 10-50. The resultant
data is treated as interval-level data, converted to
percentages and analysed using R statistical
packages (Field et al. 2012).
3.3 Design Task
Participants performed a design session of 15
minutes duration with a Holistic Persona that was
assigned randomly yet evenly from a set of four
Holistic Personas that were authored to be very
similar to one another in all dimensions except in the
personality dimension. Two personality factors were
varied as shown in Table 1 (appendix one shows an
example of a Holistic Persona named Doris).
Table 1: Holistic personas and their personality traits.
Persona for design Extraversion Emotional Stability
Doris Extravert stable
Katie Extravert unstable
Minty Introvert stable
Eliza Introvert unstable
Participants wrote their conceptual design for a
software application or product of their choice that
would help the assigned Holistic Persona and a
scenario about how the Holistic Persona would use
the software application or product.
3.4 Spatial Ability Test
Participants performed a 20-item Purdue
Visualization of Rotation Test. This activity was
timed. The test consisted of 20 questions; each
question showed an object in a position and the
participant needed to mentally rotate the object to a
new position; there were 5 choices representing how
the object looks in the new position, one of which is
ENASE2015-10thInternationalConferenceonEvaluationofNovelSoftwareApproachestoSoftwareEngineering
92

correct. One mark was given for the correct answer
and there was no penalty for the wrong answer.
Participants’ total score at 10 minutes was selected
as the measure of their performance in the spatial
ability test (Bodner and Guay 1997).
3.5 Evaluation of the Design
Evaluation of the participants’ design was based on
the literature on the influence of personality traits on
human uses of software applications or products. For
example, Oliveira et al. (2013) found that extraverts
used their mobile phone more often and extraverts
and conscientious people were more satisfied with
the level of service they received from their mobile
phone service provider. Butt and Phillips (2008)
found that extraverts not only receive more calls but
spend more time changing the ring tone and wall
paper on their mobile phones however the
unconscientious, disagreeable and neurotic used
SMS in preference to calling. Nov et al. (2013)
found that the extraverts tend to be more responsive
in a more popular website and emotionally stable
people tend to be less influenced by a website’s
social anchoring.
Drawing on the literature and his industrial
experience as a designer and software engineer, the
lead author initially read all the design descriptions
and noted down all provisions and features that the
participants made to assist the Holistic Persona. He
compiled Table 2 and listed the following criteria
which are based on the Holistic Personas provided,
as an analytic scoring rubric in assessing the
participants’ design. The two personality traits of the
Holistic Persona that were present or absent,
extraversion and emotional stability, were
considered for assessing the design. The rubric was
independently examined by another two experienced
designers, Hien Minh Thi Tran and Deborah
Richards.
(1) The conceptual design can be an application
that is a diary, a calendar, a recommender or a
specialised forum; or
(2) it can be an abstract design with sufficient
description to visualise how the application works.
(3) A scenario for the Holistic Persona to interact
with the application.
(4) The participant is expected to refer to the
Holistic Persona by her name and the application
reminds her about applying skin lotion while
intending to walk in the sun, carrying eye glasses for
certain appointments, and alerting her to her
allergies while ordering food.
(5) The application is expected to concentrate on
food, exercise or weight as overweight is the main
issue the Holistic Persona is facing.
(6) Expressions that reflect consideration given
to the Holistic Persona while explaining the design
and scenario.
(7) The software application can be installed on a
generic device, a mobile phone or a personal
computer. Inclusion of a device that reflected the
personality of the persona attracted extra credit
The maximum score for the design work was 15
marks. Each participant’s design was assessed by the
lead author based on the rubric as explained in Table
2. The mark allocation was reviewed independently
by two other experienced designers and adjusted
accordingly to resolve any discrepancies.
4 ANALYSIS OF RESULTS
4.1 Participants
To maintain homogeneity and identify the
population from which the sample is drawn, for this
paper, we use the data from the undergraduate
students at Macquarie University, a research-
intensive metropolitan Australian University. The
participants who were aged between 18 and 38,
completed self-assessment of their personalities and
took part in the design activity. There were 23
participants. The majority of them (91 %) were
studying a second year Software Engineering subject
within the IT Department. The Software Engineering
subject is a core unit for students in the Software
Technology major in the Bachelor of IT and
Bachelor of Engineering students in the Software
Engineering major. The unit prerequisites are very
minor, so other students also take the unit to make
up elective credit points. We observed that the
students who chose to participate in this study were
primarily from one of the two majors. They were
invited to participate in this research during their
tutorial session without receiving any course credit
or financial benefit and thus students not majoring in
this area were less interested in the study’s activities
and findings. They participated in this study to gain
understanding of HCI design through exposure to
the UCD methodologies and tools and they all
indicated that they were interested in design; hence
they are referred to as aspiring UCD designers.
UsingPersonalityTraitsandaSpatialAbilityTesttoIdentifyTalentedAspiringDesignersinUser-CentredDesign
Methodologies
93
Table 2: Analytic scoring rubric for assessing a design task.
No Design
Features
Descriptions Marks assigned Examples (Quote)
(participants who gave their consent to
quote)
1 Application Recommending
an existing
application or
product for
food, exercise
or as a reminder
e.g. Forum,
Diary or
Recommender
5 marks in total
1 mark – mention an application
targeting the identified problems.
2 marks – providing details on
how the application works.
1 mark – providing for features
such as GPS to detect location,
online connectedness with other
systems and applications.
1 mark – suggestive goal setting,
automated reminder and advisory
activities.
A Virtual Diary / Reminder Application.
The virtual diary allows for entries based
on various user designed topics or sub
topics, weather that be health food ideas
or new music that they enjoyed, or
information relating to her social
activities. The reminder application will
utilize multiple parts of a phones system
2 Abstract
design
A new generic
application that
would serve the
persona
... a software program that ... should be
suggestive rather than informative, and
give her clear instructions as to what to
eat next. The program should also give
her goals (realistic) as to improve her self
esteem.
3 Scenario Holistic
persona’s
interaction with
the application
3 marks in total
1 mark – mention an interaction
with the application for a query
3 marks –an interaction with the
application to carry out a task
... ping or notify her of various reminders
and set goals for her to do each day and
she can fill these out like a survey and the
coach will say some words of
encouragement ...
4 Factual Name
Allergy
Skin lotion
Short
sightedness
2 marks in total
0.5 mark –refer to Holistic
Persona by name
0.5 mark – refer to her allergy
0.5 mark – refer to her skin
disorder
0.5 mark – refer to her short-
sightedness
... to mention that she is allergic to food,
... away from her glasses ... device can be
attached to Doris' sun-screen lotion
container
5 Weight
Issue
Suggestions of
food or exercise
2 marks in total
1 mark – acknowledging the
problem by mentioning food or
exercise.
2 marks – providing a feature for
use to address the weight issue.
... allow Minty to keep track of what she
eats--both for allergies and taking care of
weight. An app that will allow Minty to
plan her meals a week at a time, keep
track of her exercise, and tell her if she is
eating too much based upon her exercise
regime.
6 Suitable to
the Holistic
Persona
Suggestive
(Extravert)
Informative
(Emotionally
Stable)
Directive
(Emotionally
Unstable)
3 marks in total
1 mark for Ideas
1 mark for Connections
1 mark for Extensions
These features help to assess the
suitability of the application to the
Holistic Persona (e.g. an extravert
needs a mobile application).
... would allow Eliza to find groups of
people with similar interests, issues, and
ideas to discuss and socialize with
reduced pressure from her introverted
personality
7 Platform PC / Mobile /
Portable
... assuming that such a social girl would
have a relatively advanced phone ...
Participant demographics are provided in Table 3.
We can see that 87.0% of the sample population
were male and the remainder were female. Only 4%
in the sample population spoke and wrote in English
for less than three years and 96 % of the sample
population had lived in Australia or New Zealand or
UK or the USA during their youth. Most of the
sample population finished the study, including the
introductory session, within 70 minutes. The study
was conducted on-line using Qualtrics (2014).
The 23 participants’ scores for their conceptual
design, spatial ability and personalities were
analysed and the results are presented here. Table 4
presents the breakdown of the sample populations
according to their performance in design. The
sample population was divided into groups based on
ENASE2015-10thInternationalConferenceonEvaluationofNovelSoftwareApproachestoSoftwareEngineering
94
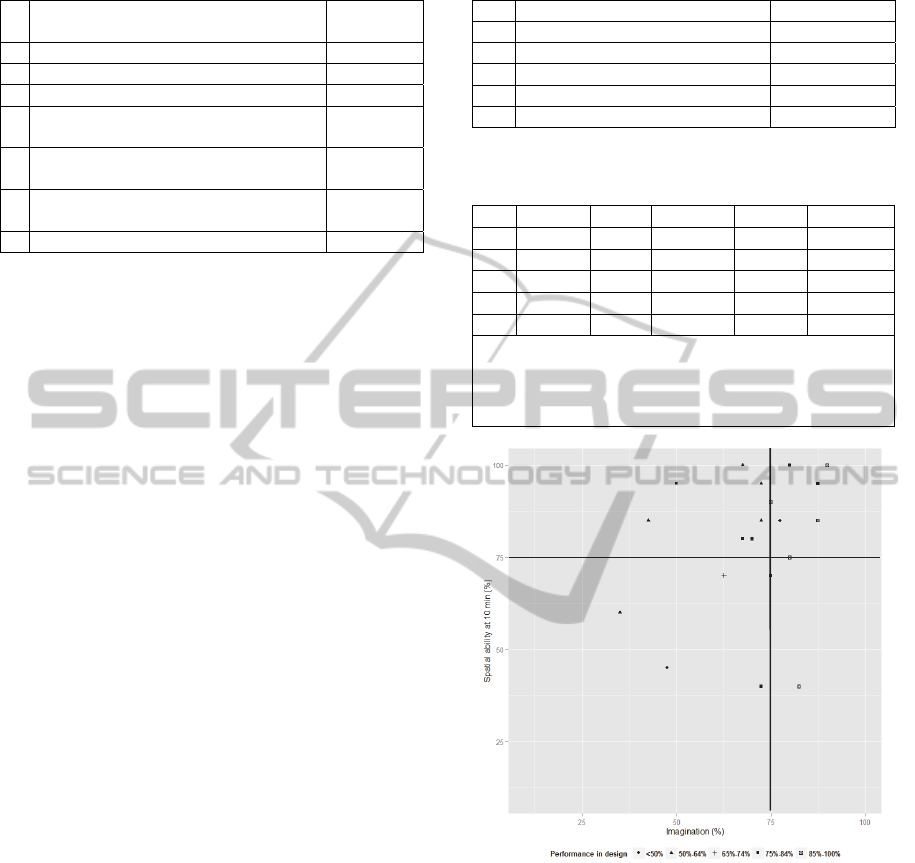
Table 3: Demographics of participants in the study.
No Participant demographic Participant
(%)
1 Male 87
2 Female 13
3
Native English speakers 87
4 Non native English speakers who have
spoken and written in English >3 years
9
5 Non native English speakers who have
spoken and written in English 1-3 years
4
6 Youth years spent in Australia, New
Zealand, UK or USA
96
7 2
n
d
year Software Engineering Students 91
their scores in imagination personality factor and
spatial ability. The groups were compared with one
another based on the influence that the abilities have
on their performance in design. The influence is
described using effect size, the Pearson’s correlation
coefficient, r, computed from the t-test (Field et al.
2012). Field et al. (2012) lists the description of
effect size as small when r = 0.1, medium when r =
0.3 and large when r = 0.5. Table 5 shows partial
correlation (r) of the five factors of personality with
the participant’s performance in design. Our sample
population indicates that there is a medium sized
relationship between imagination personality factor
and performance in design and it is significant
(r=0.45, p=0.056) having a shared variability of
20%.
4.2 Dividing Performance into Four
Quadrants
Since in our sample population, imagination
personality factor is the only personality factor
correlated with design performance, our further
analysis concerning performance in design is
restricted to the imagination personality factor and
spatial ability. Figure 1 shows a scatter plot of the
students’ performance in the spatial ability test at 10
minutes versus their imagination personality factor;
the points are labelled with their performance in
design. Figure 1 shows a group of students in the top
right hand corner who have performed well in
design. Using the area of the plot covered by this
group as a guide, Figure 1 is divided into four
quadrants. The first quadrant (Q1) is bounded by
those students who scored 75% or greater in spatial
ability (Ault and John 2010) and the imagination
personality factor; in most Australian universities
75% or greater is used to award the grade of
distinction. There are 8 participants in Q1.
The second quadrant (Q2) is bounded by those
students whose score in spatial ability is less than
Table 4: Performance in design.
No Performance in design (%) Participant (%)
1 85 -100 31
2 75 - 84 30
3
65 - 74 4
4 50 - 64 22
5 Less than 50 13
Table 5: Partial correlation of the performance in design
with personality factors study.
BFF pcor (r) r^2 t-value * p (>| t|) Effect size
Ext 0.08 0.01 0.32 0.75 small
Agr 0.07 0.01 0.31 0.76 small
Cn -0.01 0.00 -0.02 0.98 nil
ES -0.03 0.00 -0.13 0.90 nil
Img 0.45 0.20 2.05 0.056 medium
Legend: Ext - extraversion; Agr – agreeableness;
Cn – conscientiousness; ES - emotional stability;
Img – imagination; df – degrees of freedom;
pcor – partial correlation; p - probability. *(df=17)
Figure 1: Students’ performance.
75% but their score in the imagination personality
factor is equal to or above 75%. There are 2
participants in Q2. The third quadrant (Q3)
represents those students whose score in spatial
ability is equal to or above 75% but their score in the
imagination personality factor is below 75%. There
are 9 participants in Q3. The fourth quadrant (Q4) is
bounded by those students whose scores in spatial
ability and the imagination personality factor are
below 75%. There are 4 participants in Q4. Figure 1
shows most students in the first quadrant (88% of
the students in Q1) scored 80% or above for their
performance in design.
Q1
Q2
Q4
Q3
UsingPersonalityTraitsandaSpatialAbilityTesttoIdentifyTalentedAspiringDesignersinUser-CentredDesign
Methodologies
95

4.3 Five Scenarios to Study Results in
Four Quadrants
The students’ data were analysed using five
scenarios (see Table 6). In each scenario the
performance in design was studied for two groups.
The five scenarios are: (1) Effect of high
imagination and spatial ability: performance of the
group whose score in both imagination personality
factor and spatial ability are high (Q1) compared
with the rest of the sample population (Q2, Q3 &
Q4); (2) Effect of imagination: difference in
performance in design for the group of students
whose score in the imagination personality factor is
high (Q1 & Q2) versus other students (Q3 & Q4);
(3) Effect of spatial ability - high imagination:
difference in performance in design for the group of
students who scored high in both imagination
personality trait and spatial ability (Q1) versus the
students who only scored high in imagination
personality trait (Q2); (4) Effect of spatial ability:
difference in performance in design for the group of
students whose score in spatial ability is high (Q1 &
Q3) versus group of other students (Q2 & Q4); (5)
Effect of imagination - high spatial ability:
difference in performance in design for the group of
participants who scored high in both spatial ability
and imagination personality factor (Q1) versus the
students who only scored high in spatial ability (Q3).
4.4 Comparison of the Results in Four
Quadrants
Table 6 shows Mean (m), Standard Error (SE) and
Median for each group of students. The two groups
in each scenario are compared using Welch two
sample single tail t-test and the effect size (r)
between the two samples are described using the
Pearson’s correlation coefficient, r computed from
the t-test (Field et al. 2012).The null hypothesis (H0)
is that all groups are drawn from the same
population, hence the difference in means of the
different groups is zero, the alternate hypothesis
(H1) is that the difference in mean is greater than
zero.
Figure 2 shows five box plots of students’
performance in UCD conceptual design for each of
the five scenarios listed in Table 6:
Scenario 1 shows that the students who scored
high in both spatial ability and imagination
personality factor performed significantly higher in
design (m=82.1, SE=6.8) compared with the other
students’ performance in design (m=64.9, SE=5.0).
The Welch two sample single tail t-test indicates that
the difference in the means of the two samples is
significant at 5% (t=-2.0, df=14, p<0.05) and the
Pearson’s correlation coefficient shows the effect
Table 6: Analysis of students’ performance in design under five scenarios.
No Scenario Quadrants (Q) Mean
(m)
%
SE
%
Median
%
Welch two sample single tail t-test Effect
Size
(r)
t-test
df
p Reject H0 at
5% confidence
1 Effect of high
imagination and high
spatial ability
Q1 (SImg=>75%
& SpAb=>75%)
82.1 6.8 88.5 -2.0 14 0.030 True 0.5
Large
Q2, Q3 & Q4 64.9 5.0 70.0
2 Effect of imagination SImg =>75%
Q1 & Q2
82.1 5.4 87.0 -2.6 21 0.009 True 0.5
Large
SImg < 75%
Q3 & Q4
62.3 5.4 63.0
3 Effect of spatial
ability – high
imagination
SImg=>75%
Q1 (SpAb=>75%) 82.1 6.8 88.5 0.01 5 0.494 False 0.0
nil
Q2
(SpAb<75%)
82.0 NA 82.0
4 Effect of spatial
ability
SpAb=>75%
Q1 & Q3
72.4 5.1 80.0 -0.6 9 0.295 False 0.2
small
SpAb< 75%
Q2 & Q4
66.8 8.5 73.5
5 Effect of imagination
– high spatial ability
SpAb=>75%
Q1 (SImg=>75%) 82.1 6.8 88.5 2.0 15 0.035 True 0.5
Large
Q3 (SImg<75%) 63.7 6.6 63.0
Note: H0 - Hypothesis - True difference in mean is zero
H1 - Alternate Hypothesis - True difference in mean is greater than zero
Legend: Q – quadrant; df – degrees of freedom; p – probablity; SE – standard error;
SImg – score in imagination personality factor; SpAb – score in spatial ability.
ENASE2015-10thInternationalConferenceonEvaluationofNovelSoftwareApproachestoSoftwareEngineering
96
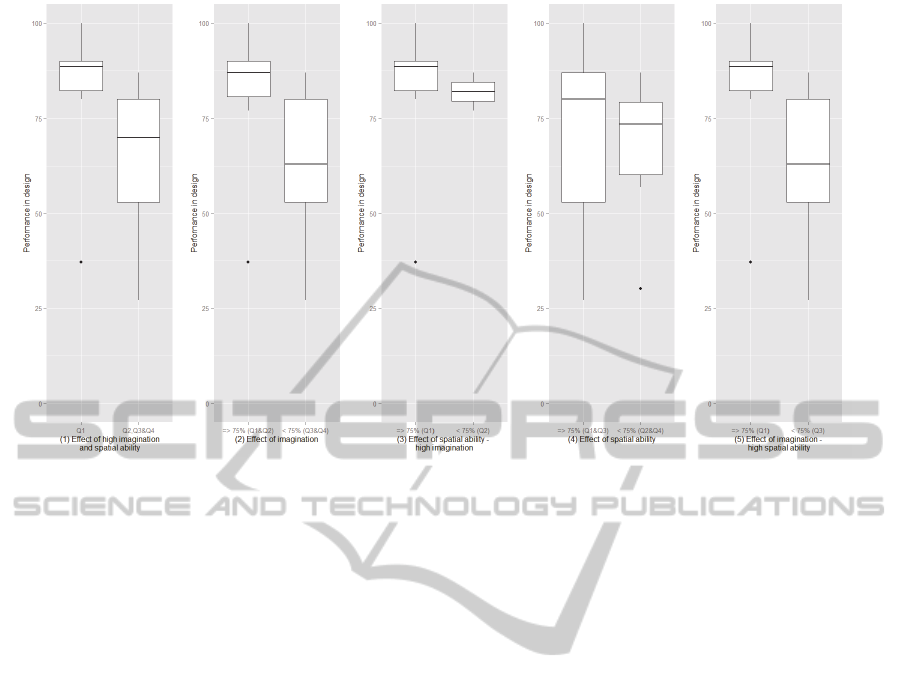
Figure 2: Box plots of the students’ performance in design for five scenarios.
size is large. The post design survey questionnaire
indicates that the students who scored high in both
spatial ability and imagination personality factor
were on average moderately engaged with the design
task.
Scenario 2 (Table 6 and Figure 2) shows that the
students who scored high in the imagination
personality factor performed significantly better in
design (m=82.1, SE=5.4) compared with the other
students’ performance (m=62.3, SE=5.4), (t=-2.6,
df=21, p<0.01).
Scenario 3 (Table 6) shows that the students who
scored high in both imagination personality factor
and spatial ability (m=82.1, SE=6.8) did not perform
significantly better than the students who only
scored high in imagination personality factor
(m=82.0). The Welch two sample single tail t-test
indicates that the difference in the means of the two
samples is not significant (t=0.01, df=5, p>0.05) and
the Pearson’s correlation coefficient shows the effect
size is nil. Only two students fall into Q2, hence no
inferences are made in regard to the effect of spatial
ability and UCD design when the designers have
high imagination.
Scenario 4 (Table 6) also shows that students
who scored high in the spatial ability test did not
perform significantly better than those whose spatial
ability score was not high (t=-0.6, df=9, p>0.05).
Scenario 5 (Table 6), shows that the students
who scored high in imagination personality factor
and spatial ability performed significantly better in
design (m=82.1, SE=6.8) compared with the
students who scored high in spatial ability but scored
low in imagination personality factor (m=63.7,
SE=6.6) (t=2.0, df=15, p<0.05).
From Table 5, imagination personality factor is
related to performance in design (r=0.45, p=0.056)
and, table 6 shows the combined effect of
imagination personality factor and spatial ability
significantly influence performance in design (t=-
2.0, df=14, p<0.05). In the sample population, the
correlation between performance in design and other
personality factors such as agreeableness,
extraversion and emotional stability is inconclusive.
The relationships between these personality factors
and performance in design will be explored further
in future work.
4.5 Participant’s Attitude towards
Design
After the design activity, the participants answered
questions about their experiences during their design
and previous experiences in spatial ability and
design. A summary of answers for participants who
have scored 75% or more in design activity is
presented in Table 7. In the sample of the
participants who performed well in design activity,
only 14% found the activity difficult and 36% did
not engage with the Holistic Persona during their
design activity.
UsingPersonalityTraitsandaSpatialAbilityTesttoIdentifyTalentedAspiringDesignersinUser-CentredDesign
Methodologies
97

Table 7: Participants’ responses to post design
questionnaire.
No Question Participants’
Responses (%)
A N D
1 Design activity was easy 64 22 14
2 I was totally engaged with the
Holistic Persona’s personality
50 14 36
3 I have done Spatial Ability test 7 93
4 Selection for design session was one
of my previous design work or I was
familiar with it.
21 79
Legend: A=Agree, N=Neutral, D=Disagree.
Note: This table presents the response of the participants
whose performance in design (table 4) was 75% or more
5 DISCUSSION
The participants were required to read the
description of the Holistic Persona (for an example
see Appendix), understand her requirements and
prepare a design work within fifteen minutes. A few
of the participants commented about the small
amount of time allocated for the design activity. The
range of designs including the level of detail and
quality was varied. A qualitative analysis of results
would be more suitable but it would also be prone to
subjectivity and variability.
Though in this study, the number of students
who participated is small, the results indicate that
students that scored high in the imagination
personality factor and spatial ability tests have learnt
the techniques of UCD and applied them in their
design work. In this paper we refer to them as
talented aspiring designers in UCD methodologies.
They can ‘think on their feet’. The effect of spatial
ability for UCD design requires further investigation
because in our study only 20% of the participants
who scored equal to or above 75% in imagination
personality traits scored less than 75% in spatial
ability.
The participants are categorised into quadrants
depending on their score in imagination personality
factor and spatial ability. The level of 75% or higher
selected for quadrant Q1 is based on the Australian
University standard for selecting distinguished
candidates. However the results indicate that there is
a positive relationship between spatial ability,
imagination and performance in UCD design.
5.1 Threats to Validity of the Study
and Measures to Overcome These
Threats to the validity of construct, conclusion,
internal and external of the study were identified and
measures taken to minimise their effects (Wohlin et
al. 2012) as described below.
5.1.1 Construct Validity Threats
Construct validity governs generalising the concepts
behind the experiment. Since the interaction between
personality traits, spatial and UCD abilities are
complex, the research question is exploratory. To
mitigate this threat the experiment has to be repeated
with samples drawn from a number of different
populations. This study is not significantly affected
by previous training as only 7% of the participants
who performed well in design have previously done
a spatial ability test and 21% produced a design that
they were familiar with (table 7).
5.1.2 Conclusion Validity Threats
One of the treats to conclusion validity is low
number of participants which affects the statistics
used to evaluate the results. There are 23 participants
in this study hence the conclusions are indicative
only. In order to mitigate ‘fishing for the results’
threat (Wohlin et al. 2012, p. 104), the influence of
participant’s scores in spatial ability and personality
factors on the results were removed by marking the
design activity separately and without reference to
other results from the study. Further, the marks for
design activity were checked independently by Hien
Minh Thi Tran, without knowledge of the
participants’ performances in spatial ability or their
score in personality factors.
5.1.3 Internal Threats
The internal threats included partial completion of
the study, maturation effect, boredom, fatigue,
interruption and learning effect. The participants’
answers were checked for soundness for each
section of the study. Below is an outline of
methodologies used to detect data that were not
sound.
Learning effect: to mitigate the learning effect
where students learn from the examples given during
introduction to UCD, no mention of personalities of
personas or users were made. The learning effect
from one another is very low as all participants
finished this study in one session.
ENASE2015-10thInternationalConferenceonEvaluationofNovelSoftwareApproachestoSoftwareEngineering
98

Boredom or fatigue: the time to answer the
personality rating questions was measured but not
displayed. A short answer time compared to average
answer time would indicate either boredom or
fatigue. It was found that one participant’s answer
time was shorter than expected. His data was
excluded as he did not present his design. Another
participant in one of the text entries in a later part of
the study indicated that he was bored. His data was
checked and found to be sound for the parts needed
in this paper.
Distraction during the spatial ability test: As the
performance in spatial ability test is based on the
first ten minutes of the test, any disruption such as
slow system response can affect their result. The
data for participants who performed well in the test
but their performance in the first ten minutes were
low were investigated. The time taken to answer
each question for those participants who performed
well in the test is checked. If the time taken to
answer one question is larger than the rest, then the
time is adjusted to the average time, disregarding
extreme values, taken by others to answer the same
question.
The analytic scoring rubric seeks to provide a
numeric score for the qualitative design and hence in
addition to quantitative assessment, it requires
qualitative assessment (Biggs and Tang 2011). In
order to prevent personal judgement affecting the
assessments, the markings are rated independently
by another experienced marker. In this paper little
allowances were made for qualitative assessment.
Lack of incentive to design well: As no rewards
are offered for the design work, some participants
might not have incentive to perform as well as they
could in the design. As the participants who
completed the study were motivated to take part
hence this was not considered to be a threat.
5.1.4 External Threats
External threats which relate to generalisation of the
study are: (1) the results cannot be generalised due
to limited sample size; (2) sample population in this
study are undergraduate students hence the results
would not extend to professionals.
We plan to mitigate external threats to generalise
the results of this study by conducting horizontal and
longitudinal studies. For horizontal studies we plan
to repeat the study a number of times using
participants from different population pools and
include more professionals from various industries.
These measures will increase the sample size and
provide for mix of population. For vertical studies
we plan to observe the students score in their design
subjects and their career choices and assess if there
is a correlation between their performance in this
study and their choices. However, we believe that
personality traits are not easily changed and hence
our results which rely on personality traits can be
extended to professionals.
6 CONCLUSIONS AND FURTHER
RESEARCH
This empirical study indicates that students, who
score above 75% in the imagination personality
factor, can think of design features that suit the
Holistic Persona within a short period of time; they
are identified as talented aspiring UCD designers.
The novel techniques presented in this paper
facilitates identification of talented aspiring
designers in UCD methodologies early in their
studies; they can benefit by receiving advanced
training. Likewise the less talented students can be
given extra tutoring. This study contributes to the
understanding of personality traits and abilities
required in being a talented designer using UCD
methodologies. Identification of these traits has
potential impact on team composition and designer
selection.
This study highlights the importance of the
imagination personality trait in performing well in
UCD design. Professional software engineers may
also have this personality trait and hence our results
may be extendable to professionals; which we wish
to investigate in future studies. Our study confirms
previous research that imagination is important for
design work (Feist 1998, Field 2007, Furnham and
Bachtiar 2008, Poropat 2009, Read et al. 2007,
Silvia 2008). To the best of our knowledge, this is
the first empirical study that reports on a specific
link between the performance of conceptual design,
spatial ability and the imagination personality of the
designers within software engineering and UCD
methodologies. We plan to investigate other
important characteristics for a UCD designer such as
interpersonal intelligence, employ sophisticated
tools to more accurately measure participants’
abstract thinking capabilities and performance.
ACKNOWLEDGEMENTS
The lead author acknowledges the assistance and
support Hien Minh Thi Tran provided. We thank
UsingPersonalityTraitsandaSpatialAbilityTesttoIdentifyTalentedAspiringDesignersinUser-CentredDesign
Methodologies
99

COMP255 Software Engineering Semester 2 2013
students and tutors at Macquarie University for their
participation in the study.
REFERENCES
Anvari, F., Richards, D., Hitchens, M. and Babar, M. A.
(2015) Effectiveness of Persona with Personality
Traits on Conceptual Design. in Companion
Proceedings of the 37th International Conference on
Software Engineering. in press.
Anvari, F. and Tran, H. M. T. (2013) Persona ontology for
user centred design professionals. in Proceedings of
the ICIME 4th International Conference on
Information Management and Evaluation, Ho Chi
Minh City, Vietnam.
Anvari, F., Tran, H. M. T. and Kavakli, M. (2013) Using
Cognitive Load Measurement and Spatial Ability Test
to Identify Talented Students in Three-Dimensional
Computer Graphics Programming. International
Journal of Information and Education Technology, pp.
94-99.
Aoyama, M. (2007) Persona-Scenario-Goal Methodology
for User-Centered Requirements Engineering, pp.185-
194.
Ault, H. K. and John, S. (2010) Assessing and Enhancing
Visualization Skills of Engineering Students in Africa:
A Comprehensive Study. Engineering Design
Graphics Journal, 74(2), pp. 12-20.
Biggs, J. and Tang, C. (2011) Teaching for quality
learning at university, McGraw-Hill International.
Bodner, G. M. and Guay, R. B. (1997) The Purdue
visualization of rotations test. The Chemical Educator,
2(4), pp. 1-17.
Butt, S. and Phillips, J. G. (2008) Personality and self
reported mobile phone use. Computers in Human
Behavior, 24(2), pp. 346-360.
Charyton, C., Jagacinski, R. J., Merrill, J. A., Clifton, W.
and DeDios, S. (2011) Assessing creativity specific to
engineering with the revised creative engineering
design assessment. Journal of Engineering Education,
100(4), pp. 778-799.
Chittaranjan, G., Blom, J. and Gatica-Perez, D. (2011)
Mining large-scale smartphone data for personality
studies. Personal and Ubiquitous Computing, 17(3),
pp. 433-450.
Cooper, A. (1999) The inmates are running the asylum. in:
Macmillan Publishing Company Inc.
Cooper, A. (2004) The inmates are running the asylum:
Why high-tech products drive us crazy and how to
restore the sanity (New ed.). Indianapolis, Ind.: Sams.
Costa, P. and McCrae, R. (1992) personality inventory
(NEO-PI-R) and NEO five-factor inventory (NEO-
FFI) professional manual, 1992. Psychological
Assessment Resources, Odessa, FL.
Feist, G. J. (1998) A meta-analysis of personality in
scientific and artistic creativity. Pers Soc Psychol Rev,
2(4), pp. 290-309.
Field, A., Miles, J. and Field, Z. (2012) Discovering
Statistics Using R, London, UK: SAGE Publications
Ltd.
Field, B. W. (2007) Visualization, intuition, and
mathematics metrics as predictors of undergraduate
engineering design performance. Journal of
Mechanical Design, 129(7), pp. 735-743.
Furnham, A. and Bachtiar, V. (2008) Personality and
intelligence as predictors of creativity. Personality and
Individual Differences, 45(7),
pp. 613-617.
Gardner, H. (1993) Multiple intelligences: The theory in
practice, Basic books.
Goldberg, L. R. (1993) The structure of phenotypic
personality traits. American psychologist, 48(1), p. 26.
Goodwin, K. (2009) Designing for the digital age. Indiana:
Wiley.
Grimes, D., Tan, D. S., Hudson, S. E., Shenoy, P. and
Rao, R. P. (2008) Feasibility and pragmatics of
classifying working memory load with an
electroencephalograph. in Proceedings of the SIGCHI
Conference on Human Factors in Computing Systems:
ACM. pp. 835-844.
Hu, R. and Pu, P. (2013) Exploring Relations between
Personality and User Rating Behaviors. in UMAP
Workshops.
IPIP (2013) International Personality Item Pool,
Available: http://ipip.ori.org/ (Accessed 2 July 2013).
Lohman, D. F. (2009) Identifying academically talented
students: Some general principles, two specific
procedures. in International handbook on giftedness:
Springer. pp. 971-997.
Long, F. (2009) Real or imaginary: The effectiveness of
using personas in product design. in Proceedings of
the Irish Ergonomics Society Annual Conference. pp.
1-10.
Maslow, A. H., Frager, R., Fadiman, J., McReynolds, C.
and Cox, R. (1987) Motivation and personality, 3rd
Edition ed., Harper & Row New York.
McCrae, R. R. (1987) Creativity, divergent thinking, and
openness to experience. J Pers Soc Psychol, 52(6),
pp. 1258.
Miaskiewicz, T. and Kozar, K. A. (2011) Personas and
user-centered design: How can personas benefit
product design processes? Design Studies, 32(5), pp.
417-430.
Mohler, J. L. (2006) Computer Graphics Education:
Where and How Do We Develop Spatial Ability?
Proceedings of Eurographics, Education Papers, pp.
79-86.
Norman, D. A. (1986) Cognitive engineering. User
centered system design, pp. 31-61.
Nov, O., Arazy, O., Lotts, K. and Naberhaus, T. (2013)
Motivation-Targeted Personalized UI Design: A Novel
Approach to Enhancing Citizen Science Participation.
pp. 287-297.
Oliveira, R. D., Cherubini, M. and Oliver, N. (2013)
Influence of personality on satisfaction with mobile
phone services. ACM Transactions on Computer-
Human Interaction, 20(2), pp. 1-23.
Plucker, J. A., Beghetto, R. A. and Dow, G. T. (2004)
ENASE2015-10thInternationalConferenceonEvaluationofNovelSoftwareApproachestoSoftwareEngineering
100
Why isn't creativity more important to educational
psychologists? Potentials, pitfalls, and future
directions in creativity research. Educational
Psychologist, 39(2), pp. 83-96.
Poropat, A. E. (2009) A meta-analysis of the five-factor
model of personality and academic performance.
Psychol Bull, 135(2), pp. 322-38.
Qualtrics (2014) qualtrics.com (viewed 6 Nov., 2014).
Read, S., Miller, L., Kostygina, A., Chopra, G.,
Christensen, J. L., Corsbie-Massay, C., Zachary, W.,
LeMentec, J.-C., Iordanov, V. and Rosoff, A. (2007)
The Personality-Enabled Architecture for Cognition
(PAC). in Affective Computing and Intelligent
Interaction: Springer. pp. 735-736.
Seffah, A. and Metzker, E. (2004) The obstacles and
myths of usability and software engineering.
Communications of the ACM, 47(12), pp. 71-76.
Shea, D. L., Lubinski, D. and Benbow, C. P. (2001)
Importance of assessing spatial ability in intellectually
talented young adolescents: A 20-year longitudinal
study. Journal of Educational Psychology, 93(3), pp.
604.
Silvia, P. J. (2008) Discernment and creativity: How well
can people identify their most creative ideas?
Psychology of Aesthetics, Creativity, and the Arts,
2(3), pp. 139.
Vredenburg, K., Mao, J.-Y., Smith, P. W. and Carey, T.
(2002) A survey of user-centered design practice. in
Proceedings of the SIGCHI conference on Human
factors in computing systems: ACM. pp. 471-478.
Wai, J., Lubinski, D. and Benbow, C. P. (2009) Spatial
ability for STEM domains: Aligning over 50 years of
cumulative psychological knowledge solidifies its
importance. Journal of Educational Psychology,
101(4), pp. 817-835.
Webb, R. M., Lubinski, D. and Benbow, C. P. (2007)
Spatial ability: A neglected dimension in talent
searches for intellectually precocious youth. Journal of
Educational Psychology, 99(2), pp. 397-420.
Wilson, K., Fornasier, S. and White, K. M. (2010)
Psychological predictors of young adults' use of social
networking sites. Cyberpsychology, Behavior, and
Social Networking, 13(2), pp. 173-177.
Winner, E. (2000) The origins and ends of giftedness.
American psychologist, 55(1), pp. 159.
Wohlin, C., Runeson, P., Höst, M., Ohlsson, M. C.,
Regnell, B. and Wesslén, A. (2012) Experimentation
in software engineering, Springer.
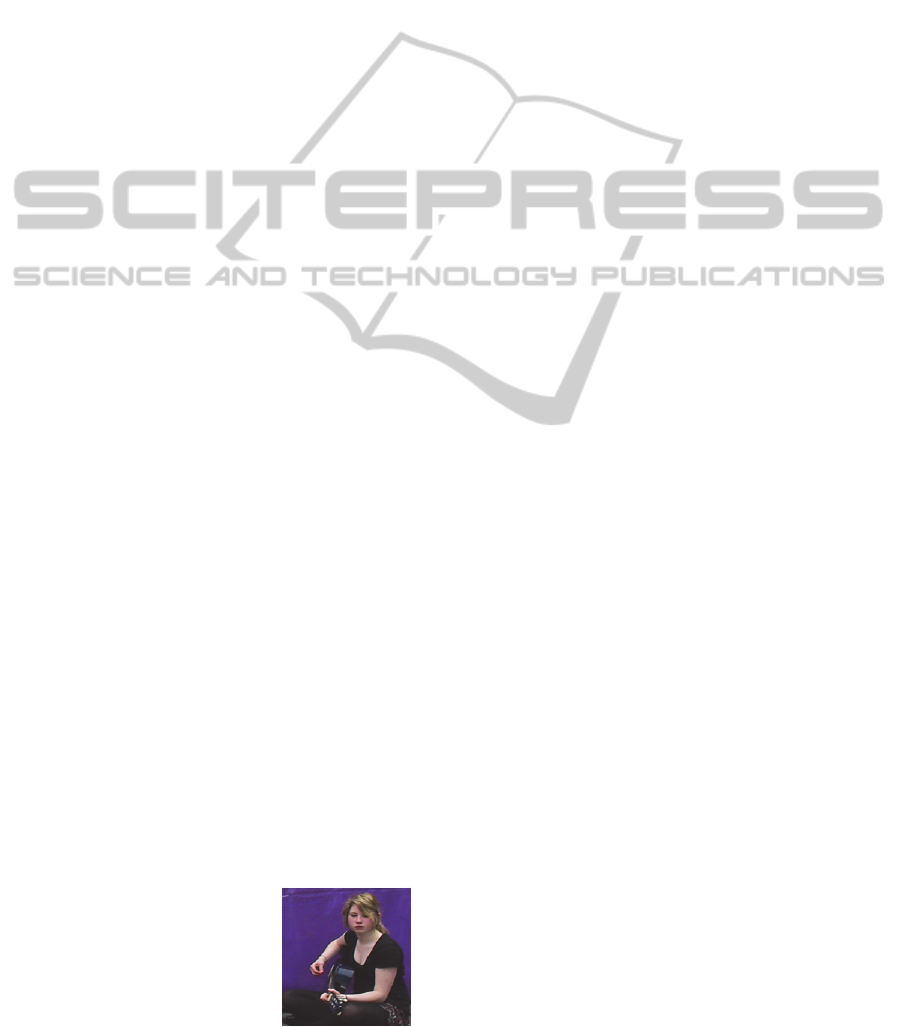
APPENDIX
The following Holistic Persona, Doris, represents an
archetypical user of the product or
software application which you
are designing or recommending to
her.
Doris’ grand-parents migrated
to Tasmania during the early
1940’s. Her parents are busy in their professional
careers. Doris is studying at the University of
Tasmania and is midway through her Bachelor of
Arts. Since childhood, she has had interest in music
and recently learnt to play guitar.
Doris is an outgoing person and likes to meets
people. She likes musical concert and attends all
musical events in Hobart. After the concerts, she
goes out with her friends to local restaurants. She
has a large collection of records and enjoys sharing
albums with her friends. Doris is an active member
of university clubs. Doris has many friends and
enjoys their company. She has been a long member
of the ‘Assisting Socially Disadvantaged Group’, a
volunteer group that help refuges and socially
disadvantaged people in Tasmania.
Doris is short sighted and has sensitive skin but
she often forgets to take her glasses with her or
apply sun-screen lotion when she goes out.
Doris is vocal and enjoys debates. She listens to
other people’s point of view and learns from the
experience. Doris’ friends feel that Doris is calm,
independent and confident. She makes plans for her
future and is full of hope. She does not worry if she
has to reject requests for help from her friends when
she is already committed. She knows her limits. She
always meets her commitments with high spirits.
Doris is allergic to peanut but she often forgets to
mention this fact while ordering her meals. Doris has
read about relationships between height, weight and
energy content of various foods.
Doris has realised that she is overweight and
wishes to reduce her weight.
UsingPersonalityTraitsandaSpatialAbilityTesttoIdentifyTalentedAspiringDesignersinUser-CentredDesign
Methodologies
101
