
The Recursive Disk Metaphor
A Glyph-based Approach for Software Visualization
Richard M
¨
uller
1
and Dirk Zeckzer
2
1
Information Systems Institute, Leipzig University, Leipzig, Germany
2
Institute of Computer Science, Leipzig University, Leipzig, Germany
Keywords:
Software Visualization, Glyph-based Visualization.
Abstract:
In this paper, we present the recursive disk metaphor, a glyph-based visualization for software visualization.
The metaphor represents all important structural aspects and relations of software using nested circular glyphs.
The result is a shape with an inner structural consistency and a completely defined orientation. We compare the
recursive disk metaphor to other state-of-the-art 2D approaches that visualize structural aspects and relations
of software. Further, a case study shows the feasibility and scalability of the approach by visualizing an open
source software system in a browser.
1 INTRODUCTION
Software is known to be complex, intangible, and in-
visible (Gra
ˇ
canin et al., 2005). A major challenge in
the field of software visualization is to give the ab-
stract artifact software a shape in order to explore and
to understand it. We present a glyph-based approach
to make structural software entities and eventually the
whole software system visible. Glyph-based visual-
ization is a form of visual design where a data set is
represented by a collection of visual objects referred
to as glyphs (Borgo et al., 2013). In more detail,
• ”[...] a glyph is a small visual object that can
be used independently and constructively to de-
pict attributes of a data record or the composition
of a set of data records;
• each glyph [...] can be spatially connected to con-
vey the topological relationships between data
records or geometric continuity of the underlying
data space; and
• glyphs are a type of visual sign that can make use
of visual features of other types of signs such as
icons, indices and symbols.” (Borgo et al., 2013)
To assemble the shape of software from scratch,
we start with the basic structural entities of software,
i.e., system, namespaces/packages, classes, methods,
and attributes. Further, relations should be shown
on demand to avoid visual clutter. Common visual-
ization techniques to represent structure and metrics
of software in 2D are node-link diagrams, Cartesian,
Voronoi, or circular treemaps, and Sunburst (Caserta
and Zendra, 2011). We map the entities to circular
glyphs. The spatial location of each glyph is predeter-
mined by the underlying structure of the software, i.e.,
by the containment relations of the entities. As glyphs
may contain other glyphs, they are constructed recur-
sively. For these reasons, we call this approach re-
cursive disk metaphor. We decided to dismiss global
space-efficiency for local space-efficiency allowing
a complete representation of namespaces/packages,
classes, inner classes, methods, and attributes. While
the resulting visualization is not space-filling as other
types of treemaps, it still uses space efficiently by
avoiding empty space between the glyphs and by
omitting the links. The empty space supports the for-
mation of characteristic patterns that can easily be
perceived.
We believe that the application of glyphs holds
benefits for software visualization, as one major
strength of glyphs is that patterns involving multiple
data dimensions may be more easily perceived (Ward,
2008):
1. We get a complete shape for the whole software
system representing all important structural enti-
ties and their relations. This leads to visually dif-
ferentiable class glyphs.
2. Design flaws may be easily detectable through
certain visual anti-patterns during software qual-
ity assessment.
171
Müller R. and Zeckzer D..
The Recursive Disk Metaphor - A Glyph-based Approach for Software Visualization.
DOI: 10.5220/0005342701710176
In Proceedings of the 6th International Conference on Information Visualization Theory and Applications (IVAPP-2015), pages 171-176
ISBN: 978-989-758-088-8
Copyright
c
2015 SCITEPRESS (Science and Technology Publications, Lda.)

2 RELATED WORK
Glyphs have been successfully applied in 2D soft-
ware visualization. (Chuah and Eick, 1998) map
software management data to timewheel and infobug
glyphs. (Pinzger et al., 2005) map structural and evo-
lutionary software metrics to Kiviat diagrams. (Boc-
cuzzo and Gall, 2007) map structural software met-
rics to well-known glyphs, such as houses, tables,
and spears. The final shape looks either well-shaped
or mis-shaped and allows conclusions concerning the
software design. Besides the unique visual patterns,
all approaches use the benefit of glyphs to view many
dimensions of the data simultaneously.
According to (Caserta and Zendra, 2011) current
state-of-the-art techniques to visualize static aspects
of software in 2D are Treemap (Shneiderman, 1992),
Circular Treemap (Wang et al., 2006), Sunburst (An-
drews and Heidegger, 1998; Stasko et al., 2000), De-
pendency Structure Matrix (Sangal et al., 2005), Hier-
archical Edge Bundles (Holten, 2006), Treemap met-
rics (Holten et al., 2005), Class Blueprint/Polymetric
Views (CodeCrawler) (Lanza, 2003; Ducasse and
Lanza, 2005), Voronoi Treemap (Balzer et al., 2005),
UML (Gutwenger et al., 2003), UML MetricView
(Termeer et al., 2005), UML Area of Interest (Byelas
Table 1: Completeness comparison between recursive disk
metaphor and 2D software visualizations of static aspects
(+ supported/– not supported).
Technique/ Tool
Package
Class
Inner Class
Method
Attribute
Relations
Treemap + + – – – –
Circular Treemap + + – – – –
Sunburst + + – – – –
Dep. Struc. Mat. + – – – – +
Hier. Edge Bund. + + – – – +
Treemap metrics + + – + – –
CodeCrawler – + – + + +
Voronoi Treemap + + + + + –
UML + + – + + +
UML MetricView + + – + + +
UML Area of Int. + + – + + +
Rigi + + – + + +
Recursive Disk + + + + + +
and Telea, 2006), and SHriMP Views (Rigi) (Storey
et al., 1997). However, all of these techniques do
not support all structural entities and relations. A
comparison of the completeness between the recur-
sive disk metaphor and these 2D software visualiza-
tions of static aspects is shown in Table 1. It shows
that the recursive disk metaphor is the only technique
that visually represents inner classes and relations.
Although, there are applications of radial layouts
(Stasko et al., 2000; Barlow and Neville, 2001; Wang
et al., 2006; Fischer et al., 2012), they are not very
widespread because of some drawbacks (Burch and
Weiskopf, 2014). First, they are not as space-efficient
as Cartesian treemaps (McGuffin and Robert, 2010).
Second, it is more difficult to estimate and compare
areas of circles (Cleveland and McGill, 1984). As
stated in the introduction, using a circular, glyph-
based approach uses space efficiently while allowing
the formation of patterns that facilitate the compari-
son of the structure.
3 THE RECURSIVE DISK
METAPHOR
In general, the recursive disk metaphor is applicable
to visualize software written in procedural and object
oriented languages. However, due to their popular-
ity, we focus on object-oriented languages. Hence,
we use Java as reference language to explain the
metaphor.
3.1 Glyph Design
A glyph consists of a graphical entity with compo-
nents, each of which has geometric attributes and ap-
pearance attributes (Ward, 2002). For the recursive
disk metaphor, we use the geometric attributes shape,
size, orientation, position, and direction as well as the
appearance attributes color and transparency.
3.1.1 Geometric Attributes
For each software entity, i.e., attribute, method, class,
and package as well as the system as a whole circular
glyphs are used. The circle for classes is divided into
one or more inner circles surrounded by rings. From
inside to outside, inner classes, attributes, and meth-
ods are mapped to these elements. If one of these en-
tities is missing, it is simply omitted. Attributes and
methods are represented by circle or ring segments.
The outermost ring of a class forms its border to dis-
tinguish it from other classes. In Java packages have
IVAPP2015-InternationalConferenceonInformationVisualizationTheoryandApplications
172

5
1
2
3
4
(a)
1
2
(b)
Figure 1: Basic glyphs and relations with the recursive disk
metaphor: (a) 1 - Package with five classes, 2 - General
classes with altogether eighteen methods and five attributes,
3 - Method class with two methods, 4 - Data class with four
attributes, 5 - Class with eight methods, eight attributes, and
three inner classes (b) 1 - Selected class, 2 - Superclass.
neither methods nor attributes. For this reason, they
are only represented by the border ring.
Attribute glyphs are all of the same size. The size
of a method glyph is estimated using its number of
statements. The size of a class glyph is determined
by the sum of the number of its attributes, the sizes
of its methods, and, if present, the sizes of its inner
classes
1
. All values are accumulated and represented
by area. Consequently, a class with a large size cov-
ers a large area. This area reflects the expense to read
and understand the source code of a certain class. As
the radius of the rings for packages and classes de-
pends on their elements, it is defined by the minimum
bounding circle.
3.1.2 Appearance Attributes
The default color mapping is chosen according to the
opponent process theory (Ware, 2004). As most peo-
ple with color deficiency view have problems distin-
guishing red and green, the combination of these col-
ors has been avoided. Consequently, the glyphs for at-
tributes are yellow, methods are blue, classes purple,
and packages are gray. An example of the appearance
of the different glyph types is shown in Figure 1 (a).
Relations between glyphs can be explored interac-
tively. They are visualized using opacity. Only glyphs
participating in a relation are opaque while all other,
unrelated glyphs are transparent. To visualize rela-
tions, a glyph has to be selected and the type of re-
lation has to be chosen. A selected glyph is marked
red. There are different types of relations depending
on the type of the glyph. For class glyphs there are
1
The original idea (Eisenecker, 2012) uses sizes of at-
tributes and methods that are proportional to their number of
characters of their identifier or definition. However, due to
technical restrictions, we use the approach described above.
supertypes and subtypes, for method glyphs there are
callers and callees, and for attribute glyphs there are
accessors. An example of showing the supertype of a
class glyph is illustrated in Figure 1 (b).
3.2 Placement Strategy
The layout of the glyphs is structure-driven combin-
ing a hierarchical and an ordered circular positioning
pattern (Ward, 2002). Hence, the class and pack-
age glyphs are arranged according to their hierar-
chy level and their net area. The net area is the ac-
tual area of a glyph derived from its containing ele-
ments. On the contrary, the gross area includes ad-
ditional empty space due to hierarchical placement.
The applied layout is a derivation of the classical cir-
cle packing algorithm (Wang et al., 2006). The dif-
ference is that the glyph with the largest net area is
placed in the center of the visualization and the re-
maining glyphs are ordered descending by their net
area and arranged clockwise around the largest glyph
in the center. This is done recursively for all class
and package glyphs on every hierarchy level. Addi-
tionally, the method glyphs in a class glyph are or-
dered clockwise descending according to their area.
Attribute glyphs are arranged in the same manner de-
pending on the size of their type. The result is a shape
with an inner structural consistency and a completely
defined orientation. The extension of the classical cir-
cle packing algorithm with the described placement
strategy facilitates the comparison of areas of differ-
ent glyphs. An example of the arrangement of one
package, five classes, and three inner classes is shown
in Figure 1 (a).
3.3 Implementation
The underlying technical approach for generating the
recursive disk metaphor combines the generative and
the model-driven paradigms (M
¨
uller et al., 2011). The
whole visualization pipeline and the applied imple-
mentation techniques are summarized in Figure 2.
The information needed for the visualization
is extracted from software systems and stored in
Famix (Nierstrasz et al., 2005). During the analysis,
these models are checked for syntactic and semantic
Extraction Analysis Filtering Mapping Rendering
Famix Eclipse Modeling Framework
X3D
X3DOM
HTML 5
Javascript
Figure 2: Visualization pipeline and implementation tech-
niques.
TheRecursiveDiskMetaphor-AGlyph-basedApproachforSoftwareVisualization
173
validity. They must conform to their meta-model and
fulfill some predefined rules, e.g., each entity must
have a unique identifier.
There are two types of filtering. The first one is
applied at build time. Here, the user can specify the
desired packages that should be visualized. Currently,
this is realized by a properties file. This will be re-
placed by a wizard in a future version. The second
one is applied at runtime and described in Section 4.1.
The mapping is realized by model transformations
and model modifications using the Eclipse Modeling
Framework (EMF, 2014). It is divided into two parts.
First, the valid and filtered entities from the input
model are mapped to a platform independent model.
Then, the layout of these entities is computed provid-
ing sizes and positions for the visualization. Second,
the platform independent model is mapped to a plat-
form specific one, here, Extensible 3D (X3D). Finally,
the X3D model is optimized for the web and con-
verted to X3DOM (Behr et al., 2012). The resulting
visualization is rendered by a browser.
4 CASE STUDY: FINDBUGS
Findbugs is an open source software that uses static
analysis to look for bugs in Java code (Findbugs,
2014). According to our analysis, version 3.0.0 has
61 packages, 1425 classes, 10541 methods, and 5413
attributes. Altogether, there are approximately 200K
LOC.
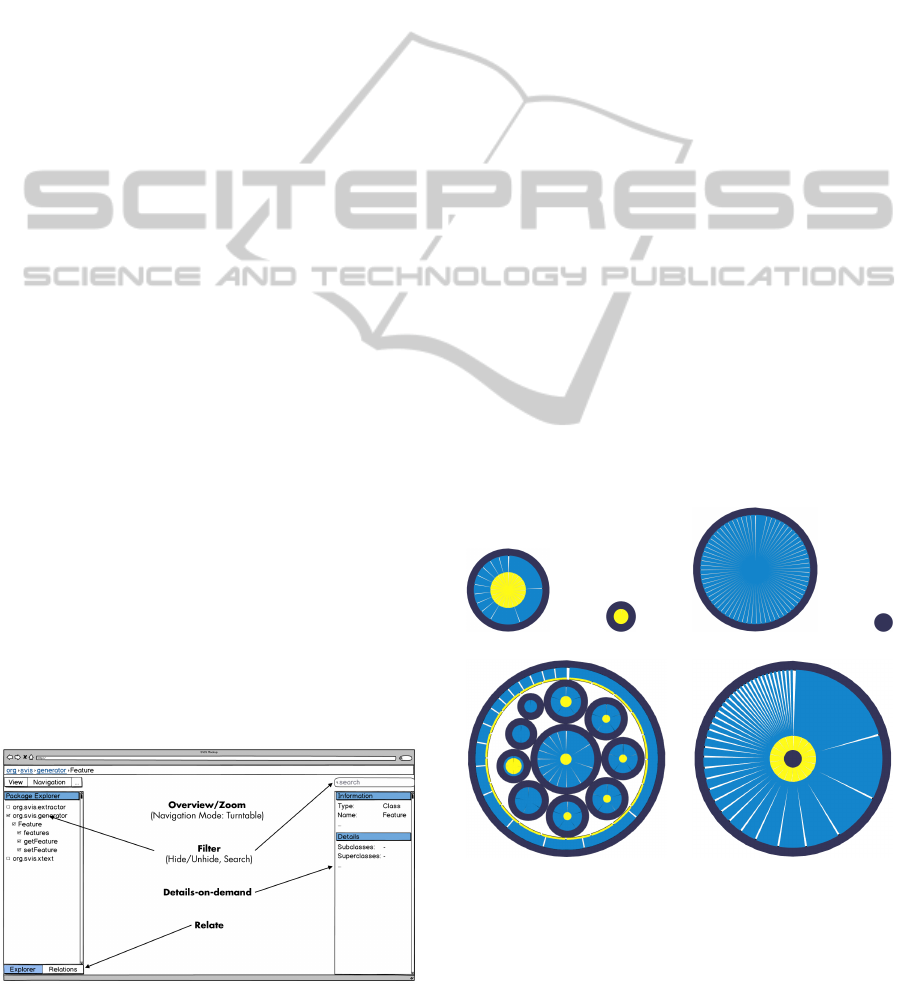
4.1 Navigation and Interaction
As depicted in Figure 3, currently the following inter-
action techniques are supported to explore Findbugs:
• Overview/Zoom: The navigation mode turntable
allows to zoom in and out, to rotate, and to pan.
• Filter: The entities can be hidden and unhidden
as well as searched for.
Figure 3: Mockup of the browser interface with focus on
interaction techniques.
• Details-on-demand: For each entity exists a de-
tailed view.
• Relate: Relations between entities can be shown.
From Shneiderman’s visualization mantra (Shnei-
derman, 1992), only history and extract are currently
not supported.
4.2 Visual Patterns
The glyph design and the placement strategy lead to
a specific appearance of glyphs on class level and on
system level forming unique visual patterns.
Hence, a visual differentiation of the kind of
classes is possible based on patterns. In Findbugs,
the following patterns occur. A general class with at-
tributes and methods has a yellow circle in its center
surrounded by a blue ring (Figure 4 (a)). A class with
only attributes is yellow (Figure 4 (b)). If it is not
a data class, it is an enumeration. A class with only
methods is blue (Figure 4 (c)). A class with neither
attributes nor methods results in a purple disk (Fig-
ure 4 (d)). The ring with a blue circle in its center
or the purple disk may be an abstract class or an inter-
face. Nested elements, such as inner classes or classes
in packages, lead to some empty space in the resulting
figure producing further recognizable visual patterns
(Figure 4 (e)).
The recursive disk metaphor can be used to as-
sess the quality of software by exploring visual pat-
(a) (b) (c) (d)
(e) (f)
Figure 4: Examples for patterns (a-d) and anti-patterns (e-f)
in Findbugs visualized with the recursive disk metaphor: (a)
General class with attributes and methods (Incompatible-
Types) (b) Enumeration (IdentityMethodState) (c) Abstract
class (BetterVisitor) (d) Interface (ComparableMethod) (e)
God class (FindRefComparison) (f) Brain class (Find-
NullDeref).
IVAPP2015-InternationalConferenceonInformationVisualizationTheoryandApplications
174
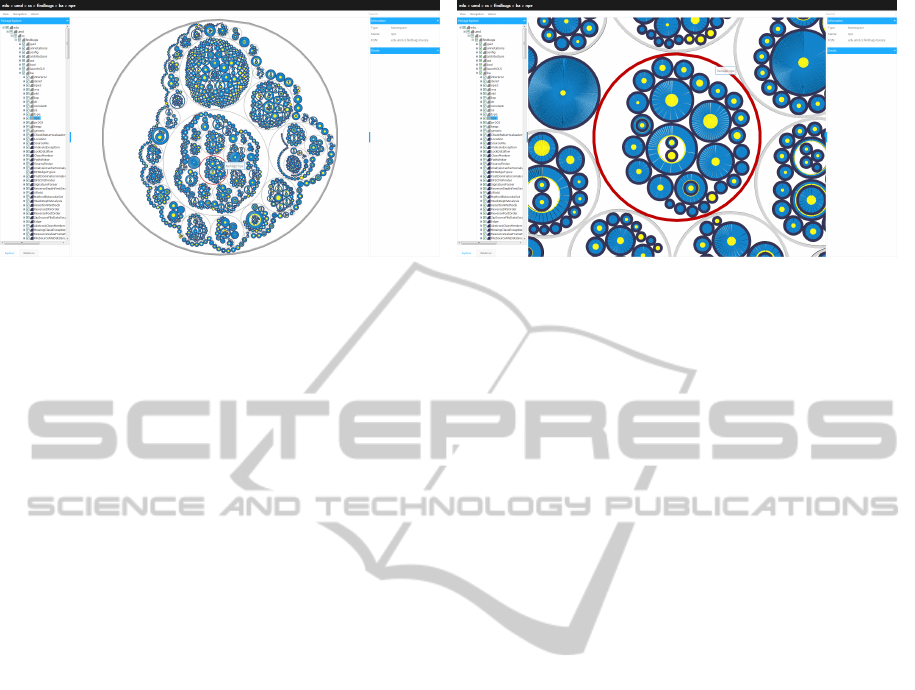
(a) (b)
Figure 5: The structure of Findbugs visualized with the recursive disk metaphor in a browser: (a) Overview (b) Zoom.
terns. Design flaws can be identified by anti-patterns.
Lanza et al. (Lanza et al., 2006) introduced several
anti-patterns, such as god class and brain class. An
example for each anti-pattern occurring in Findbugs
is shown in Figure 4 (e) and (f). Obviously, these two
classes have a different appearance and they are big-
ger than the other classes. Additionally, they tend to
appear in the center of their hierarchy level. Conse-
quently, they are readily detectable. We believe that
the recursive disk metaphor is ideally suited to de-
tect anti-patterns in software systems. While these
anti-patterns could in principle be detected automati-
cally (Lanza et al., 2006), the parameters for these de-
tection algorithms have to be established empirically.
Using visualization, no parameters are needed and
combinations of anti-patterns can be spotted (Wettel
and Lanza, 2008).
All these glyphs form the visualization in Fig-
ure 5. It contains two screen-shots of Findbugs visu-
alized with the recursive disk metaphor in a browser.
The left screenshot shows the structure of the whole
system and the right screenshot represents a detailed
view of a part of the system.
5 CONCLUSION AND FUTURE
WORK
We presented the recursive disk metaphor using
glyph-based visualization for software visualization.
The metaphor focuses on the structure of software
including all important entities from package to at-
tribute level as well as their relations. Additionally, it
has an inner structural consistency and a completely
defined orientation. Hence, the glyph-based approach
gives the per se intangible and invisible software a
shape. It produces unique visual patterns for class
structures and for anti-patterns. We compared the re-
cursive disk metaphor to related work and discussed
design decisions. Further, we outlined implementa-
tion details and presented the interface. Its feasibility
and scalability has been shown with a case study.
In the future, we intend to cover additional lan-
guages, such as C/C++ and .NET. Additionally, we
plan to compare our approach with established ap-
proaches for visually detecting anti-patterns (Wet-
tel and Lanza, 2008). Finally, a series of con-
trolled experiments is planned based on the approach
by (M
¨
uller et al., 2014) to empirically evaluate the
metaphor.
ACKNOWLEDGEMENTS
We would like to thank Ulrich Eisenecker for the ini-
tial idea of this metaphor (Eisenecker, 2012) and the
inspiring discussions.
REFERENCES
Andrews, K. and Heidegger, H. (1998). Information slices:
Visualising and exploring large hierarchies using cas-
cading, semi-circular discs. In InfoVis 1998, pages
9–11.
Balzer, M., Deussen, O., and Lewerentz, C. (2005). Voronoi
treemaps for the visualization of software metrics. In
Proc. 2005 ACM Symp. Softw. Vis., pages 165–172,
New York, USA. ACM Press.
Barlow, T. and Neville, P. (2001). A comparison of 2-D
visualizations of hierarchies. In InfoVis 2001, pages
131–138. IEEE.
Behr, J., Jung, Y., Franke, T., and Sturm, T. (2012). Using
images and explicit binary container for efficient and
incremental delivery of declarative 3D scenes on the
web. In Proc. 17th Int. Conf. 3D Web Technol., pages
17–26, New York, USA. ACM Press.
Boccuzzo, S. and Gall, H. (2007). CocoViz: Towards Cog-
nitive Software Visualizations. In 4th Int. Work. Vis.
Softw. Underst. Anal., pages 72–79. IEEE.
TheRecursiveDiskMetaphor-AGlyph-basedApproachforSoftwareVisualization
175

Borgo, R., Kehrer, J., Chung, D., Maguire, E., Laramee,
R. S., Ward, M., and Chen, M. (2013). Glyph-based
visualization: Foundations, design guidelines, tech-
niques and applications. Eurographics.
Burch, M. and Weiskopf, D. (2014). On the Benefits and
Drawbacks of Radial Diagrams. In Handb. Hum. Cen-
tric Vis., pages 429–451. Springer.
Byelas, H. and Telea, A. (2006). Visualization of areas of
interest in software architecture diagrams. In Proc.
2006 ACM Symp. Softw. Vis., pages 105–114, New
York, USA. ACM Press.
Caserta, P. and Zendra, O. (2011). Visualization of the
Static Aspects of Software: A Survey. IEEE Trans.
Vis. Comput. Graph., 17(7):913–933.
Chuah, M. and Eick, S. (1998). Information rich glyphs
for software management data. IEEE Comput. Graph.
Appl., 18(4):24–29.
Cleveland, W. and McGill, R. (1984). Graphical percep-
tion: Theory, experimentation, and application to the
development of graphical methods. J. Am. Stat. As-
soc., 79(387):531–554.
Ducasse, S. and Lanza, M. (2005). The class blueprint: vi-
sually supporting the understanding of classes. IEEE
Trans. Softw. Eng., 31(1):75–90.
Eisenecker, U. W. (2012). Ideas on the recursive disc
metaphor (audio file).
EMF (2014). Eclipse Modeling Framework.
http://www.eclipse.org/modeling/emf/. Accessed:
2014-11-05.
Findbugs (2014). Findbugs.
http://findbugs.sourceforge.net/. Accessed: 2014-11-
05.
Fischer, F., Fuchs, J., and Mansmann, F. (2012). ClockMap:
Enhancing circular treemaps with temporal glyphs for
time-series data. In Eurographics Conf. Vis., pages
97–101. ACM.
Gra
ˇ
canin, D., Matkovi
´
c, K., and Eltoweissy, M. (2005).
Software Visualization. Innov. Syst. Softw. Eng.,
1(2):221–230.
Gutwenger, C., J
¨
unger, M., Klein, K., Kupke, J., Leipert,
S., and Mutzel, P. (2003). A new approach for visual-
izing UML class diagrams. In Proc. 2003 ACM Symp.
Softw. Vis., pages 179–188, New York, USA. ACM
Press.
Holten, D. (2006). Hierarchical edge bundles: visualiza-
tion of adjacency relations in hierarchical data. IEEE
Trans. Vis. Comput. Graph., 12(5):741–8.
Holten, D., Vliegen, R., and van Wijk, J. (2005). Visual
Realism for the Visualization of Software Metrics. In
3rd Int. Work. Vis. Softw. Underst. Anal., pages 27–32.
IEEE.
Lanza, M. (2003). CodeCrawler - A Lightweight Software
Visualization Tool. In 2nd Int. Work. Vis. Softw. Un-
derst. Anal., pages 54–55.
Lanza, M., Marinescu, R., and Ducasse, S. (2006). Object-
Oriented Metrics in Practice: Using Software Metrics
to Characterize, Evaluate, and Improve the Design of
Object-Oriented Systems. Springer-Verlag Berlin Hei-
delberg.
McGuffin, M. J. and Robert, J.-M. (2010). Quantifying
the space-efficiency of 2D graphical representations
of trees. Inf. Vis., 9(2):115–140.
M
¨
uller, R., Kovacs, P., Schilbach, J., and Eisenecker, U.
(2011). Generative Software Visualization: Auto-
matic Generation of User-Specific Visualizations. In
Proc. Int. Work. Digit. Eng., pages 45–49, Magdeburg,
Germany.
M
¨
uller, R., Kovacs, P., Schilbach, J., Eisenecker, U.,
Zeckzer, D., and Scheuermann, G. (2014). A Struc-
tured Approach for Conducting a Series of Controlled
Experiments in Software Visualization. In Proc. 5th
Int. Conf. Vis. Theory Appl., pages 204–209, Lisbon,
Portugal.
Nierstrasz, O., Ducasse, S., and G
ˆ
ırba, T. (2005). The story
of moose: an agile reengineering environment. In
Proc. 10th Eur. Softw. Eng. Conf. held jointly with 13th
SIGSOFT Int. Symp. Found. Softw. Eng., volume 30 of
ESEC/FSE-13, pages 1–10, New York, USA. ACM.
Pinzger, M., Gall, H., Fischer, M., and Lanza, M. (2005).
Visualizing multiple evolution metrics. In Proc. 2005
ACM Symp. Softw. Vis., pages 67–75, New York,
USA. ACM Press.
Sangal, N., Jordan, E., Sinha, V., and Jackson, D. (2005).
Using dependency models to manage complex soft-
ware architecture. In Proc. 20th Annu. ACM SIG-
PLAN Conf. Object oriented Program. Syst. Lang.
Appl., New York, USA. ACM Press.
Shneiderman, B. (1992). Tree visualization with tree-maps:
2-d space-filling approach. ACM Trans. Graph.,
11(1):92–99.
Stasko, J., Catrambone, R., Guzdial, M., and McDonald, K.
(2000). An evaluation of space-filling information vi-
sualizations for depicting hierarchical structures. Int.
J. Hum. Comput. Stud., 53(5):663–694.
Storey, M., Wong, K., and M
¨
uller, H. (1997). Rigi: a visu-
alization environment for reverse engineering. In 19th
ACM Int. Conf. Softw. Eng., pages 606–607.
Termeer, M., Lange, C., Telea, A., and Chaudron, M.
(2005). Visual Exploration of Combined Architectural
and Metric Information. In 3rd Int. Work. Vis. Softw.
Underst. Anal., pages 21–26, Washington, DC, USA.
IEEE.
Wang, W., Wang, H., Dai, G., and Wang, H. (2006). Visu-
alization of large hierarchical data by circle packing.
In Proc. SIGCHI Conf. Hum. Factors Comput. Syst.,
pages 517–520, New York, USA. ACM Press.
Ward, M. (2002). A taxonomy of glyph placement strate-
gies for multidimensional data visualization. Inf. Vis.,
1:194–210.
Ward, M. O. (2008). Multivariate Data Glyphs: Principles
and Practice. In Handb. Data Vis., pages 179–198.
Springer.
Ware, C. (2004). Information visualization: perception for
design. Morgan Kaufmann, 2nd edition.
Wettel, R. and Lanza, M. (2008). Visually localizing design
problems with disharmony maps. In Proc. 4th ACM
Symp. Softw. Vis., pages 155–164, New York, USA.
ACM Press.
IVAPP2015-InternationalConferenceonInformationVisualizationTheoryandApplications
176
