
A Comparison on Supervised Machine Learning Classification
Techniques for Semantic Segmentation of Aerial Images of Rain Forest
Regions
Luiz Carlos A. M. Cavalcanti
1,2
, Jose Reginaldo Hughes Carvalho
2
and Eulanda Miranda dos Santos
2
1
Nokia Institute of Technology, Manaus, Brazil
2
Universidade Federal do Amazonas, Manaus, Brazil
Keywords:
Semantic Segmentation, Image Processing, Machine Learning, Classification.
Abstract:
Segmentation is one of the most important operations in Computer Vision. Partition of the image in several
domain-independent components is important in several practical machine learning solutions involving visual
data. In the specific problem of finding anomalies in aerial images of forest regions, this can be specially
important, as a multilevel classification solution can demand that each type of terrain and other components
of the image are inspected by different classification algorithms or parameters. This work compares several
common classification algorithms and assess their reliability on segmenting aerial images of rain forest regions
as a first step into a multi-level classification solution. Finally, we draw conclusions based on the experiments
using real images from a publicly available dataset, comparing the results of those classification algorithms
for segmenting this kind of images.
1 INTRODUCTION
One of the most important operations in Computer
Vision is segmentation. The aim of image segmen-
tation is the domain-independent partition of the im-
age into a set of regions which are visually distinct
and uniform with respect to some property, such as
grey level, texture or colour (Freixenet et al., 2002).
Semantic segmentation aims at pixel-wise classifi-
cation of images into high-level components and is
needed in challenging tasks such as remote sensing,
driving assistance systems or precise object localisa-
tion in general. The input image is divided into re-
gions, which correspond to the high-level objects of
the scene (Heitz and Koller, 2008).
The global community have spent a reasonable at-
tention on the deforestation records of the Amazon
rainforest. However, the Amazon region is threatened
by agents that take advantage of its dimension (larger
than most countries on earth). So far, most of the aca-
demic efforts are concentrated on statistics and mod-
elling of the ecosystem behaviour. This work, on the
other hand, is part of an effort to move from statis-
tics into action. Our goal to equip the preservation
agents and authorities with methodologies and tools
that enables them to take immediate action, so that
the deforestation in course can be stopped, not only
measured. A critical success factor of any tool is its
ability to automatic acquire and classify sensory data,
specially imagery information taken from aerial air-
crafts (manned or unmanned). It is important to men-
tion that the project’s final goal is not to provide a
fully automatic classification of aerial forest images,
but, rather, a supporting decision making tool to dra-
matically reduce the number of images to be analysed
by any human being from thousands to a few dozen
of candidate images. This work is about how the seg-
mentation process of Amazon’s rain forest aerial im-
ages could be done, before any relevant classification
of anomalies on those images.
In aerial images (orthographic photos), different
types of terrain have different characteristics that are
not always easily separable by a single segmenta-
tion criteria. Color or multi-spectral information is
very useful to the segmentation of aerial images, but
most existing methods which use multi-spectral fea-
tures alone tend to produce very noisy segmentation
maps(Dubuisson-Jolly and Gupta, 2000). If texture
features are used alone, for example, the localisation
of the region boundaries is not very accurate.
This is specially true when low-resolution im-
ages are the only ones available. Many are the is-
498
A. M. Cavalcanti L., Hughes Carvalho J. and Miranda dos Santos E..
A Comparison on Supervised Machine Learning Classification Techniques for Semantic Segmentation of Aerial Images of Rain Forest Regions.
DOI: 10.5220/0005300004980504
In Proceedings of the 10th International Conference on Computer Vision Theory and Applications (VISAPP-2015), pages 498-504
ISBN: 978-989-758-089-5
Copyright
c
2015 SCITEPRESS (Science and Technology Publications, Lda.)
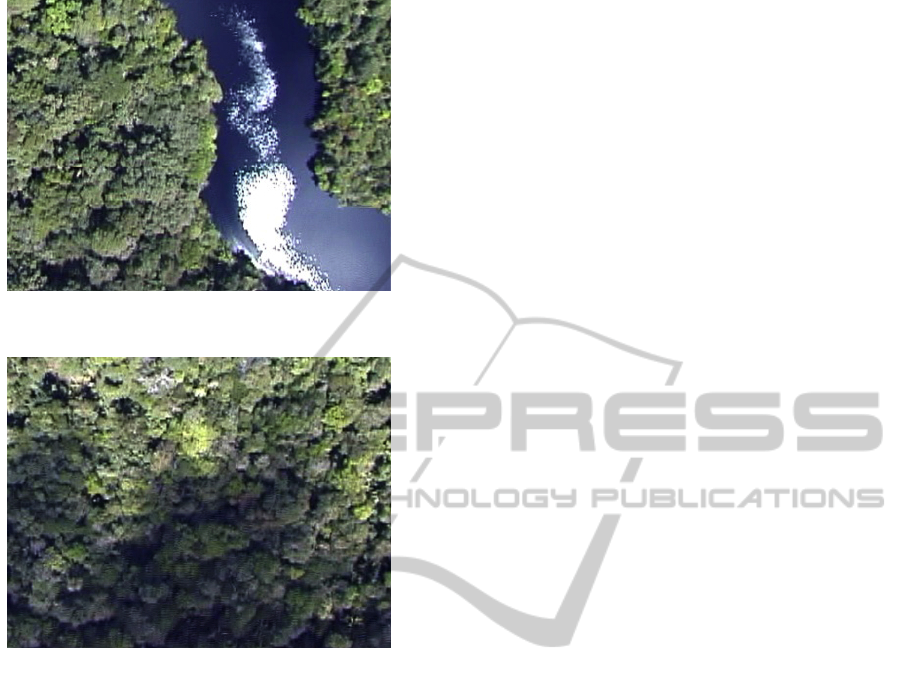
Figure 1: Sun’s reflex on water causing saturation (white
patch in lower right).
Figure 2: Clouds shadowing a patch of forest (the darker
lower part), which typically causes segmentation problems.
sues that could degenerate an aerial image quality and
cause some impact on a classification algorithm per-
formance: water bodies reflecting the sunlight can
cause saturation (fig. 1) and regions shadowed by
clouds can darken a region’s colour (fig. 2).
As seen in fig 3(a), a single criteria segmentation
can present good results to certain images, but very
bad to others. In the given example, Otsu’s threshold
segmentation method(Otsu, 1979) with two thresh-
olds fails to provide the desired number of connected
components (fig. 3(b)), finding too many high level
components (fig. 3(c)) and compromising the clas-
sification steps afterwards. A similar problem hap-
pens when we apply Watershed segmentation which,
as pointed out by (Li and Wan, 2010), often produces
over-segmented regions due to image noise and detail
information (fig. 3(d)).
As part of an effort to find anomalies in aerial im-
ages of rain forest regions such as human-made struc-
tures and environmental menaces, we surveyed seg-
mentation techniques that could separate the image
in its high-level components (i.e.: vegetation, water
bodies, human-made objects, etc) and provided an ac-
ceptable semantical segmentation of the images. This
necessity comes from the idea that everything that is
not common to the region’s scenery (something that
is neither vegetation nor water body) is of potential
interest.
We compare several machine learning techniques
that use combined criteria (texture, colour, morphol-
ogy, etc.) to provide a more accurate segmentation for
our needs. The same set of publicly available images
is used on all techniques investigated in this work,
so they could be compared to each other and with an
ideal segmentation that is expected by a specialist.
This work is organised as follows. Section 2 dis-
cusses related work both in single-criteria and multi-
criteria techniques. Section 3 details how the dataset
is organised, which features were extracted, why they
matter to the problem, which classification algorithms
were used and what was the overall workflow of the
experiment. Section 4 discusses the results of the ex-
periment. Finally, section 5 draw conclusions on the
experiment and discusses possible future works on the
subject.
2 RELATED WORK
(Pal and Pal, 1993) do a thorough survey on single-
criteria techniques for images segmentation, most of
them implemented by this work with poor results due
to the complexity of textures, colours and morphology
on the dataset used on this our work.
In his work, Dubuisson-Jolly (Dubuisson-Jolly
and Gupta, 2000) segments aerial images using multi-
criteria segmentation. They create two distinct seg-
mentations, by colour and by texture, and finally fuses
both using a Maximum Likelihood algorithm. The
outcome is a single segmentation for the image based
on the fusion of both criteria.
(Freixenet et al., 2002) survey several methods of
segmentation that integrate boundary and region in-
formation, exploring embedded integration and post-
processing integration of segmentation criteria. All
experiments were done in both real and synthetic im-
ages, finding very similar results. (Freixenet et al.,
2002) concluded that post-processing methods have
better results than embedded ones.
(Bosch et al., 2007) use Random Forest algo-
rithm to segment images and compared it to multi-
class Support Vector Machines, with comparable per-
formance on the problem of categorising objects in
scenes. The main advantage of Random forest over
multi-class SVM, the authors argue, is the simplicity
of training and test costs.
(Ghiasi and Amirfattahi, 2013) rely on colour and
AComparisononSupervisedMachineLearningClassificationTechniquesforSemanticSegmentationofAerialImagesof
RainForestRegions
499

(a) Original image (b) Expected segmentation
(3 components)
(c) Otsu’s method with 2
thresholds (237 compo-
nents)
(d) Watershed segmentation
(1,872 components)
Figure 3: Single-criteria segmentation techniques in this work’s dataset.
texture information to classify forest region images
using two separate KNN classifiers. New images are
broke down into super-pixels and then features are ex-
tracted. Using RGB channels and Local Binary Pat-
tern Histogram Fourier features (LBP-HF) (T. et al.,
2009), they achieved a success rate over 95% on the
test dataset.
Our work combines several features extracted by
the aforementioned works and experiment on several
commonly used classification algorithms to find a bet-
ter technique for segmenting aerial images of Amazon
rain forest regions.
3 EXPERIMENTAL
FRAMEWORK
Like (Heitz and Koller, 2008), we aim to classify pix-
els in an image to generate a segmentation map for it.
Every pixel must be in one of the three classes of the
problem:
• Vegetation: Grass, trees, swamped plants, etc
• Water bodies: Rivers, lakes, lagoons, swamps,
waterfalls, margins, etc
• Other: Everything that does not belong to the
aforementioned classes, potentially something
human-made or a strange natural object
The image database comes from the GEOMA
project (INPE, 2013) dataset. This dataset is com-
posed of aerial images of the Amazonian rain forest
region, taken with VGA cameras on board of manned
airplanes during a number of flights between Ama-
zon’s major urban centres. The complete database has
approximately 40,000 images (13 GB), from which
we used a single flight outcome, comprising of 3,031
images (1.02 GB). All images use 24-bit colour space
with dimensions of 640 per 480 pixels (0.3 MegaPix-
els). This dataset is publicly available at (INPE,
2014).
Gaussian blur is used on all images prior to any
feature extraction. This was found useful because rain
forest vegetation is very irregular and causes edge de-
tector filters to produce incorrect border information
(i.e. too many borders). Using a Gaussian Blur filter
before edge detection aims to reduce the level of noise
in the image (Deng and Cahill, 1993) and smooth bor-
ders, which improves the result of edge-detection al-
gorithms (Shapiro and Stockman, 2001). In this work
a Gaussian filter with a 5x5 convolution matrix and
σ = 2 were used.
A comparison is shown in Figure 5, where the re-
sults of a Sobel operator are presented for the same
original image, with (Figure 5(c)) and without (Fig-
ure 5(b)). In this example a reduction in improper
border detection can be seen.
From the whole dataset, 17 images where chosen
as good representations of the overall terrain found
in the remaining images. Some patches on those
images were labeled by a specialist as one of the
three classes of the problem and every pixel on those
patches had their features extracted to compose the
training dataset. A total of 4,000 pixels were used as
training data, distributed among the classes as shown
in table 1.
Table 1: Training dataset of pixels and its distribution
among the classes.
Class Samples
Vegetation 1,200
Water body 1,600
Other 1,200
Total 4,000
For every pixel, which represents a sample in this
work, we obtained a vector of features. Those features
represent relevant information on colour, brightness,
borders, neighbourhood and texture of the pixel or its
region.
To obtain colour and brightness information we
convert the RGB pixel into a HSB representation and
its channels (Hue, Saturation and Brightness) com-
VISAPP2015-InternationalConferenceonComputerVisionTheoryandApplications
500
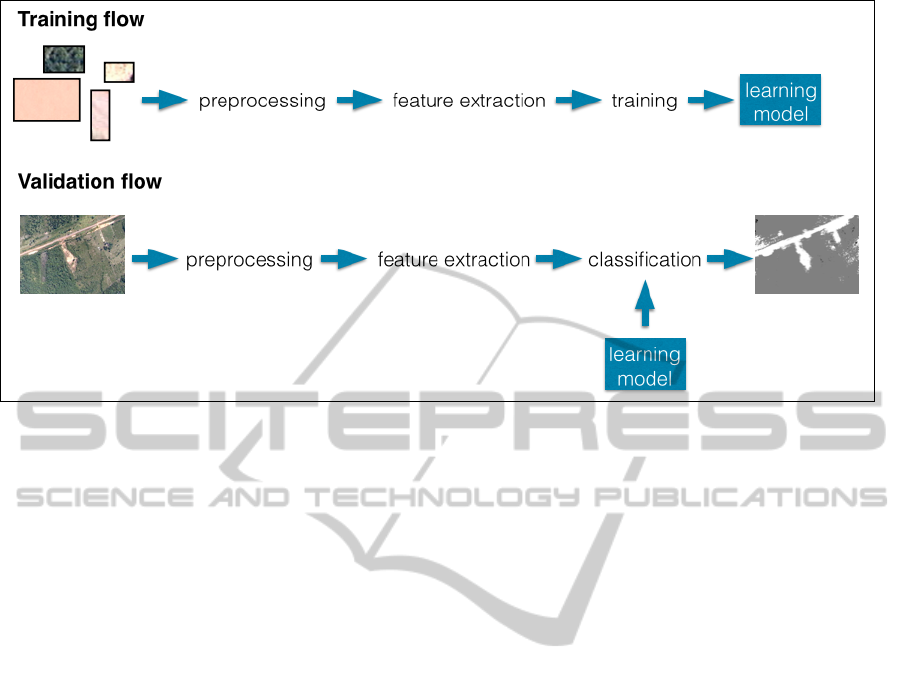
Figure 4: Overview of our approach. The training flow generates the learning models and the validation flow generates the
segmentation maps for validation images.
pose the feature vector. For edge detection and border
information, we extracted the difference of Gaussians
and Sobel operator information on the neighbourhood
(Nixon and Aguado, 2008).
Hessian features are also extracted to provide in-
formation on morphology and texture (Mikolajczyk
and Schmid, 2002). This includes a scalar repre-
sentation of the Hessian matrix, trace, determinant,
first and second eigenvalues, orientation, gamma-
normalized square eigenvalue difference and square
of gamma-normalized eigenvalue difference.
Provided that those are relatively complex fea-
tures, their representation in unidimensional variables
for every pixel and its neighbours makes the feature
vector grow quickly. In this work, using the afore-
mentioned features, the features vector contains 81
discrete numeric features. This is done for the labeled
pixels involved in the training phase but also for ev-
ery non-labeled pixels involved in the validation/test
phase, to compose the actual training and validation
datasets respectively.
This data was used for training all the algorithms
in this work, with the exact same attributes. A learn-
ing model was created for every algorithm using the
Waikato Environment for Knowledge Analysis tool
(Hall et al., 2009), also known as WEKA. The algo-
rithms in this work are all supervised. Decision trees,
KNN, Naive Bayes and Random forests were used.
For each learning algorithm, the parametrisation
used in this work was decided during the training
phase, using cross-validation in the training dataset as
the accuracy performance criteria. For KNN, a range
of k = [1, 7] was tested and the best results were with
k = 5 and Euclidean distance, so that’s the one used
throughout the experiment. In Random forests, the
maximum number of trees was 200 and the number
of features per tree was 40.
From the dataset, 500 images were chosen as val-
idation dataset. Each of their pixels had features ex-
tracted and were classified by the learning model gen-
erated on the training phase. Those same classified
pixels were used to render a segmentation map for ev-
ery image (Figure 6).
Evaluating semantic segmentation is often a
purely visual and subjective process, hence a special-
ist was responsible for analysing each one of the seg-
mented images for all techniques applied. For ev-
ery resulting segmentation map, the specialist was re-
sponsible to classify the whole image as an ”accept-
able” or ”unacceptable” semantic segmentation. The
percentage of ”acceptable” segmentation composes
the accuracy score of the methods in this work, and
comparisons are made by this criteria (Section 4).
The specialist was instructed that ”acceptable”
segmentations are comprised by well-defined and
continuous segmented regions compatible with the
expected semantic segmentation of the original im-
age. Some noise, or pixels with wrong classification,
is acceptable as long as it don’t form another contin-
uous region or an expressive area inside the correct
region. Were deemed ”non-acceptable” the segmen-
tation maps that violate any of those criteria.
The overview of our approach can be seen in Fig-
ure 4.
AComparisononSupervisedMachineLearningClassificationTechniquesforSemanticSegmentationofAerialImagesof
RainForestRegions
501

(a) Original image
(b) Sobel operator on unfiltered image
(c) Sobel operator on blurred image
Figure 5: A comparison between using a unfiltered and a
gaussian-blurred one in edge detection (Sobel operator).
4 RESULTS
All algorithms were trained with the same training
dataset and tested against the same validation dataset.
After a specialist evaluated every output for all al-
gorithms, we came with an accuracy percentage, rep-
resented by the segmentations assigned by the spe-
cialist as ”acceptable”.
Figure 6: Example of segmentation map generated by pixel
classification.
The figure 7 shows two examples of the experi-
ment’s output: a segmentation map, for every learning
algorithm used on both images. Black areas represent
”water bodies” class, grey areas represent ”vegeta-
tion” class, white areas represent ”other”. During the
experiment, Random forest algorithm (Figure 7(f))
had the most problems with ”water bodies” false-
positives, but had a superior semantic segmentation
in images without water elements. Decision tree (Fig-
ures 7(c) and 7(g)) did not cause many false-positive
problems, but usually overflowed classes’ edges in
more complex images, sometimes ruining the seman-
tic segmentation. KNN (Figures 7(d) and 7(h)) and
Naive Bayes attained a good overall segmentation but
had a lot of classification noise in regions that should
be contiguous.
The accuracy and average execution time (per
sample) for all tested algorithms are presented in table
2. The feature extraction processing time for a whole
image of the dataset (307,200 pixels) took longer than
expected: around 7023 milliseconds in a 2.4 GHz In-
tel Core i5 processor. This feature extraction time is
not considered in the algorithms average execution
time. Figures 8 and 9 show graphical comparisons
among methods’ error rate (linear scale) and average
execution time (logarithmic scale) respectively.
Table 2: Accuracy and average execution time for all algo-
rithms tested.
Algorithm Accuracy Execution time
Decision tree 82.2% 136 ms
KNN 92.6% 420,098 ms
Naive Bayes 92.8% 320 ms
Random forest 96% 3,542 ms
All algorithms, scripts and datasets used in this
work are publicly available under GNU General
Public License v2 (GPLv2) at http://github.com/
luizcavalcanti/ForestClassifier and it’s free to repro-
VISAPP2015-InternationalConferenceonComputerVisionTheoryandApplications
502
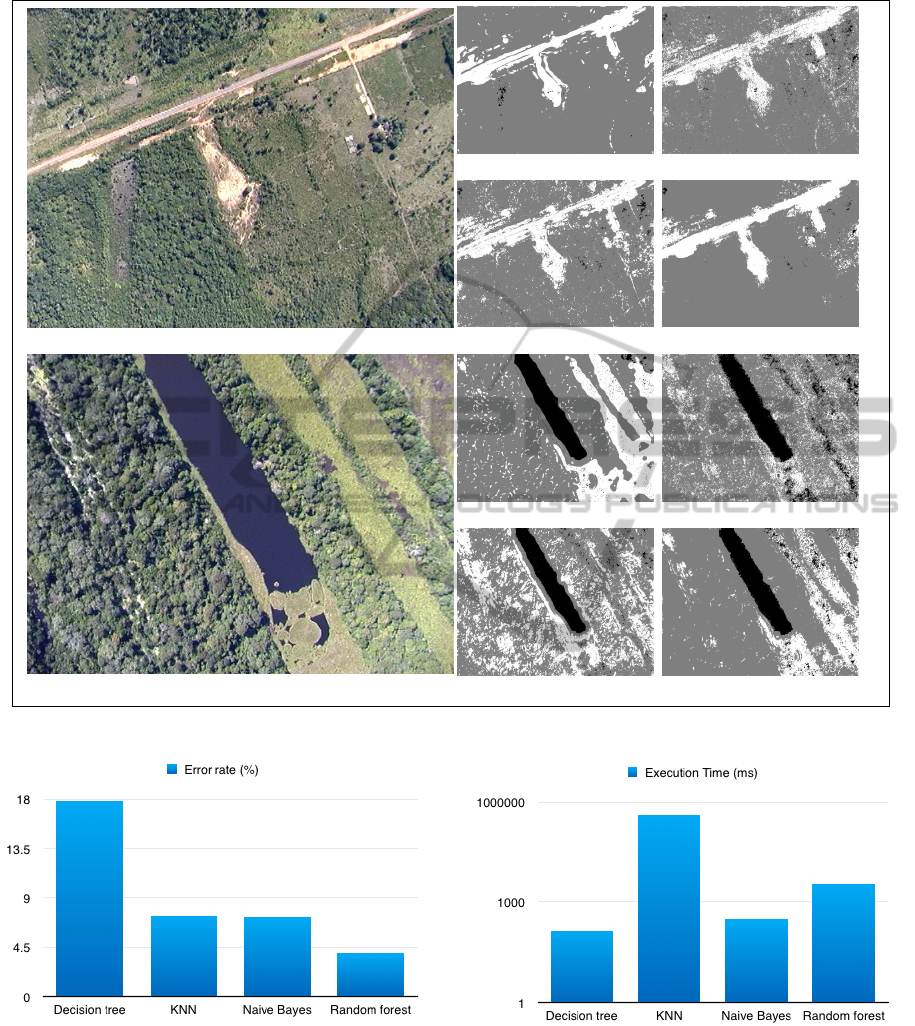
(a) Image A
(b) Image B
(c) Decision tree on A (d) KNN on A
(e) Naive Bayes on A (f) Random forest on A
(g) Decision tree on B (h) KNN on B
(i) Naive Bayes on B (j) Random forest on B
Figure 7: Visual comparison on segmentation results.
Figure 8: Comparison on error rate (linear scale).
duce, modify and distribute accordingly.
5 CONCLUSION AND FUTURE
WORKS
With over 90% of accuracy, some of the tested ma-
Figure 9: Comparison on execution time in milliseconds
(logarithmic scale).
chine learning algorithms are good approaches to
classification of aerial forest images with low reso-
lution. Naive Bayes and KNN algorithms had a fairly
good performance, but are still suffering from noise
in its learning models. KNN also has a computational
performance problem that needs further investigation,
since it takes 3 orders of magnitude more time than
AComparisononSupervisedMachineLearningClassificationTechniquesforSemanticSegmentationofAerialImagesof
RainForestRegions
503

Naive Bayes to classify samples. This could be re-
lated to the number of training samples that every new
sample needs to be compared to, but also to the di-
mensionality of the feature vector. A technique to re-
duce the number of comparisons should be tested.
Random forest clearly performs best in this
dataset, but we must find a way to address the false-
positives on water bodies, which is visibly larger than
in other methods. This is definitely a theme for future
works, as the overall performance of Random forest
was promising.
Future works should also include a improvement
on samples representation, making the feature extrac-
tion faster and reduce the feature vector dimension-
ality. Algorithms like KNN and SVM should bene-
fit from those improvements, specially the later, mak-
ing possible to reduce the support vector complexity
and make model generalisation easier. Another area
of possible improvement is in the image preprocess-
ing, prior to the feature extraction, specially reducing
noise. It is also important to test the same dataset with
unsupervised machine learning techniques and com-
pare to those in this work.
In general, the results were satisfactory in provid-
ing good directives on how to implement a efficient
and robust segmentation tool for the rainforest op-
eration scenarios. Amazon forest has been suffering
from years with systematic degradation and this work
is a small part of an effort to provide information and
supporting actions to mitigate the deforestation activ-
ities in the region.
ACKNOWLEDGEMENTS
This work was partially sponsored by Fundao de Am-
paro Pesquisa do Estado do Amazonas (FAPEAM)
under the ARTES project (No. 114/2014). The Nokia
Institute of Technology (INDT) also funded partially
this work.
REFERENCES
Bosch, A., Zisserman, A., and Munoz, X. (2007). Image
classification using random forests and ferns.
Deng, G. and Cahill, L. (1993). An adaptive gaussian filter
for noise reduction and edge detection. In Nuclear
Science Symposium and Medical Imaging Conference,
1993., 1993 IEEE Conference Record., pages 1615–
1619 vol.3.
Dubuisson-Jolly, M.-P. and Gupta, A. (2000). Color and
texture fusion: application to aerial image segmenta-
tion and gis updating. Image and Vision Computing,
18(10):823 – 832.
Freixenet, J., Munoz, X., Raba, D., Marti, J., and Cufi, X.
(2002). Yet another survey on image segmentation:
Region and boundary information integration. In Hey-
den, A., Sparr, G., Nielsen, M., and Johansen, P., ed-
itors, Computer Vision ECCV 2002, volume 2352 of
Lecture Notes in Computer Science, pages 408–422.
Springer Berlin Heidelberg.
Ghiasi, M. and Amirfattahi, R. (2013). Fast semantic seg-
mentation of aerial images based on color and texture.
In Machine Vision and Image Processing (MVIP),
2013 8th Iranian Conference on, pages 324–327.
Hall, M., Frank, E., Holmes, G., Pfahringer, B., Reutemann,
P., and Witten, I. H. (2009). The weka data min-
ing software: An update. SIGKDD Explor. Newsl.,
11(1):10–18.
Heitz, G. and Koller, D. (2008). Learning spatial context:
Using stuff to find things. In Computer Vision–ECCV
2008, pages 30–43. Springer.
INPE (2013). Projeto GEOMA http://www.geoma.lncc.br/.
INPE (2014). GEOMA public dataset of aerial images
https://github.com/luizcavalcanti/geoma-database.
Li, G. and Wan, Y. (2010). Improved watershed seg-
mentation with optimal scale based on ordered dither
halftone and mutual information. In Computer Sci-
ence and Information Technology (ICCSIT), 2010 3rd
IEEE International Conference on, volume 9, pages
296–300.
Mikolajczyk, K. and Schmid, C. (2002). An affine invari-
ant interest point detector. In Heyden, A., Sparr, G.,
Nielsen, M., and Johansen, P., editors, Computer Vi-
sion ECCV 2002, volume 2350 of Lecture Notes in
Computer Science, pages 128–142. Springer Berlin
Heidelberg.
Nixon, M. and Aguado, A. S. (2008). Feature Extraction &
Image Processing, Second Edition. Academic Press,
2nd edition.
Otsu, N. (1979). A threshold selection method from gray-
level histograms. Systems, Man and Cybernetics,
IEEE Transactions on, 9(1):62–66.
Pal, N. R. and Pal, S. K. (1993). A review on image segmen-
tation techniques. Pattern Recognition, 26(9):1277 –
1294.
Shapiro, L. G. and Stockman, G. (2001). Computer vision:
Theory and applications.
T., A., J., M., and M., H. C. . P. (2009). Rotation invari-
ant image description with local binary pattern his-
togram fourier features. In In: Image Analysis, SCIA
2009 Proceedings, Lecture Notes in Computer Science
5575, 61-70. ISBN 978-3-642-02229-6.
VISAPP2015-InternationalConferenceonComputerVisionTheoryandApplications
504
